 Open Access Article
A highly selective multi-responsive fluorescence sensor for Zn2+ based on a diarylethene with a 4,6-dimethylpyrimidine unit†
Xiaoxiao Wu,
Zhihui Zhang,
Hongliang Liu * and
Shouzhi Pu*
Jiangxi Key Laboratory of Organic Chemistry, Jiangxi Science and Technology Normal University, Nanchang 330013, PR China. E-mail: liuhongliang03@163.com; pushouzhi@tsinghua.org.cn; Fax: +86-791-83831996; Tel: +86-791-83831996
First published on 20th April 2020
Abstract
A novel turn-on mode fluorescent diarylethene containing a 4,6-dimethylpyrimidine unit was developed to fluorescently sense Zn2+. Its multiple-responsive properties induced by Zn2+/EDTA and ultraviolet/visible light have been systematically studied. The fluorescence sensor could efficiently detect Zn2+ with a 10 times enhancement of emission intensity and fluorescence color change (dark-green). In addition, the sensor showed clear discrimination from Cd2+. The limit of detection of the sensor was measured to be 8.48 × 10⁻⁸ mol L−1 for Zn2+. Finally, a molecular logic circuit was fabricated with the emission at 528 nm as the output signal and light and chemical stimuli as input signals.
Introduction
Chemosensors are a promising research field due to the simplicity of assays, low cost and high sensitivity for metal ions in industry, medicine, biology and the environment.1–4 In biological systems, metal ions play essential roles in different ways.5,6 Among all the metal ions, Zn2+ is the second most abundant transition metal ion in biological systems and is of utmost importance for maintaining normal cellular functions, such as cell division, repair of DNA, protein synthesis, mammalian reproduction, and muscle contraction.7–9 However, the abnormal accumulation of Zn2+ within the body could create serious health issues, such as myopathy, Alzheimer's disease, epileptic seizures, encephalopathy, and various cancers.10,11 Consequently, it is highly desirable for developing effective ways for monitoring Zn2+,12 which would provide an effective and promising approach to study its physiological and pathological processes.13The usual detection procedures include traditional techniques, such as, chromatography, voltammetric and ion selective electrodes. However, many of these methods have their own disadvantages such as expensive instrument, insufficient sensitivity and analytes interference.14,15 To date, much effort has been made to seek ways for detecting and tracing Zn2+. Among the various available techniques for sensing Zn2+, fluorescence detection was much more preferable, because fluorescent probes have shown many promising advantages, including high sensitivity, real-time detection, quantitative capabilities, low cost, and easy operation.16–18 In general, since Cd2+ and Zn2+ are in the same group of the periodic table and have similar spectral response, how to eliminate the interference of Cd2+ during Zn2+ detection is a thorny problem.33–37 Undoubtedly, it is very important to design fluorescent sensor for the selective quantification of Zn2+ without interference from Cd2+ and other metal ions.
In order to deeply understand the crucial role of Zn2+ in important life processes, large amounts of Zn2+ fluorescent sensors have been accepted and effectively applied in vivo.19–24 Among the reported fluorescent chemosensors for detecting Zn2+,25–28 diarylethenes are considered one of the most potential candidates due to their remarkable fatigue resistance, excellent thermal stability, rapid response and multi-responsively photoswitchable properties under various stimulations.29–32 To date, numerous diarylethene-based fluorescent sensors with various functional groups have been developed for the detection of Zn2+. Pyrimidine derivatives have gained much interest in the field of drugs, agriculture chemicals, and many biological processes. However, diarylethene-based fluorescent sensors with pyrimidine unit for detecting Zn2+ are relatively less known.
In this paper, we reported a novel photochromic diarylethene-based fluorescence sensor for Zn2+ with a 4,6-dimethylpyrimidine structure (Scheme 1). It could recognize Zn2+ with high selectivity and sensitivity through a strong blue-shift together with a remarkable fluorescence enhancement in acetonitrile solution. Furthermore, it could clearly discriminate Zn2+ from Cd2+ and other metal ions.
Experimental
General methods
All chemical reagents were provided by chemical reagent companies and used as received without further purification. The metal ions (Al3+, Ca2+, Pb2+, Mg2+, Cr3+, Cd2+, Mn2+, Fe3+, Sr2+, Ag+, Ba2+, Ni2+, Co2+ and Cu2+ as nitrates, and K+, Ba2+, Hg2+, and Sn2+ as chlorides) used in metal ion selectivity experiments were dissolved in double-distilled water. EDTA solution (0.1 mol L−1) was prepared with Na2EDTA in double-distilled water. Melting point was performed on a WRS-1B melting point apparatus. 1H NMR and 13C NMR spectra were recorded on a Bruker AV400 (400 MHz) NMR spectrometer using DMSO-d6 and CD3CN as the solvent and chemical shifts were expressed in ppm using TMS as an internal standard. The ESI-mass spectrum was obtained using on a Bruker AmaZon SL spectrometer. The UV-vis experiments were conducted using an Agilent 8453 UV/vis spectrophotometer and the fluorescence spectra measurements were performed on a Hitachi F-4600 spectrofluorometer. Photoirradiation experiments were measured using an MUL-165 UV lamp and a MVL-210 visible lamp.Synthesis of compound 1O
Scheme 2 shows the synthesis route of the diarylethene, 1-(2,5-dimethyl-3-thineyl)-2-{2-methyl-5-[4-hydroxyl-3-(2-hydrazinobenzylidene-4,6-dimethylpyrimidine)-phenyl]-3-thienyl}perfluorocyclopentene (1O). The diarylethene salicylaldehyde derivative (3) was prepared by adaptation of literature procedures.38–40Compound 2 (ref. 39) (3.10 g, 6.0 mmol) was cooled in dry CH2Cl2 at 195 K under nitrogen with vigorous stirring, followed by addition of BBr3 (12.0 mL). The reaction mixture was stirred for 0.5 h at 195 K, and then warmed to room temperature for another 48 h. The resulting mixture was extracted with CH2Cl2, and then washed with water. The resulting solution was dried over Na2SO4. After filtration and solvent evaporation, compound 3 (0.75 g, 1.5 mmol) was well-separated via silica gel chromatography (eluent: petroleum ether/ethyl acetate (40![[thin space (1/6-em)]](https://www.rsc.org/images/entities/char_2009.gif) :
:![[thin space (1/6-em)]](https://www.rsc.org/images/entities/char_2009.gif) 1)) in 35% yield. Mp 401–402 K. 1H NMR (DMSO-d6, 400 MHz), δ (ppm): 1.85 (s, 3H), 1.91 (s, 3H), 2.41 (s, 3H), 6.84 (s, 1H), 7.07 (d, 1H), 7.39 (s, 1H), 7.81 (d, 2H), 10.30 (s, 1H), 11.00 (s, 1H) (Fig. S1†). 13C NMR (DMSO-d6, 100 MHz), δ (ppm): 13.8, 14.6, 118.2, 121.8, 122.4, 123.4, 124.2, 124.3, 125.1, 125.3, 133.1, 138.1, 139.6, 140.2, 140.6, 160.4, 190.9 (Fig. S2†). MS (ESI+): m/z 503.0560 [M + H+]+ (calc. 503.0569) (Fig. S3†).
1)) in 35% yield. Mp 401–402 K. 1H NMR (DMSO-d6, 400 MHz), δ (ppm): 1.85 (s, 3H), 1.91 (s, 3H), 2.41 (s, 3H), 6.84 (s, 1H), 7.07 (d, 1H), 7.39 (s, 1H), 7.81 (d, 2H), 10.30 (s, 1H), 11.00 (s, 1H) (Fig. S1†). 13C NMR (DMSO-d6, 100 MHz), δ (ppm): 13.8, 14.6, 118.2, 121.8, 122.4, 123.4, 124.2, 124.3, 125.1, 125.3, 133.1, 138.1, 139.6, 140.2, 140.6, 160.4, 190.9 (Fig. S2†). MS (ESI+): m/z 503.0560 [M + H+]+ (calc. 503.0569) (Fig. S3†).
A mixture of compound 3 (0.10 g, 0.2 mmol) and 2-hydrazino-4,6-dimethylpyrimidine (4) (0.028 g, 0.2 mmol) in refluxing methanol were stirred for 6 h. Then the crude product was further recrystallized from methanol. Diarylethene 1O was obtained as a light yellow solid with a 70% yield. Mp 384–385 K. 1H NMR (DMSO-d6, 400 MHz), δ (ppm): 1.86 (s, 3H), 1.90 (s, 3H), 2.33 (s, 6H), 2.42 (s, 3H), 6.70 (s, 1H), 6.84 (s, 1H), 6.95 (d, 1H), 7.38 (s, 1H), 7.47 (d, 1H), 7.72 (s, 1H), 8.29 (s, 1H), 11.60 (s, 1H), 12.04 (s, 1H) (Fig. S4†). 13C NMR (DMSO-d6, 100 MHz), δ (ppm): 13.9, 14.6, 23.5, 112.1, 117.1, 119.6, 121.2, 123.5, 124.0, 124.3, 125.1, 126.0, 127.0, 138.1, 140.0, 141.5, 141.6, 157.0, 159.0, 167.6 (Fig. S5†). MS (ESI+): m/z 623.1415 [M + H+]+ (calc. 623.1368) (Fig. S6†).
Results and discussion
Photochromism properties of 1O
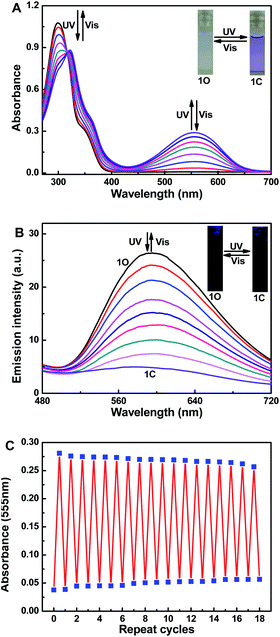
The UV-vis spectroscopy and fluorescence changes of 1O induced by photoirradiation have been studied in CH3CN (2.0 × 10⁻⁵ mol L−1). The open-ring isomer 1O exhibited an adsorption band at 299 nm attributed to π–π* transitions at room temperature (Fig. 1A).41 Upon ultraviolet light irradiation (λ = 297 nm), the absorption bands at 298 nm decreased and a new visible absorption band at 555 nm (ε = 1.45 × 10⁴ mol−1 L cm−1) increased gradually, indicating the corresponding closed-ring isomer 1C was generated. At the same time, the photo-induced color of 1O changed from colorless to purple (Fig. 1A). A stable isosbestic point occurred at 311 nm when the photostationary state was reached, demonstrating the occurence of a two-component photochromic reaction.42–44 Conversely, upon visible light irradiation (λ > 500 nm), the purple closed-ring isomer 1C reverted to the colorless open-ring isomer 1O by cycloreversion reaction, and its absorption peak shifted back to 298 nm. Similar to most reported diarylethenes,45–47 the fluorescence emission of 1O in CH3CN also revealed the photochromic reaction occured (Fig. 1B). The open-ring isomer 1O displayed a dark yellow emission with an emission peak at 595 nm under excitation at 365 nm. Under ultraviolet light irradiation (λ = 297 nm), the emission intensity at 595 nm was gradually quenched to ca. 18.0% in the photostationary state due to the photocyclization product 1C generated.48 Upon back visible light irradiation (λ > 500 nm), the emission spectra of 1C was gradually increased and recovered to the original state of 1O. In addition, the fatigue resistance of 1O was also determined by alternating irradiation of ultraviolet and visible lights at room temperature. Undergo 18 times of the coloration–decoloration cycle, the emission intensity of 1O was degraded by only 10%, as illustrated in Fig. 1C.Spectral response of Zn2+
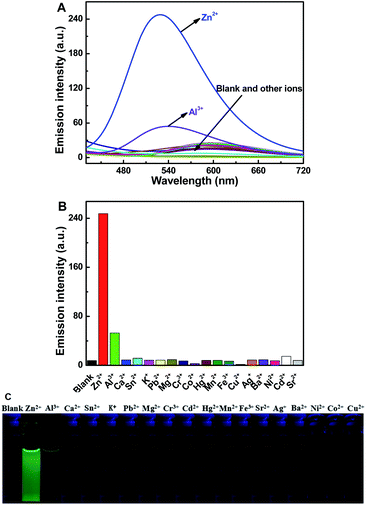
As shown in Fig. 2, the fluorescence selectivity of sensor 1O toward 18 different various metal ions (Zn2+, Al3+, Ca2+, Sn2+, K+, Pb2+, Mg2+, Cr3+, Cd2+, Hg2+, Mn2+, Fe3+, Sr2+, Ag+, Ba2+, Ni2+, Co2+ and Cu2+) was studied in CH3CN (2.0 × 10⁻⁵ mol L−1). As illustrated in Fig. 2A, 1O exhibited a weak fluorescence emission at 595 nm. Upon addition 1 equiv. of Zn2+, the fluorescence emission peak of 1O showed a dramatic enhancement by 10 times and blue-shifted to shorter wavelength region at 528 nm due to the complex 1O–Zn2+ (1O′) form (Fig. 2A and B). The apparent fluorescence emission color varied from dark yellow to bright green (Fig. 2C). However, upon individual addition of other metal ions, they showed no obvious fluorescence variations except Al3+. Although a weak fluorescence response of 1O toward Al3+ was also observed, the emission intensity was increased less than 3 folds and the dark green fluorescence color of 1O–Al3+ (540 nm) was distinguishable from 1O–Zn2+. Moreover, it is noteworthy that there was no interference of Cd2+ (Fig. 2B), indicating high selectivity of Zn2+. These data demonstrated the high selectivity of sensor 1O toward Zn2+.The absorption spectra response of sensor 1O induced by Zn2+ and ultraviolet/visible lights in CH3CN was also investigated (Fig. 3). As shown in Fig. 3A, the absorption peak of 1O at 299 nm decreased when increasing concentrations of Zn2+, and a new absorption peak at 412 nm gradually increased due to the formation of complex 1O′ (Fig. 3A). With the addition of Zn2+, the solution color varied from colorless to light yellow. As shown in Fig. 3B, a dramatic absorption enhancement at 412 nm was found upon gradual addition of Zn2+ (0 to 9 equiv.) to 1O solution. And the absorption intensity reached a plateau when 2 equiv. of Zn2+ was added. Upon ultraviolet light irradiation (λ = 297 nm), a new absorption peak of complex 1O′ at 570 nm (ε = 2.33 × 10⁴ mol−1 L cm−1) appeared and increased due to the formation of the closed-ring isomer 1C′ (1C–Zn2+ complex).49 At the same time, a visual color varied from light yellow to dark purple was observed (Fig. 3C). Upon the addition of Zn2+, the absorption intensity of 1C at 555 nm enhanced gradually with a moderate red shift (15 nm), indicating complex 1C′ formation (Fig. 3D). However, as shown in Fig. 3A and D, on addition excess EDTA to 1O′ and 1C′ solution, the absorption spectra of 1O and 1C could not be restored, respectively. The result elucidated that two isomers of 1 had large affinity for Zn2+ and readily competes with EDTA for Zn2+ resulting in the irreversible response of 1O and 1C to Zn2+.50 In general, in order to detect metal ions, chemosensors bind with the target metal ions through non-covalent interactions to yield stable coordination complexes.51 The Zn2+ ion should have a stronger binding energy to the sensor 1 than EDTA. The stronger affinity of sensor 1 to Zn2+ can not be reversed by EDTA.
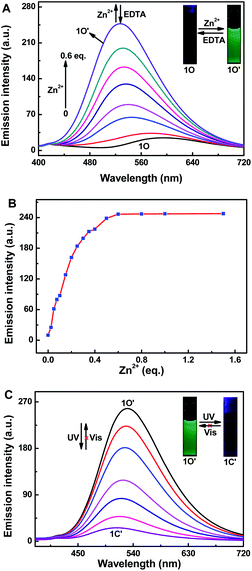
To further elucidate the sensing behavior of 1O for Zn2+ detection, we carried out the fluorescence titration test with Zn2+ (Fig. 4). When increasing concentrations of Zn2+ (0 to 1.5 equiv.), the fluorescence intensity of 1O at 595 nm increased gradually accompanied by an obvious red-shift of 67 nm (Fig. 4A). And the fluorescence intensity reached a plateau until the concentration of Zn2+ reached 1 equiv. The fluorescence enhancement displayed good linearity in the Zn2+ concentration range 0–12 μM (Fig. 4B). Upon ultraviolet light irradiation (λ = 297 nm), the fluorescence intensity of complex 1O′ nm was gradually quenched to ca. 18.0% in the photostationary state due to the closed-ring isomer 1C′ generated, and a concomitant color varied from bright green to dark green (Fig. 4C). As shown in Fig. S7,† the fluorometric titration of 1C by Zn2+ was also tested. Sensor 1C displayed emission peak at 595 nm, a blue-shift by 77 nm and increased fluorescence intensity (∼10 folds) were observed with increasing concentrations of Zn2+. At the same time, the fluorescent color varied from dark to dark green.
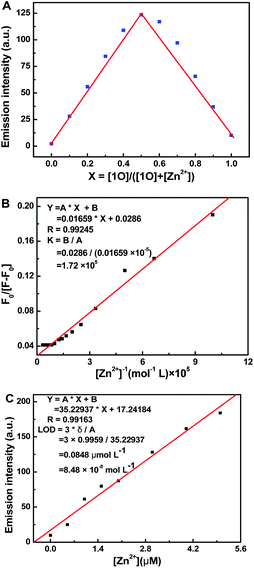
Job's plot analysis was used to estimate the binding parameters of 1O with Zn2+.52 When the mole ratio of (1O)/[(1O) + (Zn2+)] appeared at 0.5, the maximum emission intensity of 1O′ at 528 nm was observed, indicating a 1![[thin space (1/6-em)]](https://www.rsc.org/images/entities/char_2009.gif) :
:![[thin space (1/6-em)]](https://www.rsc.org/images/entities/char_2009.gif) 1 complexation stoichiometry of 1O with Zn2+ (Fig. 5A). The association constant (Ka) of the 1O–Zn2+ complex was measured as 1.72 × 10⁵ L mol−1 using Benesi–Hildebrand analysis (Fig. 5B).53 Additionally, the fluorescence sensor 1O provided a low Zn2+ fluorescence detection limit of 8.48 × 10⁻⁸ mol L−1 (Fig. 5C),54 which was much lower than the maximum contaminant level (76 μmol L−1) for Zn2+ in drinking water set by in the WHO. To further confirm the preferential selectivity of the fluorescence sensor 1O for Zn2+ detection, we investigated the fluorescence responses of sensor 1O to Zn2+ in the presence of various competing metal ions (Fig. S8†). In the presence of Al3+, Ca2+, Sn2+, K+, Mg2+, Cr3+, Pb2+, Hg2+, Mn2+, Fe3+, Ag+, Ba2+, Cd2+, and Sr2+, there was small or no interference for Zn2+ detection, while Co2+, Cu2+ and Ni2+ partially inhibited the emission intensity of the 1O–Zn2+ complex. These experiments indicated that 1O had high selectivity for Zn2+ detection as a fluorescence chemosensor.
1 complexation stoichiometry of 1O with Zn2+ (Fig. 5A). The association constant (Ka) of the 1O–Zn2+ complex was measured as 1.72 × 10⁵ L mol−1 using Benesi–Hildebrand analysis (Fig. 5B).53 Additionally, the fluorescence sensor 1O provided a low Zn2+ fluorescence detection limit of 8.48 × 10⁻⁸ mol L−1 (Fig. 5C),54 which was much lower than the maximum contaminant level (76 μmol L−1) for Zn2+ in drinking water set by in the WHO. To further confirm the preferential selectivity of the fluorescence sensor 1O for Zn2+ detection, we investigated the fluorescence responses of sensor 1O to Zn2+ in the presence of various competing metal ions (Fig. S8†). In the presence of Al3+, Ca2+, Sn2+, K+, Mg2+, Cr3+, Pb2+, Hg2+, Mn2+, Fe3+, Ag+, Ba2+, Cd2+, and Sr2+, there was small or no interference for Zn2+ detection, while Co2+, Cu2+ and Ni2+ partially inhibited the emission intensity of the 1O–Zn2+ complex. These experiments indicated that 1O had high selectivity for Zn2+ detection as a fluorescence chemosensor.
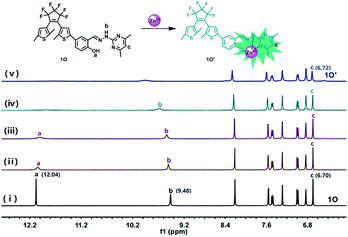
The 1H NMR analysis was initiated to demonstrate the binding interaction between sensor 1O and Zn2+ in CD3CN (Fig. 6). On addition of Zn2+, the resonance signal of the –OH proton (Ha, 12.04) completely disappeared ultimately, suggesting that the O atom of –OH might coordinate to Zn2+.55 Besides, the –NH– (Hb, 9.48) signal of 1O showed a significant downfield shift and declined gradually, which corresponded to the protonation of –NH–, suggesting the N–Zn2+ coordinate bond was formed. Meantime, the signal of hydrogen (Hc) on the pyrimidine shifted from 6.70 ppm to 6.72 ppm, suggesting that the N atom of the pyrimidine unit might coordinate to Zn2+. These results indicated that the O atom on –OH and the N atoms on –NH– and the pyrimidine unit were the most probably binding sites. To further confirm the formation of the 1O–Zn2+ complex, the ESI mass spectral analysis was also performed. As shown in Fig. S9,† the major peak at m/z 685.0577 was assigned to [1O + Zn2+ + H+]+ (calcd 685.0492), advocating a 1![[thin space (1/6-em)]](https://www.rsc.org/images/entities/char_2009.gif) :
:![[thin space (1/6-em)]](https://www.rsc.org/images/entities/char_2009.gif) 1 bonding mode of 1O with Zn2+.
1 bonding mode of 1O with Zn2+.
Application in logic circuit
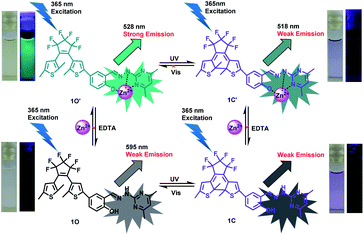
The multi-responsive behaviors of sensor 1O have been investigated under stimuli by Zn2+/EDTA and ultraviolet/visible lights (Fig. 7). Therefore, an idealized logic circuit consisting of four input signals (ultraviolet light works as In1, visible lights works as In2, Zn2+ works as In3 and EDTA works as In4) and one output signal (the fluorescence emission intensity at 528 nm) was designed (Fig. 8). The four input signals in the logic circuit could be either ‘on’ or ‘off’ state, corresponding to the different Boolean values of ‘1’ or ‘0’. When 297 nm ultraviolet light was employed, In1 was assigned as ‘1’ corresponding to the ‘on’ states of the readout signals. Likewise, In2 was assigned as ‘1’ by irradiation with visible light (λ > 500 nm), In3 was assigned as ‘1’ when Zn2+ was added and In4 was assigned as ‘1’ when EDTA was added. The emission intensity of 1O at 528 nm was considered to be the original value. When the emission intensity at 528 nm was 5 folds greater than the original value, the output signal could serve as ‘1’ corresponding to the ‘on’ states of the readout signals. If not, it was defined as an ‘off’ state. According to the Fig. 7, all possible logic strings were derived in the logic circuit (Fig. 8) and the corresponding truth table is listed in Table 1.56,57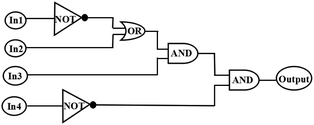 | ||
| Fig. 8 The combinational logic circuits equivalent to the truth table given in Table 1: In1 (297 nm light), In2 (λ > 500 nm light), In3 (Zn2+), In4 (EDTA) and output (strong fluorescence at 528 nm). | ||
| Inputs | Output (λem = 528 nm) | |||
|---|---|---|---|---|
| In1 (UV) | In2 (vis) | In3 (Zn2+) | In4 (EDTA) | |
| a When the emission intensity at 528 nm more than 5-folds of the original state, the output signal is defined as ‘1’, otherwise defined as ‘0’. | ||||
| 0 | 0 | 0 | 0 | 0 |
| 0 | 0 | 0 | 1 | 0 |
| 0 | 0 | 1 | 0 | 1 |
| 0 | 1 | 1 | 0 | 1 |
| 0 | 1 | 1 | 1 | 1 |
| 1 | 0 | 0 | 0 | 0 |
| 1 | 1 | 0 | 0 | 0 |
| 1 | 1 | 1 | 0 | 1 |
| 1 | 0 | 1 | 0 | 0 |
| 1 | 0 | 0 | 1 | 0 |
| 1 | 0 | 1 | 1 | 0 |
| 1 | 1 | 1 | 1 | 1 |
| 1 | 1 | 0 | 1 | 0 |
| 0 | 1 | 0 | 1 | 0 |
| 0 | 0 | 1 | 1 | 1 |
| 0 | 1 | 0 | 0 | 0 |
Conclusions
In this work, a new type of multi-responsive fluorescence sensor based on a diarylethene derivative with a 4,6-dimethylpyrimidine unit was developed. The sensor was highly selective and sensitive toward Zn2+ with a lower limit of detection (8.48 × 10⁻⁸ mol L−1). Furthermore, an integrated circuit with multiple control switches was successfully constructed based on its multiple stimuli-responsive fluorescence switching behavior. All results provided a useful strategy for the construction of new fluorescent chemosensors based on diarylethenes for the recognition of specific metal ions in the future.Conflicts of interest
There are no conflicts of interest to declare.Acknowledgements
This research was financially supported by the Natural Science Foundation of China (21861017, 41867052, 41867053), the Project of Jiangxi Science and Technology Normal University Advantage Sci-Tech Innovative Team (2015CXTD002), the Science Funds of Jiangxi Education Office (GJJ190598, GJJ190613), the Open Project Program of “Polymer Engineering Research Center”, and Jiangxi Science & Technology Normal University (KFGJ19019).Notes and references
- D. Wu, A. C. Sedgwick, T. Gunnlaugsson, E. U. Akkaya, J. Y. Yoon and T. D. James, Chem. Soc. Rev., 2017, 46, 7105–7123 RSC.
- G. Sivaraman, M. Iniya, T. Anand, N. G. Kotla, O. Sunnapu, S. Singaravadivel, A. Gulyani and D. Chellappa, Coord. Chem. Rev., 2018, 357, 50–104 CrossRef CAS.
- A. Gupta and N. Kumar, RSC Adv., 2016, 6, 106413–106434 RSC.
- J. Q. Sun, B. F. Ye, G. M. Xia and H. M. Wang, Sens. Actuators, B, 2017, 249, 386–394 CrossRef CAS.
- X. Q. Chen, T. Pradhan, F. Wang, J. S. Kim and J. Y. Yoon, Chem. Rev., 2012, 112, 1910–1956 CrossRef CAS PubMed.
- M. Saleem and K. H. Lee, RSC Adv., 2015, 5, 72150–72287 RSC.
- J. F. Li, C. X. Yin and F. J. Huo, Dyes Pigm., 2016, 131, 100–133 CrossRef CAS.
- G. T. Sfrazzetto, C. Satriano, G. A. Tomaselli and E. Rizzarelli, Coord. Chem. Rev., 2016, 311, 125–167 CrossRef.
- R. Singh, A. Gogoi and G. Das, RSC Adv., 2016, 6, 112246–112252 RSC.
- S. B. Roy, J. Mondal, A. R. Khudabukhsh and K. K. Rajak, New J. Chem., 2016, 40, 9593–9608 RSC.
- C. Kar, S. Samanta, S. Mukherjee, B. K. Datta, A. Ramesh and G. Das, New J. Chem., 2014, 38, 2660–2669 RSC.
- P. S. Addy, S. B. Roy, S. M. Mandal and A. Basak, RSC Adv., 2014, 4, 23314–23318 RSC.
- K. Du, S. Z. Niu, L. Qiao, Y. D. Dou, Q. Zhu, X. Z. Chen and P. F. Zhang, RSC Adv., 2017, 7, 40615–40620 RSC.
- A. Mandal, A. Maity, S. Bag, P. Bhattacharya, A. K. Das and A. Basak, RSC Adv., 2017, 7, 7163–7169 RSC.
- R. B. Cole, Anal. Chem., 2011, 79, 5510–5520 Search PubMed.
- J. P. Jiang and Z. J. Guo, Coord. Chem. Rev., 2004, 248, 205–229 CrossRef.
- E. M. Nolan and S. J. Lippard, Acc. Chem. Res., 2009, 42, 193–203 CrossRef CAS PubMed.
- L. L. Zhang, J. Cao, K. Chen, Y. Liu, Y. S. Ge, J. Wu and D. Liu, New J. Chem., 2019, 43, 3071–3077 RSC.
- J. Cao, C. C. Zhao, X. Z. Wang, Y. F. Zhang and W. H. Zhu, Chem. Commun., 2012, 48, 9897–9899 RSC.
- Y. Mikata, S. Takeuchi, H. Konno, S. Iwatsuki, S. Akaji, I. Hamagami, M. Aoyama, K. Yasuda, S. Tamotsu and S. C. Burdette, Dalton Trans., 2014, 43, 10013–10022 RSC.
- L. Y. Zhao, Q. L. Mi, G. K. Wang, J. H. Chen, J. F. Zhang, Q. H. Zhao and Y. Zhou, Tetrahedron Lett., 2013, 54, 3353–3358 CrossRef CAS.
- L. Fan, J. C. Qin, T. R. Li, B. D. Wang and Z. Y. Yang, Sens. Actuators, B, 2014, 203, 550–556 CrossRef CAS.
- Z. Kowser, H. Tomiyasu, X. Jiang, U. Rayhan, C. Redshaw and T. Yamato, New J. Chem., 2015, 39, 4055–4062 RSC.
- B. Zhang, K. S. Cao, Z. A. Xu, Z. Q. Yang, H. W. Chen, W. Huang, G. Yin and X. Z. You, Eur. J. Inorg. Chem., 2012, 2012, 3844–3851 CrossRef CAS.
- K. Komatsu, Y. Urano, H. Kojima and T. Nagano, J. Am. Chem. Soc., 2008, 130, 14533–14543 CrossRef PubMed.
- X. D. Zhang, H. Li, G. Liu and S. Z. Pu, J. Photochem. Photobiol., A, 2016, 330, 22–29 CrossRef CAS.
- S. J. Xia, G. Liu and S. Z. Pu, J. Mater. Chem. C, 2015, 3, 4023–4029 RSC.
- Z. Wang, S. Q. Cui, S. Y. Qiu and S. Z. Pu, J. Photochem. Photobiol., A, 2019, 376, 185–195 CrossRef CAS.
- Q. Luo, H. Cheng and H. Tian, Polym. Chem., 2011, 2, 2435–2443 RSC.
- M. Morimoto, R. Kashihara, K. Mutoh, Y. Kobayashi, J. Abe, H. Sotome, S. Ito, H. Miyasakac and M. Irie, Crystengcomm, 2016, 18, 7241–7248 RSC.
- Y. Takagi, T. Kunishi, T. Katayama, Y. Ishibashi, H. Miyasaka, M. Morimoto and M. Irie, Photochem. Photobiol. Sci., 2012, 11, 1661–1665 RSC.
- S. Z. Pu, Q. Sun, C. B. Fan, R. J. Wang and G. Liu, J. Mater. Chem. C, 2016, 4, 3075–3093 RSC.
- Z. C. Xu, J. Y. Yoon and D. R. Spring, Chem. Commun., 2010, 46, 2563–2565 RSC.
- Y. Xu, J. Meng, L. Meng, Y. Dong, Y. Cheng and C. Zhu, Chemistry, 2010, 16, 12898–12903 CrossRef CAS PubMed.
- X. J. Liu, N. Zhang, J. Zhou, T. J. Chang, C. L. Fang and D. H. Shangguan, Analyst, 2013, 138, 901–906 RSC.
- Y. Mikata, A. Yamashita, K. Kawata, H. Konno, S. Itami, K. Yasuda and S. Tamotsu, Dalton Trans., 2011, 40, 4976–4981 RSC.
- A. Dhara, N. Guchhait, I. Mukherjee, A. Mukherjee and S. C. Bhattacharya, RSC Adv., 2016, 6, 105930–105939 RSC.
- S. Z. Pu, Z. P. Tong, G. Liu and R. J. Wang, J. Mater. Chem. C, 2013, 31, 4726–4739 RSC.
- F. Shi, S. Q. Cui, H. L. Liu and S. Z. Pu, Dyes Pigm., 2020, 173, 107914 CrossRef CAS.
- A. Jana, B. Das, S. K. Mandal, S. Mabhai, A. R. Khuda-Bukhsh and S. Dey, New J. Chem., 2016, 40, 5976–5984 RSC.
- Z. X. Li, L. Y. Liao, W. Sun, C. H. Xu, C. Zhang, C. J. Fang and C. H. Yan, J. Phys. Chem. C, 2008, 112, 5190–5196 CrossRef CAS.
- S. Kawai, T. Nakashima, K. Atsumi, T. Sakai, M. Harigai, Y. Imamoto, H. Kamikubo, M. Kataoka and T. Kawai, Chem. Mater., 2007, 19, 3479–3483 CrossRef CAS.
- M. Morimoto and M. Irie, Chemistry, 2006, 12, 4275–4282 CrossRef CAS PubMed.
- T. Nakashima, K. Miyamura, T. Sakai and T. Kawai, Chemistry, 2009, 15, 1977–1984 CrossRef CAS PubMed.
- S. Wang, W. Shen, Y. Feng and H. Tian, Chem. Commun., 2006, 14, 1497–1499 RSC.
- S. Irie, M. S. Kim, T. Kawai and M. Irie, Bull. Chem. Soc. Jpn., 2004, 77, 1037–1040 CrossRef CAS.
- S. Z. Pu, G. Liu, L. Shen and J. K. Xu, Org. Lett., 2007, 9, 2139–2142 CrossRef CAS PubMed.
- T. Kawai, M. S. Kim, T. Sasaki and M. Irie, Opt. Mater., 2003, 21, 275–278 CrossRef CAS.
- Z. Wang, S. Q. Cui, S. Y. Qiu and S. Z. Pu, RSC Adv., 2018, 8, 29295–29300 RSC.
- R. J. Wang, L. Diao, Q. W. Ren, G. Liu and S. Z. Pu, ACS Omega, 2019, 4, 309–319 CrossRef CAS.
- J. H. Cheng, X. G. Zhou and H. F. Xiang, Analyst, 2015, 140, 7082–7115 RSC.
- J. S. Wu, W. M. Liu and X. Q. Zhuang, Org. Lett., 2007, 9, 33–36 CrossRef CAS PubMed.
- Y. W. Wang, M. X. Yu, Y. H. Yu, Z. P. Bai, Z. Shen, F. Y. Li and X. Z. You, Tetrahedron Lett., 2009, 50, 6169–6172 CrossRef CAS.
- S. Y. Tao, Y. Wei, C. Wang, Z. Q. Wang, P. Fan, D. Shi, B. J. Ding and J. S. Qiu, RSC Adv., 2014, 4, 46955–46961 RSC.
- S. H. Xiao, Z. Liu, J. Y. Zhao, M. S. Pei, G. Y. Zhang and W. He, RSC Adv., 2016, 6, 27119–27125 RSC.
- Z. Wang, S. Q. Cui, S. Y. Qiu and S. Z. Pu, J. Photochem. Photobiol., A, 2018, 367, 212–218 CrossRef CAS.
- S. Wang, L. L. Ma, G. Liu and S. Z. Pu, Dyes Pigm., 2019, 164, 257–266 CrossRef CAS.
Footnote |
| † Electronic supplementary information (ESI) available. See DOI: 10.1039/c9ra10907b |
| This journal is © The Royal Society of Chemistry 2020 |


