 Open Access Article
Roles of hydrothermal-alkaline treatment in tannery sludge reduction: rheological properties and sludge reduction mechanism analysis†
Shimin Zhai,
Yonghui Xiong,
Min Li *,
Dong Wang and
Shaohai Fu*
Jiangsu Engineering Research Centre For Digital Textile Inkjet Printing, Key Laboratory of Eco-Textile, Jiangnan University, Ministry of Education, Wuxi, Jiangsu 214122, China. E-mail: minmin0421@163.com; shaohaifu@hotmail.com
First published on 7th April 2020
Abstract
The hydrothermal-alkaline treatment (HAT) is an efficient sludge reduction method. However, the roles of HAT in tannery sludge reduction are not very clear. In this study, the sludge reduction mechanism of HAT was explored. The results showed that HAT had good performance for the organic dissolution of tannery sludge. The reduction of the sludge mass was calculated by the mass of the separated wet sludge solid (4000 rpm, 10 min) before and after HAT. The HAT parameters for sludge reduction (SR) were optimized by the Box–Behnken, and the sludge reduction was 62.5% under optimal conditions (198 °C, 87 min and 8.7 g L−1 NaOH). The soluble organics, especially a polysaccharide (PS) and ammonia nitrogen (NH3–N), showed a close correspondence with the SR ratio. The rheological properties of the sludge indicated that the reticular structures in the sludge were destroyed after HAT. The tannery sludge solid became more pyknotic than raw sludge after the hydrothermal-alkaline treatment. The tannery sludge reduction can be attributed to the damage of reticular structures, organic dissolution and release of bound water.
1. Introduction
The processes of leather-making and wastewater bio-treatment produce large amounts of tannery sludge. The tannery sludge is rich in organics (such as fatty acids, proteins and polysaccharides), heavy metal salts (such as those of Cr(VI) and Cr(III)) and some pathogenic germs. The tannery sludge is perishable and unstable in the natural environment. Without proper treatment, the tannery sludge can cause serious pollution problems. Nevertheless, the water content ratio of the tannery sludge is usually over 90%. It is difficult to transport the tannery sludge to a centralized location. The large sludge volume increases the treatment costs. Hence, sludge reduction (SR) is necessary for the treatment of tannery sludge. Many studies have been performed to investigate the volume reduction of sewage sludge. It has been reported that the full-scale sludge process reduction activated sludge (SPRAS) system can achieve a low observed sludge yield of 0.074 g SS per g COD for sewage sludge.1 The composite ferrate solution (CFS) can be used to disintegrate waste activated sludge and the sludge reduction is 55.4%.2 According to reports, the sludge reduction (SR) methods can be categorized into physical (e.g., mechanical shearing, ultrasonication and microwave), chemical (e.g., alkali treatment, ozonation and hydrogen peroxide treatment) and biological methods (e.g., bio-enzyme treatment).3,4 However, not all the SR methods are the best fit for tannery sludge because the tannery sludge contains a large amount of organics (e.g., scrap leather, meat scraps, etc.) and typical heavy metal salts (Cr(VI) and Cr(III) salts), which are higher than those in sewage sludge. Using the single treatment method, it is hard to reach the targets of shrinkage and safety. The combined pre-treatment methods may be more reasonable for tannery sludge.Hydrothermal-alkaline treatment (HAT) is an efficient combined method for tannery sludge reduction, and the rheological properties of the sludge are the key parameters to optimize the treatment conditions. From a rheological viewpoint, the tannery sludge is a non-Newtonian fluid with a high solid content, and it will become a Newtonian-like fluid when it is diluted. Furthermore, the yield stress can reflect the intensity of the reticular structures, determining the dewatering properties of the sludge. However, few studies about the sludge thixotropy and volume reduction mechanism are available. In this study, the effects of mechanical shearing and hydrothermal-alkaline treatment (HAT) on tannery sludge were explored by unconstrained principal component analysis (PCA), and the HAT parameters for sludge reduction (SR) were optimized by the Box–Behnken design. The rheological properties and principal components of the tannery sludge before and after hydrothermal-alkaline treatment were analysed. Based on the variation in the sludge properties, the possible reduction mechanism of HAT was proposed.
2. Materials and method
2.1 Samples and chemicals
The raw sludge was produced from wastewater bio-treatment and leather-making process in Kanghuida Co., Ltd. (Hebei, China). The tannery sludge was stored at 4 °C before use to ensure that the properties were stable. The properties of separated sludge supernatant (4000 rpm, 10 min) and dried solid (105 °C, 24 h) are shown in Table S1.† Folin-phenol reagent (2 mol L−1), sodium hydroxide (NaOH, ≥99.7%), potassium carbonate (Na2CO3, ≥99.7%), sodium tartrate (C4H4Na2O6, ≥99.7%), and bovine serum albumin (BSA, ≥99.7%) were all purchased from Macklin Biochemical Co., Ltd. (Shanghai, China). Copper sulfate (CuSO4, ≥99.7%), anthracenone (C14H10O, ≥99.7%) and sulfuric acid (H2SO4, ≥98%) were all purchased from National Drug Group Chemical Reagent Co., Ltd. (Shanghai, China), and used without further purification.2.2 Tannery sludge treatment
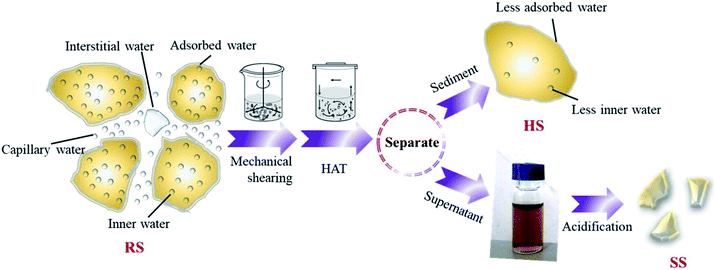
The raw sludge was subjected to mechanical shearing by an attrition milling machine (D122, NETZSCH, and Germany). The effects of treatment time (30–180 min) and shearing rate (600–1600 rpm) on organic dissolution were investigated. In addition, the raw sludge (100 mL) was treated in a hydrothermal reactor (PPL-200, Zhengzhou Taiyuan Co., China) with a heating rate of 2°C min−1 with different NaOH dosages (1–13 g L−1), treatment times (30–180 min) and temperatures (100–225 °C). Then, the soluble polysaccharide (PS), protein (PR), ammonia nitrogen (NH3–N) and total phosphorus (TP) in the sludge supernatant, including both inorganic and organic fractions, were tested. The above-mentioned treatment processes are shown in Fig. 1.2.3 Response surface optimization
The systematic optimization for sludge reduction (SR) was designed using Box–Behnken with Design-Expert 10.0.7. Software. According to the Box–Behnken Design, 17 of experimental trials were performed and a quadratic second-order model was used to analyse the experimental results. The data-fitting with the model was analysed by ANOVA and the predicted equation was obtained. Finally, five experimental trials (No. 1–No. 5) were conducted to verify the predicted equation.2.4 Rheological analysis
The shearing stress (τ) of RS and as-prepared samples (No. 1–No. 5) in Section 2.3 was tested at a shearing rate (γ) range of 5–140 s−1. The modified Herschel–Bulkley model was used to fit the rheological properties as follows:| τ = τc + kγn + μ∞γ | (1) |
In eqn (1), the factors τc (Pa), k (Pa sn), n and μ∞ (Pa s) are the yield stress, consistency, flow index and infinite viscosity of tannery sludge, respectively.
2.5 Elemental analysis for sludge solids
The sludge after hydrothermal-alkaline treatment was separated by a centrifuge at 4000 rpm for 10 min, and the hydrothermal-alkali-treated sludge was denoted as HSS. Then, the pH of the supernatant was adjusted to 4 (0.1 mol L−1 H2SO4) and centrifuged again. The sludge sediment after acidification was denoted as SSA. The morphology and elemental composition of raw sludge, HSS and SSA were investigated.2.6 Characterization and calculation methods
Scanning electron microscopy (SEM) images were recorded using a scanning electron microscope (SU1510, Business Guide-Sha, Japan) with an acceleration voltage of 0.3–30 kV. The concentrations of polysaccharide (PS), protein (PR), ammonia nitrogen (NH3–N), total phosphorus (TP) and chemical oxygen demand (COD) in the sludge supernatant were measured by the anthrone–sulfuric acid colorimetry method, folin–phenol method, salicylic acid method, persulphate colorimetry method and dichromate method, respectively. Rheological measurements were obtained with a rotational rheometer (physical MCR301, Anton pa co. Ltd, Austria) with a shearing rate (γ) range of 5–140 s−1. X-ray diffraction (XRD) was performed by an X-ray diffractometer (D8, Brook AXS Co., Ltd., Germany) using Cu-Kα radiation with 2θ scan range of 10–85° at a rate of 0.1° min−1. Fourier transform infrared (FTIR) spectra were characterized by a Nicolet iS50 FTIR apparatus. The elemental compositions of sludge samples were analyzed by an elemental analyser (Vario EL III, Hanau, Germany).The sludge reduction (SR) was calculated as follows:
 | (2) |
In eqn (2), m0 (g) and mt (g) are the masses of the wet sludge solid (centrifuged at 4000 rpm for 10 min) before and after HAT, respectively.
The normalized deviation (ND) and normalized standard deviations (NSD) were calculated as follows:5
 | (3) |
 | (4) |
In eqn (3) and (4), SR(exp) and SR(pre) are the experimental and predicted sludge reduction (%), respectively, and n is the number of the observations made.
3. Results and discussion
3.1 Unconstrained principal component analysis (PCA)
The results of PCA for the soluble organics after mechanical shearing and hydrothermal-alkaline treatment are shown in Fig. 2. In Fig. 2A, 99.8% (84.3% + 15.5%) of the data can be described by principal component axes (PC1 and PC2). After mechanical shearing with different shearing rates and times, according to the data of the soluble organic composition, three groups were formed (RS group, shearing rate group and treatment time group). The similarity distance (Bray–Curtis distance) of the shearing rate group to the RS group was longer than that of the treatment time group to the RS group along the coordinate axis (PC1, 84.3%). The results indicated that the mechanical shearing influenced the soluble organic content, and the order of the influencing factors was as follows: shearing rate > treatment time. In addition, the mechanical shearing can break sludge flocs and promote organic dissolution (Fig. S1 and S2†). Therefore, after mechanical shearing (1600 rpm, 30 min), the concentrations of soluble PR and PS were 137.2 and 18.9 mg L−1, respectively (Fig. S2†). Similarly, the points of soluble organics after HAT differed from those of raw sludge, as shown in Fig. 2B, indicating that the temperature, treatment time and NaOH dosage were the key influencing factors of HAT. The similarity distances to the RS group manifested that high temperatures (100–225 °C) had a greater impact on organic dissolution than the treatment time and NaOH dosage.1,6,7 Therefore, the concentrations of soluble PR and PS were 2736.6 and 204.4 mg L−1 after HAT (225 °C, NaOH 9 g L−1 and 30 min), respectively (Fig. S3†). The results indicated that the organic dissolution efficiencies for HAT were higher than those for mechanical shearing. In this case, the optimization for the key influencing factors of HAT is more meaningful.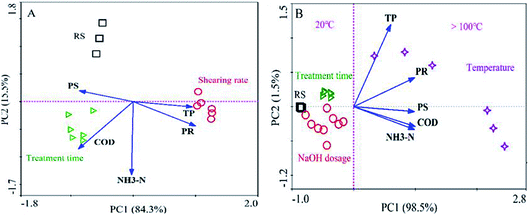 | ||
| Fig. 2 Unconstrained principal component analysis (PCA) for soluble organic composition after mechanical shearing (A) and hydrothermal-alkaline treatment (B). | ||
3.2 Response surface analysis
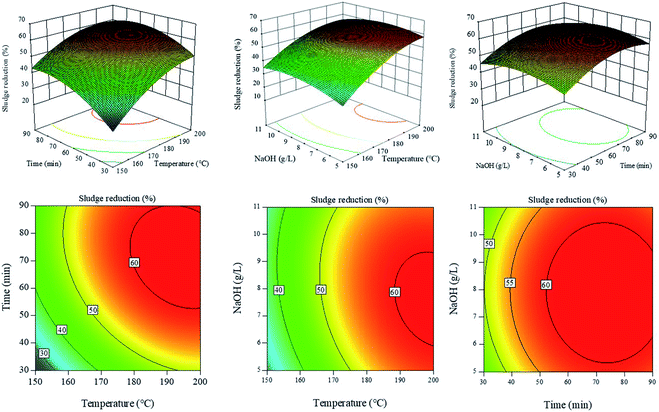
Here, 17 experimental trials were conducted to optimize the HAT parameters, and the results are displayed in Table 1. The 3D response surface graphs and 2D contour plots of sludge reduction under different conditions are shown in Fig. 3. The temperature (A), treatment time (B) and NaOH concentration (C) showed the complex interaction effects in the 3D response surfaces. The SR ratio increased rapidly with the increase in temperature (A), treatment time (B) and NaOH concentration (C) at low levels. The results may be attributed to the damage of zoogloea granules under alkaline conditions, in which the organics dissolve into the aqueous phase. In this process, the high temperature improved the reaction efficiency and promoted the organic dissolution. However, the SR ratios showed a mild declining trend at high temperatures (A), treatment times (B) and NaOH concentrations (C). Because NaOH can make the soluble proteins denature at a high temperature, the soluble proteins were transformed into insoluble solids again. Moreover, in Fig. 3, it can be seen that HAT has an optimum treatment condition and the SR ratio can reach above 60%.| No. | A: temp. (°C) | B: time (min) | C: NaOH (g L−1) | PSa (mg L−1) | PRa (mg L−1) | NH3–Na (mg L−1) | TPa (mg L−1) | CODa (mg L−1) | SR (%) |
|---|---|---|---|---|---|---|---|---|---|
| a The concentrations in sludge supernatant. | |||||||||
| 1 | 175.0 | 30.0 | 5.0 | 64.1 | 1003.7 | 50.2 | 2.8 | 1901.0 | 37.7 |
| 2 | 175.0 | 60.0 | 8.0 | 120.3 | 1764.4 | 76.6 | 6.9 | 3862.0 | 57.5 |
| 3 | 150.0 | 60.0 | 5.0 | 90.9 | 1558.9 | 67.7 | 3.5 | 3308.0 | 33.1 |
| 4 | 200.0 | 30.0 | 8.0 | 117.3 | 1676.3 | 115.8 | 3.5 | 3769.0 | 56.2 |
| 5 | 175.0 | 60.0 | 8.0 | 120.3 | 1764.4 | 76.6 | 6.9 | 3862.0 | 57.5 |
| 6 | 175.0 | 60.0 | 8.0 | 120.3 | 1764.4 | 76.6 | 6.9 | 3862.0 | 57.5 |
| 7 | 175.0 | 60.0 | 8.0 | 120.3 | 1764.4 | 76.6 | 6.9 | 3862.0 | 57.5 |
| 8 | 175.0 | 30.0 | 11.0 | 69.0 | 114.3 | 62.1 | 3.4 | 2296.0 | 37.3 |
| 9 | 200.0 | 60.0 | 11.0 | 73.7 | 1402.0 | 94.8 | 3.7 | 4169.0 | 56.9 |
| 10 | 200.0 | 90.0 | 8.0 | 133.8 | 2039.0 | 144.2 | 5.3 | 3708.0 | 60.6 |
| 11 | 150.0 | 90.0 | 8.0 | 51.4 | 1089.0 | 48.9 | 3.9 | 1986.0 | 38.8 |
| 12 | 150.0 | 60.0 | 11.0 | 63.9 | 1544.4 | 64.5 | 3.9 | 2944.0 | 41.3 |
| 13 | 175.0 | 60.0 | 8.0 | 120.3 | 1764.4 | 76.6 | 6.9 | 3862.0 | 57.5 |
| 14 | 175.0 | 90.0 | 5.0 | 88.1 | 1366.6 | 90.9 | 3.9 | 3615.0 | 56.7 |
| 15 | 175.0 | 90.0 | 11.0 | 117.4 | 1650.9 | 114.4 | 4.9 | 3154.0 | 55.3 |
| 16 | 200.0 | 60.0 | 5.0 | 68.8 | 1149.2 | 72.9 | 5 | 2296.0 | 56.8 |
| 17 | 150.0 | 30.0 | 8.0 | 62.8 | 1383.8 | 39.3 | 5.2 | 1648.0 | 24.2 |
The ANOVA analysis of the response surface for SR is recorded in Table 2. The value of ‘Prob > F’ is the key factor to evaluate the accuracy of the model terms. ‘Prob > F’ values less than 0.05 indicate that the model or model terms are significant at 95% confidence level. In Table 2, the F-value of the model is 19.35 and the ‘Prob > F’ value is 0.0004. Hence, the model is significant and there is only 0.04% chance that the F-value is larger than 19.35 due to noise for the model. According to the ‘Prob > F’ values, A, B, A2, B2 and C2 were the significant terms in the model (less than 0.05), whereas the other factors (C, AB, AC and BC) were not so significant in this model (large than 0.05). The order of the significant terms in the model was as follows: A > B > B2 > A2 > C2; this was consistent with the results shown in Fig. 2B. In addition, the SR model was described by the quadratic polynomial equation given below:
| SR ratio (%) = −471.7238 + 4.3203 × A + 1.7031 × B + 12.8221 × C − 3.4009 × 10⁻³ × AB − 0.0268 × AC − 2.7017 × 10⁻³ × BC − 9.8200 × 10⁻³ × A2 − 7.1105 × 10⁻³ × B2 − 0.4810 × C2 | (5) |
| Sources | Sum of squares | DF | Mean square | F value | P value | Significance |
|---|---|---|---|---|---|---|
| a Values of ‘P value’ less than 0.0500 indicate that the model terms are significant. | ||||||
| A | 1081.2000 | 1.0000 | 1081.2000 | 95.2400 | <0.0001 | a |
| B | 391.2200 | 1.0000 | 391.2200 | 34.4600 | 0.0006 | a |
| C | 5.4700 | 1.0000 | 5.4700 | 0.4800 | 0.5098 | |
| AB | 26.0200 | 1.0000 | 26.0200 | 2.2900 | 0.1738 | |
| AC | 16.1400 | 1.0000 | 16.1400 | 1.4200 | 0.2719 | |
| BC | 0.2400 | 1.0000 | 0.2400 | 0.0210 | 0.8893 | |
| A2 | 158.6000 | 1.0000 | 158.6000 | 13.9700 | 0.0073 | a |
| B2 | 172.4300 | 1.0000 | 172.4300 | 15.1900 | 0.0059 | a |
| C2 | 78.9200 | 1.0000 | 78.9200 | 6.9500 | 0.0336 | a |
| Model | 1976.7000 | 9.0000 | 219.6300 | 19.3500 | 0.0004 | a |
| Lack of fit | 19.4600 | 3.0000 | 26.4900 | |||
Based on the equation, SR was found to be 61.4% under optimal treatment conditions (198.0 °C, 87 min and 8.7 g L−1 NaOH). To verify the reliability of the SR model, 5 experimental trials were conducted and the results are shown in Table 3. It can be seen that the experimental SR ratios approach the predicted SR ratios. The values of ND and NSD were 8.82% and 9.60% respectively, which were below 10%. The results also indicated that the predicted SR ratios were in good agreement with the experimental SR ratios, and the model was reliable.
| No. | Temperature (°C) | Time (min) | NaOH (g L−1) | Experimental SR (%) | Predicted SR (%) | ND (%) | NSD (%) |
|---|---|---|---|---|---|---|---|
| No. 1 | 184.3 | 76 | 9.2 | 57.0 | 61.3 | ||
| No. 2 | 197.9 | 89 | 9.3 | 54.1 | 60.1 | ||
| No. 3 | 198.0 | 87 | 8.7 | 62.5 | 61.4 | 8.82 | 9.60 |
| No. 4 | 179.8 | 66 | 8.1 | 54.6 | 60.5 | ||
| No. 5 | 186.1 | 58 | 7.8 | 69.5 | 60.9 |
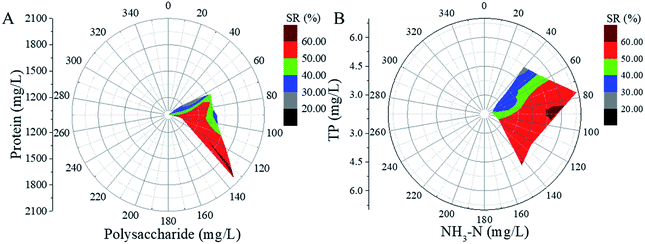
The relationships between soluble organics (PR, PS, TP and NH3–N) and SR are shown in Fig. 4. In Fig. 4A, the length of the radius represents the polysaccharide concentration, the angle of the circle represents the protein concentration, and different colours mean different values of the SR ratio. It can be seen that the SR ratio increases to 60% when the concentrations of the soluble protein and polysaccharide are above 1500 and 130 mg L−1, respectively. Fig. 4B presents the variation in the SR ratio with the change in the NH3–N and TP concentrations, which is similar to the results shown in Fig. 4A. The SR ratios achieved the same value (60%) when the concentrations of soluble TP and NH3–N were above 4.5 and 85 mg L−1, respectively. The results indicated that the increase in soluble organics could lead to the increase in the SR ratio. Because the SR ratio increased significantly along the polysaccharide and NH3–N axes. The sludge reduction can be ascribed to the organic dissolution, especially the dissolution of PS and NH3–N.
3.3 Rheological analysis of sludge
The rheological properties of the as-prepared sludge samples (raw sludge and No. 1–No. 5) are shown in Fig. 5. It could be seen that the shearing stress increased greatly on increasing the shearing rate. The raw sludge presented a nonlinear curve (Fig. 5A), indicating that the raw sludge was a non-Newtonian fluid. However, the curves of hydrothermal-alkali-treated sludge (No. 1–No. 5 samples) show excellent linear properties (Fig. 5B–F), which are the typical characteristics of Newtonian-like fluids. From a rheological viewpoint, the sludge is usually a non-Newtonian fluid, and it will become a Newtonian-like fluid when it is diluted or the suspended solid concentration is decreased.8,9 HAT changed the rheological properties of the sludge in this study, which could be ascribed to organic dissolution. Besides, the fitting parameters for the modified Herschel–Bulkley equation are displayed in Table 4. All the correlation coefficients (R2) are larger than 0.90, indicating that the modified Herschel–Bulkley equation can describe the rheological properties of the sludge. Yield stress is a key factor for a non-Newtonian fluid, and it can reflect the strength of the reticular structures in sludge.10 The yield stress (τy) of the raw sludge was 0.0214 Pa, whereas those of the treated sludge (No. 1–No. 5) samples were 0.0033, 0.0041, 0.0063, 0.0129 and 0.0126 Pa, respectively. These results indicated that HAT destroyed the reticular structures in the tannery sludge. Since the reticular structures retained a large amount of bound water and soluble organics, the damage of the reticular structures may be another reason for sludge reduction.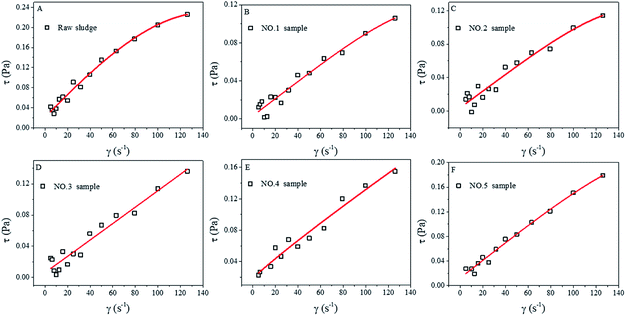 | ||
| Fig. 5 Rheological properties of raw sludge (A), No. 1 sample (B), No. 2 sample (C), No. 3 sample (D), No. 4 sample (E) and No. 5 sample (F), and the fitting for the Herschel–Bulkley equation. | ||
| k (Pa sn) | n | μ∞ (Pa s) | τy (Pa) | R2 | |
|---|---|---|---|---|---|
| Raw sludge | −1.1486 × 10⁻⁷ | 2.7859 | 0.0023 | 0.0214 | 0.9830 |
| No. 1 sample | −2.3005 × 10⁻¹¹ | 4.1352 | 9.0408 × 10⁻⁴ | 0.0033 | 0.9485 |
| No. 2 sample | −5.2827 × 10⁻¹¹ | 4.0286 | 9.9579 × 10⁻⁴ | 0.0041 | 0.9316 |
| No. 3 sample | −0.0164 | 0.9997 | 0.0174 | 0.0063 | 0.9344 |
| No. 4 sample | −0.02877 | 0.9997 | 0.02938 | 0.0129 | 0.9424 |
| No. 5 sample | −2.1408 × 10⁻¹⁰ | 3.7186 | 0.0014 | 0.0126 | 0.9833 |
3.4 Characterization for the sludge solid
To characterize the morphology of the sludge solid at different stages, the SEM images of raw sludge (RS), hydrothermal-alkali-treated sludge (HS) and sludge sediment after acidification (SS) are displayed in Fig. 6. As shown in Fig. 6A, the structure of RS is loose and the sludge particles are packed to form pores. HS consisted of large particles, indicating that the interaction force between the sludge particles was strengthened (Fig. 6B). Besides, SS showed a pyknotic surface and the pores between the sludge particles disappeared (Fig. 6C). The results manifest that HAT can make tannery sludge solids pyknotic, in which the sludge may have a low moisture content.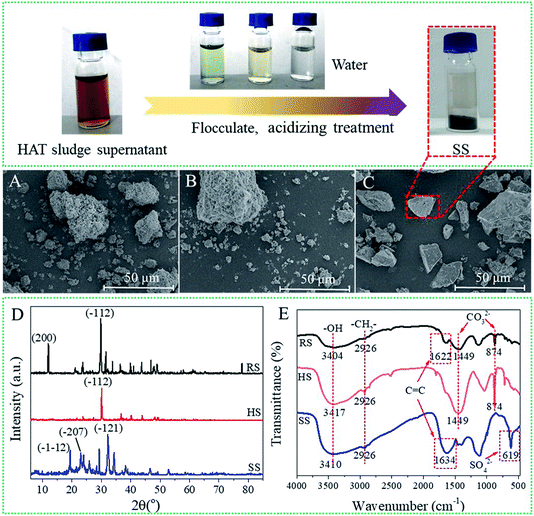 | ||
| Fig. 6 SEM images of RS (A), HS (B) and SS (C); FTIR spectra of RS, HS and SS (D); XRD patterns of RS, HS and SS in the range of 5–85° (E). | ||
The X-ray diffraction results of RS, HS and SS in the range of 5–85° are displayed in Fig. 6D. Since the tannery sludge consisted of multiple compounds, the samples (RS, HS and SS) showed complex multimodal curves. In the XRD pattern of RS, two typical peaks are observed at 11.9° (200) and 29.7° (−112), which represent calcium phosphate (Ca (H2PO2)2) and calcium carbonate (CaCO3), respectively. Besides, for HS, only the peak at 29.7° (−112) appeared, indicating the existence of calcium carbonate (CaCO3). However, for SS, the typical peaks at 19.3° (−112) and 22.9° (−207) correspond to glycerol (C36H74O9), and the peak at 32.3° (−121) can be attributed to aminocaproic acid (C6H13NO2). The results showed that the content of organics in SS increased greatly after HAT.11,12 Moreover, the elemental compositions of the sludge samples were analysed by an elemental analyzer (Table S2†). Compared with the results for RS, the organic elemental ratios of SS increased significantly. The results indicated that the organics were separated from the raw sludge by HAT. The rich organics in SS may be more suitable for resource utilization in practice.
The FTIR spectra of the sludge samples (RS, HS and SS) are shown in Fig. 6E. RS, HS and SS exhibit significant peaks at 3404, 3417 and 3410 cm−1, respectively, which can be assigned to the –OH stretching vibration. Moreover, the peak at 2926 cm−1 indicates the existence of –CH2– (νasCH). The results indicated that the sludge samples contained some organics. For RS and SS, the peaks at 1622 and 1634 cm−1 manifested the existence of C![[double bond, length as m-dash]](https://www.rsc.org/images/entities/char_e001.gif) C (νC
C (νC![[double bond, length as m-dash]](https://www.rsc.org/images/entities/char_e001.gif) C), whereas the peak for (C
C), whereas the peak for (C![[double bond, length as m-dash]](https://www.rsc.org/images/entities/char_e001.gif) C) disappeared in the spectrum of HS.13 These results indicated that parts of organics were separated from the raw sludge by HAT. Moreover, the peaks of CO32− occurred at 1449 and 874 cm−1 for RS and HS, respectively. However, for SS, the CO32− peaks disappeared and an SO42− peak appeared at 619 cm−1. The result can attributed to the addition of dilute sulphuric acid (H2SO4) during acidization.
C) disappeared in the spectrum of HS.13 These results indicated that parts of organics were separated from the raw sludge by HAT. Moreover, the peaks of CO32− occurred at 1449 and 874 cm−1 for RS and HS, respectively. However, for SS, the CO32− peaks disappeared and an SO42− peak appeared at 619 cm−1. The result can attributed to the addition of dilute sulphuric acid (H2SO4) during acidization.
4. Conclusion
The parameters of hydrothermal-alkaline treatment (HAT) for tannery sludge reduction (SR) were optimized by the Box–Behnken. The verification experiments indicated that the SR model was reliable and the sludge reduction reached 62.5% under optimal conditions (198.0 °C, 87 min and NaOH 8.7 g L−1). Moreover, the properties of the sludge before and after treatment were investigated. The HAT process could destroy the reticular structures in the sludge and the sludge solid became pyknotic after HAT. HAT promoted organic dissolution, and the separated organics (SS) were more suitable for resource utilization. Hence, the sludge reduction mechanism of HAT was proposed as follows: first, the alkali could react with the cytomembrane efficiently at a high temperature and destroy the reticular structures in the sludge. Then, the organics, especially PS and NH3–N, in the sludge dissolved after HAT, and the bound water was released into the solution. Finally, the sludge solid became pyknotic and could not re-adsorb water easily. In this case, HAT showed good performance for tannery sludge reduction.Conflicts of interest
There are no conflicts to declare.Acknowledgements
This research was supported by National Key R&D Program of China [2018YFC1902100]; Postgraduate Research & Practice Innovation Program of Jiangsu Province [KYCX18_1826]; Basic Research Program of Jiangnan University [JUSRP21933 and JUSRP51907A]; National Nature Science Foundation of China [No. 201808086]; China Postdoctoral Science Foundation Funded Project [2018M630520].Notes and references
- L. Jiang, Z. Zhou, C. Cheng, J. Li, C. Huang and T. Niu, Sludge reduction by a micro-aerobic hydrolysis process: a full-scale application and sludge reduction mechanisms, Bioresour. Technol., 2018, 268, 684–691 CrossRef CAS PubMed.
- Y. Zhang, R. Hu, J. Tian and T. Li, Disintegration of waste activated sludge with composite ferrate solution: Sludge reduction and settleability, Bioresour. Technol., 2018, 267, 126–132 CrossRef CAS PubMed.
- B. J. Rajesh, S. V. Godvin, D. M. Gayathri, K. S. Adish, G. Kumar, D. D. Nguyen and S. G. Dattatraya, Cost effective sludge reduction using synergetic effect of dark Fenton and disperser treatment, J. Cleaner Prod., 2019, 207, 261–270 CrossRef.
- O. Thiène, E. Dieudé-Fauvel and J. C. Baudez, Impact of mechanical history on sludge rheological properties: role of the organic content, Water Res., 2019, 157, 175–180 CrossRef PubMed.
- Y. Bulut and H. Aydin, A kinetics and thermodynamics study of methylene blue adsorption on wheat shells, Desalination, 2006, 194, 259–267 CrossRef CAS.
- Y. Zheng, C. Cheng, Z. Zhou, H. Pang, L. Chen and L. Jiang, Insight into the roles of packing carriers and ultrasonication in anaerobic side-stream reactor coupled membrane bioreactors: Sludge reduction performance and mechanism, Water Res., 2019, 155, 310–319 CrossRef CAS PubMed.
- W. Zhang, B. Xiao, Y. Li, Y. Liu and X. Guo, Effects of return sludge alkaline treatment on sludge reduction in laboratory-scale anaerobic-anoxic-oxic process, J. Biotechnol., 2018, 285, 1–5 CrossRef CAS PubMed.
- G. Guibaud, P. Dollet, N. Tixier, C. Dagot and M. Baudu, Characterization of the evolution of activated sludge using rheological measurements, Process Biochem., 2004, 39, 1803–1810 CrossRef CAS.
- K. Hii, E. Farno, S. Baroutian, R. Parthasarathy and N. Eshtiaghi, Rheological characterization of thermal hydrolysed waste activated sludge, Water Res., 2019, 156, 445–455 CrossRef CAS PubMed.
- L. Spinosa and A. Ayol, Rheological characterization of sludge, Industrial and Municipal Sludge, 2019, vol. 2019, pp. 225–252 Search PubMed.
- M. Sultan, T. Miyazaki and S. Koyama, Optimization of adsorption isotherm types for desiccant air-conditioning applications, Renewable Energy, 2018, 142, 25–41 Search PubMed.
- D. J. Kim, K. S. Kim and S. K. Dong, Development Status of Microcell UO2, Pellet for Accident Tolerant Fuel, Nucl. Eng. Technol., 2018, 39, 1–9 Search PubMed.
- M. Sangeeta, K. V. Karthik and R. Ravishankar, Synthesis of ZnO, MgO and ZnO/MgO by Solution Combustion Method: Characterization and Photocatalytic Studies, Mater. Today, 2017, 4, 11791–11798 Search PubMed.
Footnote |
| † Electronic supplementary information (ESI) available. See DOI: 10.1039/c9ra11010k |
| This journal is © The Royal Society of Chemistry 2020 |

