 Open Access Article
Theoretical study of the mechanical properties of CrFeCoNiMox (0.1 ≤ x ≤ 0.3) alloys
Yu Liu a,
Kai Wangb,
Hui Xiaob,
Gang Chen*a,
Zhipeng Wangc,
Te Huc,
Touwen Fan*c and
Li Mad
aCollege of Materials Science and Engineering, Hunan University, Changsha, Hunan 410082, P. R. China. E-mail: chengang@hnu.edu.cn
bSchool of Mechatronics Engineering, Foshan University, Foshan, Guangdong 528001, P. R. China
cSchool of Material Science and Energy Engineering, Foshan University, Foshan, Guangdong 528001, P. R. China. E-mail: fantouwen_1980@163.com
dKey Laboratory of New Electric Functional Materials of Guangxi Colleges and Universities, Nanning Normal University, Nanning, Guangxi 530023, P. R. China
First published on 6th April 2020
Abstract
Based on exact muffin-tin orbitals (EMTO) and coherent potential approximation (CPA), we investigate the effects of Mo content on the mechanical properties of CrFeCoNiMox (0.1 ≤ x ≤ 0.3) high-entropy alloys (HEAs) with a face-centered-cubic (fcc) crystal structure; relevant physical parameters are calculated as a function of Mo content. The results indicate that the theoretical predictions of lattice constant, elastic constants, shear modulus, and Young's modulus are in good agreement with the available experimental data, which proves the validity of the applied approach. CrFeCoNiMo0.26 HEA has better ductility and plasticity with respect to other HEAs with different Mo contents because it has the minimum elastic moduli and Vickers hardness, and has the maximum Pugh's ratio and anisotropy factors, etc. CrFeCoNiMo0.2 HEA has better plasticity compared with CrFeCoNiMo0.1 and CrFeCoNiMo0.3 HEAs due to its minimum energy factor and maximum dislocation width. Screw dislocation is more likely to nucleate in CrFeCoNiMox (0.1 ≤ x ≤ 0.3) HEAs than edge dislocation. The present studies are helpful to explore the excellent mechanical properties of CrFeCoNiMox (0.1 ≤ x ≤ 0.3) HEAs during experiments.
1 Introduction
In 2004, high-entropy alloys (HEAs) were first introduced by Yeh et al. and Cantor et al.,1–3 and are different from traditional alloys with only one principal element, consisting of multiple components in equiatomic or nearly equiatomic ratios.4,5 The high-entropy effect makes the alloy form a simple cubic crystal structure rather than a complex structure with multi-phases and intermetallic compounds. For example, CoCrFeNiAl,6 CoCuMnNi,7 FeMnCoCr,8 VCrFeCoNi,9 AlCrMoNbZrN,10 and CrMnFeCoNi11 form a face-centered-cubic (fcc) solid solution structure, TiNbMoTaW,12 TaNbHfZrTi,13 NbMoTaW and VNbMoTaW,14 AlTiVCrMnFeCoNiCu,15 TiZrNbTaMo,16 and CuCrFeMoTi17 crystallize into a body-centered-cubic (bcc) phase. Therefore, these special mixtures have many excellent properties, such as high strength,7,9 high hardness,12 good ductility,13 corrosion and oxidation resistance,18,19 magnetism,20 and so on. Jo et al.9 conducted tensile and fracture toughness tests on the non-equiatomic V10Cr10Fe45Co20Ni15 HEA, and the results showed that the present alloy had good damage tolerance with a tensile strength of 1 GPa and elongation of 60%. Effects of Ti additions on mechanical properties of NbMoTaV and VNbMoTaW refractory HEAs were investigated by Han.12 In his study, an interesting phenomenon was found that the structure relaxation of as-cast HEAs resulted by annealing did not cause softening, the hardness value of TiNbMoTaV alloy changed from 498.7 ± 8.3 HV to 510.9 ± 5.7 HV after annealing at 1200 °C for 24 h, and that of TiVNbMoTaW alloy increased from 510.3 ± 6.0 HV to 522.3 ± 11.2 HV. Chou et al.18 studied the electrochemical properties of Co1.5CrFeNi1.5Ti0.5Mox (x = 0, 0.1, 0.5, 0.8) HEAs in acidic, marine, and basic environments at ambient temperature 25 °C, and clearly revealed that the corrosion resistance of the Mo-free alloy was superior to that of the Mo-containing alloys. Hsieh et al.21 prepared HEA (AlCrNbSiTiV)N nitride films on stainless steel and glass substrates using direct current reactive magnetron sputtering, and found that the films were homogeneous, very compact and adhere perfectly to the substrate. Meanwhile, more studies on HEAs were conducted by researchers.22–24In addition to the above experimental studies, theoretical analyses are also important methods to research the characteristics of HEAs. Sun et al.25 used the ab initio theory to investigate the phase selection rule of paramagnetic AlxCrMnFeCoNi (0 ≤ x ≤ 5) HEAs, and found that the crystal structure of alloys transformed from fcc phase to bcc phase in the range of 0.482–1.361, which was consistent with experimental measurements. Combined with the special quasi-random structure (SQS) method, Yang et al.26 comparatively analyzed the thermodynamic properties of (TaNbHfTiZr)C and (TaNbHfTiZr)N HEAs by first-principles calculations in conjunction with quasi-harmonic Debye–Grüneisen model. They found that the (TaNbHfTiZr)N alloy was more stable at high temperature because its entropy increased significantly with increasing temperature. With the deepening of theoretical research, Vitos (2007) proposed a feasible approach, the exact muffin-tin orbitals (EMTO), for the determination of energy changes due to anisotropic lattice distortions in ordered systems, in alloys with chemical disorder as well as those with both chemical and magnetic disorder,27 and then combined with the coherent potential approximation (CPA)28–30 to study the properties of multicomponent alloys. Based on the EMTO-CPA method, many works have been done on HEAs.31–36 Huang et al.31 studied the thermal expansion, elastic, and magnetic properties of FeCoNiCu-based HEAs by using the EMTO-CPA method, the calculated results were in line with the available experimental and theoretical data. Ge et al.32 applied this approach to research the elastic and thermal properties of single-phase ternary and quaternary AlTiCrNbMo refractory HEAs, and Li investigated the third-order elastic constants and related elastic anharmonic properties of three fcc paramagnetic HEAs by means of the EMTO-CPA method.33 Consequently, the EMTO-CPA method is a valid theoretical analysis method to study the properties of HEAs.
The CrFeCoNi-based HEAs are frequently studied during the theoretical analysis of the properties of HEAs, including VCrFeCoNi,9 AlCrMnFeCoNi,25 FeCoNiCuCr,31 CrMnFeCoNi,33 etc., and the calculated results are in line with the available experimental data. To the best of our knowledge, however, there is no theoretical study on the mechanical properties of CrFeCoNi-based HEAs with different Mo contents, but only a few experimental analyses.37–40 Hence, the aim of this paper is to study the effects of Mo content on mechanical properties of CrFeCoNiMox (0.1 ≤ x ≤ 0.3) HEAs with fcc crystal structure via first-principles calculations in conjunction with the EMTO-CPA method, where the related physical parameters, e.g., total energy, lattice constant, elastic constants, and elastic moduli, are calculated as a function of Mo content. And then the dependencies of these physical parameters are presented and discussed on Mo contents in the CrFeCoNiMox (0.1 ≤ x ≤ 0.3) HEAs. The results show that this work provides a valuable insight for further theoretical and experimental studies of CrFeCoNiMox (0.1 ≤ x ≤ 0.3) HEAs.
2 Theoretical methodology
The first-principles calculations of CrFeCoNiMox (0.1 ≤ x ≤ 0.3) HEAs is realized by the EMTO-CPA method based on the density functional theory (DFT). The generalized gradient approximation (GGA) within the Perdew–Burke–Ernzerhof (PBE) is selected as the concrete formalism of exchange–correlation functional.41 The disordered local moment model is employed to describe the paramagnetic state calculations.42 Calculating total energy with full charge-density technique,27 and adopting the single-site CPA method to resolve the substitutional and magnetic disorders.28–30 The scalar-relativistic approximation and soft-core scheme are applied to solve the Kohn–Sham equations of single electron. The local lattice relaxation effects and atomic short-range order are completely ignored because the CPA method is a single-site mean-field approximation. The electronic states of s, p, d, and f orbitals are included in the basis set. The Green's functions of 16 complex energy points on a semicircular including valence states below the Fermi level are calculated. To guarantee the convergence accuracy of all energies, we used 29 × 29 × 29 inequivalent k-points for integration calculations in the Brillouin zone. The equilibrium volume and equilibrium lattice constant are obtained from the equation of state obtained by fitting the calculated energy-volume data by the Morse-type function.433 Results and discussions
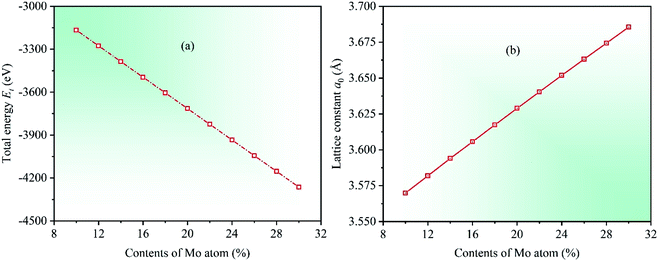
Under the known parameters, two basic parameters of the unit cell of CrFeCoNiMox (0.1 ≤ x ≤ 0.3) HEAs, total energy Et and equilibrium lattice constant a0, are calculated firstly, and the theoretical predictions as a function of Mo content are shown in Fig. 1. In the light of the calculated results, it can be found that the value of total energy Et decreases linearly with increasing Mo content from 0.1 to 0.3, while the lattice constant a0 is opposite, indicating that Mo atom addition to CrFeCoNi-based HEAs causes a dilation of the lattice, which increases the interatomic distance and reduces the electron interactions, thereby decreasing the total energy of unit cell. To prove the validity of theoretical analysis, we present the calculated lattice constant a0 along with available experimental data for equiatomic CrFeCoNiMo0.2 HEA and non-equiatomic CrFeCoNiMo0.23 HEA, as listed in Table 1, in which we did an extra calculation on the median value x = 0.23. By comparison, it can be seen that the calculated lattice constants of CrFeCoNiMo0.2 and CrFeCoNiMo0.23 HEAs are 3.629 and 3.646 Å, respectively, which are in good agreement with the experimental data,38–40,44 indicating that the theoretical analysis is feasible.To investigate the effects of Mo content on mechanical properties of CrFeCoNiMox (0.1 ≤ x ≤ 0.3) HEAs, elastic constants need to be calculated to determine the stability of crystal structure and to derive other physical parameters. The mechanical stability of materials can be described by elastic constants C11, C12, and C44 for the cubic crystal structure, and they must satisfy the stability criterion C11 > 0, C44 > 0, C11 − C12 > 0, and C11 + 2C12 > 0.45 Through calculation, the dependencies of theoretical elastic constants on Mo contents in CrFeCoNiMox (0.1 ≤ x ≤ 0.3) HEAs are displayed in Fig. 2. It can be found that the values of elastic constants C11, C12, and C44 always meet the stability criterion of cubic crystal at different Mo contents, indicating that the crystal structure of CrFeCoNiMox (0.1 ≤ x ≤ 0.3) HEAs can maintain mechanical stability. Obviously, the total varying trend of each curve is gradually decreasing with the increase of Mo content, the reason is that the lattice constant a0 increases linearly with increasing Mo content, which increases the distance between atoms, thus weakening the strength of the bonding force between atoms, thereby elastic constants decrease with the increase of Mo content. And there is a dramatic change of the values of elastic constants C11 and C12 as Mo content increases from 0.26 to 0.28, indicating that the deformation resistance of materials has a significant change, where the dramatic decline may be attributed to the structural phase transition caused by severe lattice distortion in HEAs, but the current EMTO-CPA method cannot explain the reason. Meanwhile, these obvious changes of the elastic constants will cause the change of relevant physical parameters. In Table 1, we list the calculated elastic constants along with available experimental data39 for CrFeCoNiMo0.23 HEA, it can be seen that the theoretical predictions and experimental results are generally consistent with each other.
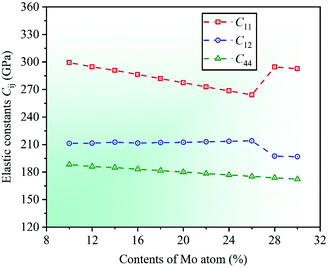 | ||
| Fig. 2 Dependencies of elastic constants Cij on Mo contents in CrFeCoNiMox (0.1 ≤ x ≤ 0.3) HEAs. The deformation resistance of CrFeCoNiMox (0.26 ≤ x ≤ 0.28) HEAs has a significant change. | ||
As is known to all, HEAs have various excellent mechanical properties, including high strength, high hardness, good ductility, and so on. These performances are usually related to the elastic moduli of materials, such as Young's modulus E, shear modulus G, and bulk modulus B, and the larger value indicates the stronger deformation resistance of materials.46,47 The material moduli with respect to elastic constants Cij can be written as B = (C11 + 2C12)/3, G = (GV + GR)/2, and E = 9BG/(3B + G), where GV = (C11 − C12 + C44)/5 is Voigt shear modulus, and GR = 5(C11 − C12)C44/[4C44 + 3(C11 − C12)] represents Reuss shear modulus.48
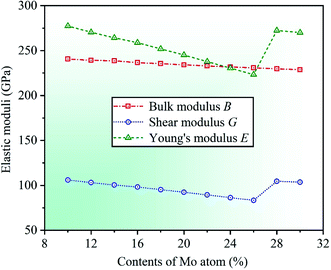
By calculation, we present the theoretical elastic moduli E, G, and B for CrFeCoNiMox (0.1 ≤ x ≤ 0.3) HEAs as a function of Mo content, as shown in Fig. 3. It can be found that the bulk modulus B decreases gradually with increasing Mo content, and the trend of Young's modulus E is similar to that of the shear modulus G that the value of elastic modulus decreases at first, then increases, and then decreases with the increase of Mo content, and both of them increase dramatically as Mo content increases from 0.26 to 0.28. Herein, the decrease of elastic moduli indicates that the deformation resistance of HEAs decline, and the significant increase of elastic moduli demonstrates that the capability of alloys to resist elastic and shear deformation enhance remarkably. When Mo content is 26%, Young's modulus E and shear modulus G get the minimum values, suggesting that CrFeCoNiMo0.26 HEA has the worst resistance to elastic and shear deformation compared with other HEAs with different Mo contents. As the same time, the reliability of the theoretical analysis is verified by comparing the calculated elastic modulus with available experimental results for CrFeCoNiMo0.2 and CrFeCoNiMo0.23 HEAs, as listed in Table 1. It can be seen that the theoretical predictions of shear modulus G is 92.4 GPa for CrFeCoNiMo0.2 HEA and Young's modulus E is 234.2 GPa for CrFeCoNiMo0.23 HEA, which are generally agreement with the available experimental data G = 85 GPa and E = 274 GPa, respectively.39,40
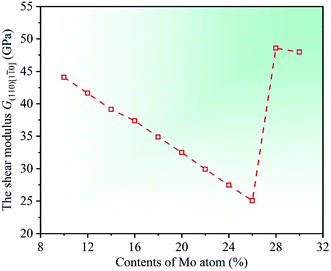
Meanwhile, another important material modulus, G(110)[1![[1 with combining macron]](https://www.rsc.org/images/entities/char_0031_0304.gif) 0], is calculated to further investigate the deformation resistance of CrFeCoNiMox (0.1 ≤ x ≤ 0.3) HEAs. Herein, G(110)[1
0], is calculated to further investigate the deformation resistance of CrFeCoNiMox (0.1 ≤ x ≤ 0.3) HEAs. Herein, G(110)[1![[1 with combining macron]](https://www.rsc.org/images/entities/char_0031_0304.gif) 0] is a shear modulus which can be used to represent the shear deformation resistance in the (110)[1
0] is a shear modulus which can be used to represent the shear deformation resistance in the (110)[1![[1 with combining macron]](https://www.rsc.org/images/entities/char_0031_0304.gif) 0] crystallographic direction.49,50 The shear modulus can be derived from the elastic constants Cij by G(110)[1
0] crystallographic direction.49,50 The shear modulus can be derived from the elastic constants Cij by G(110)[1![[1 with combining macron]](https://www.rsc.org/images/entities/char_0031_0304.gif) 0] = (C11 − C12)/2. By calculation, the dependencies of the shear modulus G(110)[1
0] = (C11 − C12)/2. By calculation, the dependencies of the shear modulus G(110)[1![[1 with combining macron]](https://www.rsc.org/images/entities/char_0031_0304.gif) 0] on Mo contents in CrFeCoNiMox (0.1 ≤ x ≤ 0.3) HEAs are obtained and displayed in Fig. 4. It can be seen that the value of modulus G(110)[1
0] on Mo contents in CrFeCoNiMox (0.1 ≤ x ≤ 0.3) HEAs are obtained and displayed in Fig. 4. It can be seen that the value of modulus G(110)[1![[1 with combining macron]](https://www.rsc.org/images/entities/char_0031_0304.gif) 0] decreases first, then increases, and then decreases with the increase in contents of Mo atom, in which the decrease of material modulus indicates that the shear deformation resistance of HEAs decline. Clearly, the shear modulus G(110)[1
0] decreases first, then increases, and then decreases with the increase in contents of Mo atom, in which the decrease of material modulus indicates that the shear deformation resistance of HEAs decline. Clearly, the shear modulus G(110)[1![[1 with combining macron]](https://www.rsc.org/images/entities/char_0031_0304.gif) 0] take the minimum value when Mo content is 26%, indicating that the resistance to shear deformation of CrFeCoNiMo0.26 HEA is the worst. And there is a rapidly increase for the shear modulus G(110)[1
0] take the minimum value when Mo content is 26%, indicating that the resistance to shear deformation of CrFeCoNiMo0.26 HEA is the worst. And there is a rapidly increase for the shear modulus G(110)[1![[1 with combining macron]](https://www.rsc.org/images/entities/char_0031_0304.gif) 0] when Mo contents are in the range of 26% and 28%. The variation trend is attributed to the reason that Mo content of 28% greatly increases the shear modulus in the (110)[1
0] when Mo contents are in the range of 26% and 28%. The variation trend is attributed to the reason that Mo content of 28% greatly increases the shear modulus in the (110)[1![[1 with combining macron]](https://www.rsc.org/images/entities/char_0031_0304.gif) 0] direction, thus, the resistance to shear deformation of CrFeCoNiMox (0.26 ≤ x ≤ 0.28) HEAs is greatly improved in the (110)[1
0] direction, thus, the resistance to shear deformation of CrFeCoNiMox (0.26 ≤ x ≤ 0.28) HEAs is greatly improved in the (110)[1![[1 with combining macron]](https://www.rsc.org/images/entities/char_0031_0304.gif) 0] crystallographic direction, which fits well with the results of Fig. 3.
0] crystallographic direction, which fits well with the results of Fig. 3.
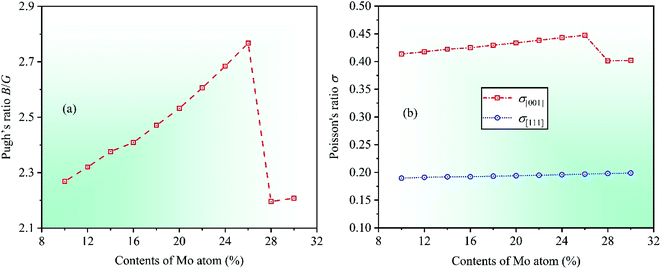
Ductile-brittle transition can also influence the mechanical properties of materials. In 1954, Pugh summed up a vital conclusion that the ductile–brittle transition was related to the ratio between bulk modulus B and shear modulus G for multicomponent alloys.46 The critical value of the ratio B/G is about 1.75, indicating that materials with B/G > 1.75 are ductile whereas those with B/G < 1.75 brittle. By calculation, the dependencies of theoretical Pugh's ratio B/G on Mo contents in CrFeCoNiMox (0.1 ≤ x ≤ 0.3) HEAs is depicted in Fig. 5a. With the increase in contents of Mo atom, it can be seen that the value of Pugh's ratio B/G is always greater than 1.75 indicating that CrFeCoNiMox (0.1 ≤ x ≤ 0.3) HEAs present good ductility in nature. Clearly, Pugh's ratio B/G gets the maximum value as Mo content is 26%, which implies that CrFeCoNiMo0.26 HEA has the best ductility. When Mo contents are in the range of 26% and 28%, the dramatic decline of theoretical value indicates that the ductility of CrFeCoNiMox (0.26 ≤ x ≤ 0.28) HEAs decrease significantly, and the result also shows that the deformation resistance of HEAs enhance, which agrees well with the results of Fig. 3.
Poisson's ratio σ is an important parameter to reflect the plasticity of alloys, the larger ratio indicates the better plastic property of materials, and the range is generally 0 to 0.5. Poisson's ratio of fcc crystal structure could be expressed by σ[001] and σ[111] in the [001] and [111] crystallographic directions, the specific expressions are σ[001] = C12/(C11 + C12) and σ[111] = (C11 + 2C12 − 2C44)/2(C11 + 2C12 + C44).47 Through calculation, the dependencies of Poisson's ratios σ[001] and σ[111] on Mo contents are shown in Fig. 5b. With increasing Mo content, it can be found that the Poisson's ration σ[001] increases first and then decreases, while the Poisson's ratio σ[111] increases slowly, but this change is hard to detect intuitively, where the increase of Poisson's ratios σ[001] and σ[111] demonstrates that the plasticity of alloys enhance in the [001] and [111] directions, respectively. Obviously, when Mo content is 26%, the Poisson's ratios σ[001] gets the maximum value indicating that CrFeCoNiMo0.26 HEA has the best plasticity compared with other HEAs with different Mo contents. There is a significant decreasing for the value of Poisson's ratio σ[001] when Mo contents are in the range of 26% and 28%, suggesting that the plasticity of CrFeCoNiMox (0.26 ≤ x ≤ 0.28) HEAs decreases remarkably in the [001] direction.
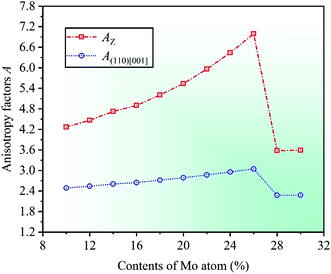
Severe lattice distortion is the essential characteristic of HEAs, which significantly breaks the structural symmetry of crystal cell, and then the material exhibits anisotropy. Therefore, elastic anisotropy is an important parameter to study the mechanical properties of materials, and it can be quantified by anisotropy factor A.51,52 Anisotropy factor A = 1 corresponds to the isotropic materials, otherwise anisotropic. A comprehensive study on the elastic anisotropy was made by Yoo.53 In his study, a cross-slip-pinning model was proposed to study the cross slip of screw dislocations, and the results showed that the larger the anisotropy factor A, the greater the driving force, and the easier it was to promote the cross slip of screw dislocations. The elastic anisotropy of cubic crystal can be expressed by anisotropy factors AZ and A(110)[001], which are related to elastic constants. The calculation formulas are AZ = 2C44/(C11 − C12) and A(110)[001] = C44(D1 + 2C12 + C11)/(C11D1 − C122),54,55 where AZ is Zener ratio which can be used to represent the ratio of shear moduli between the (100) and (110) crystal planes, and also to describe the degree of elastic anisotropy in cubic crystal. A(110)[001] represents the anisotropy factor in the (110)[001] crystallographic direction, and D1 = C44 + (C11 + C12)/2.
By calculation, the anisotropy factors AZ and A(110)[001] with respect to different Mo contents in CrFeCoNiMox (0.1 ≤ x ≤ 0.3) HEAs are obtained, as shown in Fig. 6. Obviously, the values of anisotropy factors are greater than unity at different Mo contents suggesting that the cubic crystal structure in CrFeCoNiMox (0.1 ≤ x ≤ 0.3) HEAs is anisotropic. Meanwhile, the overall trend of both anisotropy factors is gradually increasing as the Mo content increases from 0.1 to 0.26, which denotes that the anisotropy of CrFeCoNiMox (0.1 ≤ x ≤ 0.26) HEAs is improved between the (100) and (110) crystal planes, as well as the (110)[001] crystallographic direction. And they get the maximum values when Mo content is 26%, indicating that the cross-slip of screw dislocations is most likely to occur in CrFeCoNiMo0.26 HEA, thereby it has better plasticity. Then, the values of anisotropy factors decrease dramatically when Mo contents are in the range of 26% and 28%, which shows that the driving force for the cross-slip of screw dislocations in crystal structure decline significantly, thereby enhancing the strength of materials, it fits well with the results of Fig. 3.
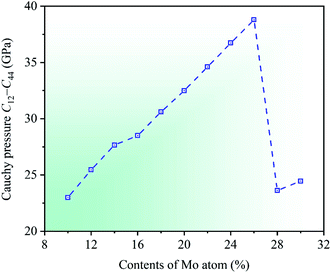
Cauchy pressure C12 − C44 is an important physical parameter to describe the atomic bonding characteristics of materials, which reflects the nature of bonding at the atomic level.56 Researches show that the atomic bonding has metallic characteristic for C12 − C44 > 0, whereas those has directional characteristic for C12 − C44 < 0, and the larger absolute value indicates the stronger metallic or directional characteristic of materials.52,57 In the light of the calculated elastic constants, the dependencies of Cauchy pressure C12 − C44 on Mo contents in CrFeCoNiMox (0.1 ≤ x ≤ 0.3) HEAs are shown in Fig. 7. It can be seen that the value of Cauchy pressure C12 − C44 is always positive at different Mo contents, thereby the atomic bonding of CrFeCoNiMox (0.1 ≤ x ≤ 0.3) HEAs mainly exhibits metallic characteristic. Obviously, the Cauchy pressure C12 − C44 gets the maximum value when Mo content is 26%, indicating that the atomic bonding of CrFeCoNiMo0.26 HEA has the strongest metallic characteristic. Then, the value of Cauchy pressure C12 − C44 decreases dramatically when Mo contents are in the range of 26% and 28%, which shows that the metallic characteristic of atomic bonding decline remarkably.
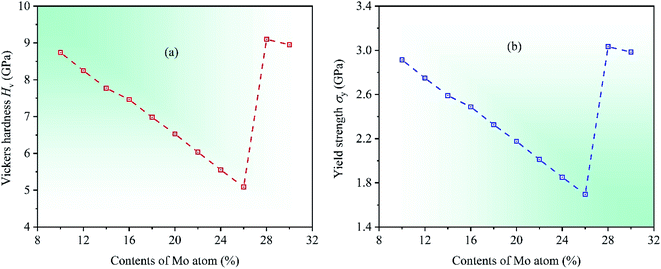
In order to further investigate the mechanical properties of CrFeCoNiMox (0.1 ≤ x ≤ 0.3) HEAs, we calculate the hardness and yield strength of materials. Hardness is the intrinsic resistance to deformation of materials when a force is applied, and yield strength refers to the ability to resist plastic deformation.58 In 2011, a comprehensive study on the hardness of polycrystalline materials was made by Chen et al.,59 they found that there was a relationship between hardness and elasticity of materials, which could be used to predict the hardness of crystalline materials, and a computational model was proposed to estimate the Vickers hardness Hv of polycrystalline materials, the corresponding expression is Hv = 2(k2G)0.585 − 3, where k = G/B. Meanwhile, yield strength can be expressed as σy = Hv/3.60 Through calculation, the dependencies of two physical parameters on Mo contents in CrFeCoNiMox (0.1 ≤ x ≤ 0.3) HEAs are depicted in Fig. 8. Obviously, the values of Vickers hardness Hv and yield strength σy decrease first, then increase, and then decrease with increasing of Mo content, where the reduction of numerical values indicates that the deformation resistance of HEAs declines. When Mo content is 26%, the Vickers hardness Hv and yield strength σy take the minimum values, indicating that the deformation resistance of CrFeCoNiMo0.26 HEA is minimal, which fits well with the results of Fig. 3.
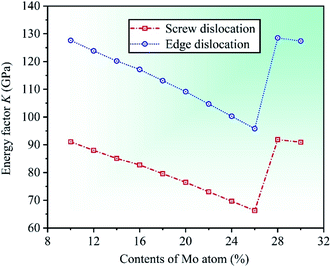
The plasticity of crystalline materials is also related to their dislocation nucleation ability, which can be estimated by energy factor K, the smaller value indicates that dislocation is more likely to nucleate in alloys. According to the works of Foreman and Savin et al.,61,62 energy factor K of the screw and edge dislocations could be expressed by elastic constants Cij, the specific expressions are  and
and  , in which D2 = C11 − C12, D3 = C11(C11 + C12 + 2C44). Through calculation, we present the theoretical energy factors Kscrew and Kedge for CrFeCoNiMox (0.1 ≤ x ≤ 0.3) HEAs as a function of Mo content, as shown in Fig. 9. Obviously, these two energy factors have the similar varying trend that their values decrease first, then increase, and then decrease with increasing of Mo content. When Mo content is 26%, both of them get the minimum values indicating that screw and edge dislocations are most likely to nucleate in CrFeCoNiMo0.26 HEA, thereby the alloy has better plasticity, which is in a good agreement with the results of Fig. 5b. Meanwhile, the energy factor of screw dislocation is smaller than that of the edge dislocation, suggesting that the nucleation of screw dislocation is easier to occur in CrFeCoNiMox (0.1 ≤ x ≤ 0.3) HEAs.
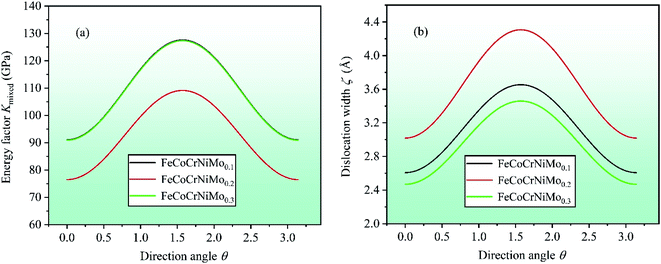
Lastly, energy factor Kmixed of mixed dislocation is calculated to study the mechanical properties of CrFeCoNiMox (0.1 ≤ x ≤ 0.3) HEAs, which is a function of the direction angle θ (0 ≤ θ ≤ π) between Burgers vector and dislocation line, and the corresponding expression is Kmixed = Kedge![[thin space (1/6-em)]](https://www.rsc.org/images/entities/char_2009.gif) sin2
sin2![[thin space (1/6-em)]](https://www.rsc.org/images/entities/char_2009.gif) θ + Kscrew
θ + Kscrew![[thin space (1/6-em)]](https://www.rsc.org/images/entities/char_2009.gif) cos2
cos2![[thin space (1/6-em)]](https://www.rsc.org/images/entities/char_2009.gif) θ.61,63 In order to further investigate the dislocation properties of CrFeCoNiMox (0.1 ≤ x ≤ 0.3) HEAs, dislocation width is calculated as ζ = Kmixedd/(C11 − C12), in which d represents the spacing between glide phases. By calculation, the dependencies of energy factor Kmixed and dislocation width ζ on the direction angle θ (0 ≤ θ ≤ π) are displayed in Fig. 10, where θ = 0 corresponds to the screw dislocation and θ = π/2 is the edge dislocation. In Fig. 10a, it can be found that CrFeCoNiMo0.2 HEA has the smallest energy factor for screw (θ = 0) and edge (θ = π/2) dislocations with respect to CrFeCoNiMo0.1 and CrFeCoNiMo0.3 HEAs, indicating that mixed dislocation is more likely to nucleate in CrFeCoNiMo0.2 HEA, thereby the alloy has better plasticity. And the energy factor of screw dislocation is smaller than that of the edge dislocation suggesting that the screw dislocation is more likely to occur in CrFeCoNiMox (x = 0.1, 0.2, 0.3) HEAs. In Fig. 10b, CrFeCoNiMo0.2 HEA has the maximum dislocation width compared with CrFeCoNiMo0.1 and CrFeCoNiMo0.3 HEAs, indicating that CrFeCoNiMo0.2 HEA has the minimum stacking-fault energy to promote twinning deformation, thereby improving the plasticity of alloy.
θ.61,63 In order to further investigate the dislocation properties of CrFeCoNiMox (0.1 ≤ x ≤ 0.3) HEAs, dislocation width is calculated as ζ = Kmixedd/(C11 − C12), in which d represents the spacing between glide phases. By calculation, the dependencies of energy factor Kmixed and dislocation width ζ on the direction angle θ (0 ≤ θ ≤ π) are displayed in Fig. 10, where θ = 0 corresponds to the screw dislocation and θ = π/2 is the edge dislocation. In Fig. 10a, it can be found that CrFeCoNiMo0.2 HEA has the smallest energy factor for screw (θ = 0) and edge (θ = π/2) dislocations with respect to CrFeCoNiMo0.1 and CrFeCoNiMo0.3 HEAs, indicating that mixed dislocation is more likely to nucleate in CrFeCoNiMo0.2 HEA, thereby the alloy has better plasticity. And the energy factor of screw dislocation is smaller than that of the edge dislocation suggesting that the screw dislocation is more likely to occur in CrFeCoNiMox (x = 0.1, 0.2, 0.3) HEAs. In Fig. 10b, CrFeCoNiMo0.2 HEA has the maximum dislocation width compared with CrFeCoNiMo0.1 and CrFeCoNiMo0.3 HEAs, indicating that CrFeCoNiMo0.2 HEA has the minimum stacking-fault energy to promote twinning deformation, thereby improving the plasticity of alloy.
4 Conclusions
In this work, EMTO-CPA method is used to study the mechanical properties of CrFeCoNiMox (0.1 ≤ x ≤ 0.3) HEAs with fcc crystal structure. Results show that the theoretical values of lattice constant, elastic constants, shear modulus, and Young's modulus fit well with the available experimental data. In the light of the stability criterion, the calculated elastic constants indicate that CrFeCoNiMox (0.1 ≤ x ≤ 0.3) HEAs can maintain mechanical stability. Atomic bonding of alloys mainly exhibits metallic characteristic since the value of Cauchy pressure is always positive at different Mo contents. When Mo contents are in the range of 26% and 28%, several physical parameters have a remarkable change, including elastic moduli, Pugh's ratio, Cauchy pressure, yield strength, and so on. The results reveal that the CrFeCoNiMo0.26 HEA exhibits better ductility and plasticity with respect to other alloys with different Mo contents, because it has the maximum Pugh's ratio and anisotropy factors, and has the minimum Vickers hardness and yield strength, etc. CrFeCoNiMo0.2 HEA has the minimum energy factor and the maximum dislocation width compared with CrFeCoNiMo0.1 and CrFeCoNiMo0.3 HEAs, indicating that the dislocation is easily inclined to nucleate in CrFeCoNiMo0.2 HEA, and the minimum stacking-fault energy in CrFeCoNiMo0.2 HEA may promote twining deformation, thereby enhancing the plasticity. The present results provide a theoretical prediction for exploring the excellent mechanical properties of CrFeCoNiMox (0.1 ≤ x ≤ 0.3) HEAs.Conflicts of interest
There are no conflicts to declare.Acknowledgements
We greatly appreciate the support of National Natural Science Foundation of China (51971091), the Key Laboratory of Guangdong Regular Higher Education (2017KSYS012), Foshan Key Technology Project (1920001000409), Guangzhou Technical Project (201704030113), and Prof. Levente Vitos for his developed codes of EMTO-CPA method. This work is implemented in National Supercomputer Centers in Changsha, China.References
- J. W. Yeh, S. K. Chen, S. J. Lin, J. Y. Gan, T. S. Chin, T. T. Shun, C. H. Tsau and S. Y. Chang, Adv. Eng. Mater., 2004, 6, 299–303 CrossRef CAS.
- J. W. Yeh, S. J. Lin, T. S. Chin, J. Y. Gan, S. K. Chen, T. T. Shun, C. H. Tsau and S. Y. Chou, Metall. Mater. Trans. A, 2004, 35, 2533–2536 CrossRef.
- B. Cantor, I. T. H. Chang, P. Knight and A. J. B. Vincent, Mater. Sci. Eng., A, 2004, 375–377, 213–218 CrossRef.
- J. Y. He, W. H. Liu, H. Wang, Y. Wu, X. J. Liu, T. G. Nieh and Z. P. Lu, Acta Mater., 2014, 62, 105–113 CrossRef CAS.
- Z. P. Wang, Q. H. Fang, J. Li, B. Liu and Y. Liu, Mater. Sci. Technol., 2018, 34, 349–354 CrossRef.
- T. T. Shun, C. H. Hung and C. F. Lee, J. Alloys Compd., 2010, 493, 105–109 CrossRef CAS.
- D. G. Kim, Y. H. Jo, J. M. Park, W. M. Choi, H. S. Kim, B. J. Lee, S. S. Sohn and S. Lee, J. Alloys Compd., 2020, 812, 1–9 CrossRef.
- X. Y. Liu, S. Q. Zhou and Y. Xu, Mater. Lett., 2018, 233, 142–145 CrossRef CAS.
- Y. H. Jo, K. Y. Doh, D. G. Kim, K. Lee, D. W. Kim, H. Sung, S. S. Sohn, D. Lee, H. S. Kim, B. J. Lee and S. Lee, J. Alloys Compd., 2019, 809, 1–9 CrossRef.
- W. Zhang, R. Tang, Z. B. Yang, C. H. Liu, H. Chang, J. J. Yang, J. L. Liao, Y. Y. Yang and N. Liu, J. Nucl. Mater., 2018, 512, 15–24 CrossRef CAS.
- B. Gludovatz, A. Hohenwarter, D. Catoor, E. H. Chang, E. P. George and R. O. Ritchie, Science, 2014, 345, 1153–1158 CrossRef CAS PubMed.
- Z. D. Han, N. Chen, S. F. Zhao, L. W. Fan, G. N. Yang, Y. Shao and K. F. Yao, Intermetallics, 2017, 84, 153–157 CrossRef CAS.
- O. N. Senkov, J. M. Scott, S. V. Senkova, D. B. Miracle and C. F. Woodward, J. Alloys Compd., 2011, 509, 6043–6048 CrossRef CAS.
- O. N. Senkov, G. B. Wilks, J. M. Scott and D. B. Miracle, Intermetallics, 2011, 19, 698–706 CrossRef CAS.
- Y. J. Zhou, Y. Zhang, Y. L. Wang and G. L. Chen, Mater. Sci. Eng., A, 2007, 454–455, 260–265 CrossRef.
- S. P. Wang, E. Ma and J. Xu, Intermetallics, 2018, 103, 78–87 CrossRef CAS.
- M. Dias, A. Ruza, F. Guerreiro, R. C. Silva, A. P. Goncalves, U. V. Mardolcar and E. Alves, Mater. Sci. Eng., B, 2018, 238–239, 18–25 CrossRef CAS.
- Y. L. Chou, J. W. Yeh and H. C. Shih, Corros. Sci., 2010, 52, 2571–2581 CrossRef CAS.
- M. H. Chuang, M. H. Tsai, W. R. Wang, S. J. Lin and J. W. Yeh, Acta Mater., 2011, 59, 6308–6317 CrossRef CAS.
- P. F. Yu, L. J. Zhang, H. Cheng, H. Zhang, M. Z. Ma, Y. C. Li, G. Li, P. K. Liaw and R. P. Liu, Intermetallics, 2016, 70, 82–87 CrossRef CAS.
- T. H. Hsieh, C. H. Hsu, C. Y. Wu, J. Y. Kao and C. Y. Hsu, Curr. Appl. Phys., 2018, 18, 512–518 CrossRef.
- Z. Wu, C. M. Parish and H. Bei, J. Alloys Compd., 2015, 647, 815–822 CrossRef CAS.
- H. Luo, Z. M. Li and D. Raabe, Nature, 2017, 7, 1–7 Search PubMed.
- Q. Q. Wei, L. Q. Wang, Y. F. Fu, J. N. Qin, W. J. Lu and D. Zhang, Mater. Des., 2011, 32, 2934–2939 CrossRef CAS.
- X. Sun, H. L. Zhang, S. Lu, X. D. Ding, Y. Z. Wang and L. Vitos, Acta Mater., 2017, 140, 366–374 CrossRef CAS.
- Y. Yang, L. Ma, G. Y. Gan, W. Wang and B. Y. Tang, J. Alloys Compd., 2019, 788, 1076–1083 CrossRef CAS.
- L. Vitos, Computational quantum mechanics for materials engineers: the EMTO method and applications, Springer, London, 2007 Search PubMed.
- P. Soven, Phys. Rev., 1967, 156, 809–813 CrossRef CAS.
- D. W. Taylor, Phys. Rev., 1967, 156, 1017–1029 CrossRef CAS.
- B. L. Gyorffy, Phys. Rev. B: Solid State, 1972, 5, 2382–2384 CrossRef.
- S. Huang, A. Vida, A. Heczel, E. Holmstrom and L. Vitos, JOM, 2017, 69, 2107–2112 CrossRef CAS.
- H. J. Ge, F. Y. Tian and Y. Wang, Comput. Mater. Sci., 2017, 128, 185–190 CrossRef CAS.
- X. Q. Li, J. Alloys Compd., 2018, 764, 906–912 CrossRef CAS.
- F. Y. Tian, L. K. Varga, J. Shen and L. Vitos, Comput. Mater. Sci., 2016, 111, 350–358 CrossRef CAS.
- P. Y. Cao, X. D. Ni, F. Y. Tian, L. K. Varga and L. Vitos, J. Phys.: Condens. Matter, 2015, 27, 1–6 Search PubMed.
- L. Y. Tian, G. S. Wang, J. S. Harris, D. L. Irving, J. J. Zhao and L. Vitos, Mater. Des., 2017, 114, 243–252 CrossRef CAS.
- J. W. Wang, Y. Liu, B. Liu, Y. Wang, Y. K. Cao, T. C. Li and R. Zhou, Mater. Sci. Eng., A, 2017, 689, 233–242 CrossRef CAS.
- W. H. Liu, Z. P. Lu, J. Y. He, J. H. Luan, Z. J. Wang, B. Liu, Y. Liu, M. W. Chen and C. T. Liu, Acta Mater., 2016, 116, 332–342 CrossRef CAS.
- B. Cai, B. Liu, S. Kabra, Y. Q. Wang, K. Yan, P. D. Lee and Y. Liu, Acta Mater., 2017, 127, 471–480 CrossRef CAS.
- L. Tang, K. Yan, B. Cai, Y. Q. Wang, B. Liu, S. Kabra, M. M. Attallah and Y. Liu, Scr. Mater., 2020, 178, 166–170 CrossRef CAS.
- J. P. Perdew, K. Burke and M. Ernzerhof, Phys. Rev. Lett., 1996, 77, 3865–3868 CrossRef CAS PubMed.
- B. L. Gyorffy, A. J. Pindor, J. Staunton, G. M. Stocks and H. Winter, J. Phys. F: Met. Phys., 1985, 15, 1337–1386 CrossRef CAS.
- L. A. Girifalco and V. G. Weizer, Phys. Rev., 1959, 114, 687–690 CrossRef CAS.
- P. H. Wu, N. Liu, W. Yang, Z. X. Zhu, Y. P. Lu and X. J. Wang, Mater. Sci. Eng., A, 2015, 642, 142–149 CrossRef CAS.
- J. F. Nye, Physical properties of crystals: their representation by tensors and matrices, Oxford University Press, Oxford, 1985 Search PubMed.
- S. F. Pugh, Philos. Mag., 1954, 45, 823–843 CAS.
- Z. P. Wang, Q. H. Fang, J. Li and B. Liu, Superlattices Microstruct., 2018, 116, 141–150 CrossRef CAS.
- O. L. Anderson, J. Phys. Chem. Solids, 1963, 24, 909–917 CrossRef CAS.
- H. Z. Fu, W. M. Peng and T. Gao, Mater. Chem. Phys., 2009, 115, 789–794 CrossRef CAS.
- H. Z. Fu, D. H. Li, F. Peng, T. Gao and X. L. Cheng, Comput. Mater. Sci., 2008, 44, 774–778 CrossRef CAS.
- M. Mattesini, R. Ahuja and B. Johansson, Phys. Rev. B: Condens. Matter Mater. Phys., 2003, 68, 1–5 CrossRef.
- H. Z. Fu, Z. G. Zhao, W. F. Liu, F. Peng, T. Gao and X. L. Cheng, Intermetallics, 2010, 18, 761–766 CrossRef CAS.
- M. H. Yoo, Scr. Metall., 1986, 20, 915–920 CrossRef CAS.
- K. Lau and A. K. Mccurdy, Phys. Rev. B: Condens. Matter Mater. Phys., 1998, 58, 8980–8984 CrossRef CAS.
- H. Z. Fu, X. F. Li, W. F. Liu, Y. M. Ma, T. Gao and X. H. Hong, Intermetallics, 2011, 19, 1959–1967 CrossRef CAS.
- D. G. Pettifor, Mater. Sci. Technol., 2013, 8, 345–349 CrossRef.
- R. A. Johnson, Phys. Rev. B: Condens. Matter Mater. Phys., 1988, 37, 3924–3931 CrossRef PubMed.
- J. S. Tse, J. Superhard Mater., 2010, 32, 177–191 CrossRef.
- X. Q. Chen, H. Y. Niu, D. Z. Li and Y. Y. Li, Intermetallics, 2011, 19, 1275–1281 CrossRef CAS.
- A. J. Zaddach, C. Niu, C. C. Koch and D. L. Irving, JOM, 2013, 65, 1780–1789 CrossRef CAS.
- A. J. E. Foreman, Acta Metall., 1955, 3, 322–330 CrossRef CAS.
- M. M. Savin, V. M. Chernov and A. M. Strokova, Phys. Status Solidi A, 1976, 35, 747–754 CrossRef CAS.
- C. N. Reid, Acta Metall., 1966, 14, 13–16 CrossRef CAS.
| This journal is © The Royal Society of Chemistry 2020 |

