 Open Access Article
Efficient and stable catalyst of α-FeOOH for NO oxidation from coke oven flue gas by the catalytic decomposition of gaseous H2O2†
Ziheng Mengab,
Chenye Wanga,
Xingrui Wanga and
Huiquan Li *ab
*ab
aCAS Key Laboratory of Green Process and Engineering, National Engineering Laboratory for Hydrometallurgical Cleaner Production Technology, Institute of Process Engineering, Chinese Academy of Sciences, Beijing 100190, China. E-mail: hqli@ipe.ac.cn
bSchool of Chemical Engineering, University of Chinese Academy of Sciences, Beijing 100049, China
First published on 26th February 2020
Abstract
Goethite (α-FeOOH) possesses excellent catalytic activity, high selectivity and good stability as a catalyst for NO oxidation through the catalytic decomposition of gaseous H2O2.  as the primary reactive oxygen species is involved in the NO oxidation process together with ·OH, and N2O5 is found for the first time in the products of NO oxidation.
Sulphur dioxide (SO2) and nitrogen oxides (NOx) yielded by fossil fuels and ore combustion are the major air pollutants produced by traditional chemical industries, including iron and steel, coking, and boilers, and these pollutants cause acid rain, fog, and haze. Wet flue gas desulphurisation (WFGD) and selective catalytic reduction (SCR) are efficient methods used in power plants for desulphurisation and denitration, respectively.1 However, in traditional chemical industries, for example, coke oven flue gas yielded by coke oven gas combustion has a flue gas temperature of about 200–230 °C and the composition is complex,2 which limits the utilisation of SCR.3
Recently, we proposed a promising process of gas-phase oxidation combined with wet scrubbing using steel slag slurry to treat NOx from low-temperature flue gas.4,5 In this process, the sparingly soluble NO could be oxidised into soluble NO2, HNO3 or N2O5 through the gas-phase oxidation process, and then the oxidation products could be absorbed together with SO2 in a wet scrubbing device. This method can achieve the simultaneous removal of SO2 and NOx using the oxidisers. Some oxidisers, such as O3,6,7 H2O2,8–12 NaClO2,13 NaClO,14 persulphate salt (S2O82−)15 and ferrate (Fe[VI]),16 can be used as the gas-phase oxidiser for NO oxidation after being gasified if needed.
H2O2 is a green and low-cost oxidizer, which can be used as the gas-phase oxidizer for NO oxidation after liquid H2O2 is gasified at low temperature. Furthermore, the oxidation potential of H2O2 (1.77 eV) is lower compared with that of O3 (2.08 eV) and ·OH (2.80 eV) and thus its efficiency in oxidising NO is low.12,17 Thermal decomposition of gaseous H2O2 can decompose H2O2 into radicals (·OH or  ) with high oxidation potential for NO oxidation. However, this technology requires high H2O2 consumption (H2O2/NO = 80) and excessive residence time (34 s) and results in low NO oxidation efficiency (∼60%).18 Introducing catalysts into the H2O2 decomposition process can effectively decompose H2O2 into radicals and considerably reduce the consumption of H2O2.11 Iron-based materials, such as hematite (α-Fe2O3),8 nanoscale zero-valent iron,9 Fe3O4,10 γ-Fe2O3@Fe3O4,11 Fe2(MoO4)3
![[thin space (1/6-em)]](https://www.rsc.org/images/entities/char_2009.gif) 19 and Fe2(SO4)3,12 have been used as catalysts to decompose gaseous H2O2 for NO oxidation. These catalysts have high removal efficiencies as heterogeneous catalysts for the simultaneous removal of NO and SO2 in an integrated catalytic oxidation/wet scrubbing process. However, the use of these catalysts results in relatively high H2O2 consumption8,9,12,20 and relatively low gas hourly space velocity (GHSV)19 and catalytic stability.9,12 Therefore, a catalyst with low H2O2 consumption and high GHSV and catalytic stability for NO oxidation through catalytic decomposition of gaseous H2O2 should be developed.
19 and Fe2(SO4)3,12 have been used as catalysts to decompose gaseous H2O2 for NO oxidation. These catalysts have high removal efficiencies as heterogeneous catalysts for the simultaneous removal of NO and SO2 in an integrated catalytic oxidation/wet scrubbing process. However, the use of these catalysts results in relatively high H2O2 consumption8,9,12,20 and relatively low gas hourly space velocity (GHSV)19 and catalytic stability.9,12 Therefore, a catalyst with low H2O2 consumption and high GHSV and catalytic stability for NO oxidation through catalytic decomposition of gaseous H2O2 should be developed.
Goethite (α-FeOOH) is a ubiquitous natural mineral in soils and sediments at the Earth's surface that is widely used as a heterogeneous Fenton catalyst for wastewater treatment due to its abundance, availability, relative stability and low cost.21 He et al. explored the catalytic performance of α-FeOOH and found that it can be used to catalyse H2O2 vapour for NO oxidation under low-temperature (<160 °C) flue gas;22 however, coke oven flue gas has a higher flue gas temperature (200–230 °C), and the reaction products and catalytic mechanism may be different under different temperature regions. Therefore, the performance of α-FeOOH for NO oxidation through catalysing gaseous H2O2 under high flue gas temperature should be investigated, and the SO2 oxidation efficiency of this process should also be evaluated. Herein, NO and SO2 conversions and NO2 yield using α-FeOOH with gaseous H2O2 were performed under the wide temperature range of 100–350 °C, and the catalytic stability and reaction mechanism were determined.
Fresh α-FeOOH catalyst was prepared via precipitation reaction of Fe3+ followed by crystal transformation according to the method of Böhm.23 All chemicals used in the experiments were of analytical grade, and deionised water was used. NO, NO2, and SO2 concentrations in simulated flue gas were analysed using a UV differential optical absorption spectroscopy (DOAS) flue gas comprehensive analyser (Laoying3023, Qingdao Laoying Environmental Technology Co., Ltd.). The presence of HNO3 and N2O5 in the flue gas were detected using a Fourier transform infrared (FTIR) spectrometer (Tensor 27, Bruker Optik, Inc.), which was equipped with a 2.4 m gas cell. Catalysts were characterised via X-ray diffraction (XRD) spectroscopy (Empyrean, PANalytical Instruments) and FTIR spectrometry. Hydroxyl radical (·OH) and superoxide anion radical  decomposed by H2O2 were detected via electron paramagnetic resonance (EPR) spectroscopy (A300-10/12, Bruker Optik Inc.), and 5,5-dimethyl-1-pyrroline N-oxide (DMPO) was used for capturing ·OH and
  . Specifically, DMPO–H2O solvent was used to capture the ·OH generated after H2O2 was catalysed, whereas DMPO–CH3OH was used to capture
  The experimental equipment for evaluating the catalytic performance of α-FeOOH was established (Fig. S1, ESI†). In brief, the bypass of N2 carried the gaseous H2O2 generated by the evaporation of H2O2 solution and mixed with the simulated flue gas, and then the mixture gas contacted with the catalyst, in which gaseous H2O2 was decomposed into radicals over the catalyst and oxidised NO and SO2. At the outlet of the catalytic reactor, the simulated flue gas after being oxidised was detected using a UV DOAS flue gas comprehensive analyser and an FTIR spectrometer equipped with a gas cell. Each experiment was conducted for 20 min after the temperature was stabilised.
According to Christensen et al., α-FeOOH is transformed to hematite (α-Fe2O3) within the temperature range of 171–311 °C, and α-FeOOH is totally converted to α-Fe2O3 at 350 °C.24 The fresh catalyst and the catalyst calcinated at 350 °C were characterised via XRD and FTIR spectrometry. The FTIR and XRD spectra (Fig. S2 and S3, ESI†) indicated that the fresh catalyst was α-FeOOH and the catalyst calcinated at 350 °C was α-Fe2O3 in an N2 atmosphere. The colour of the fresh catalyst (yellow) and the calcinated catalyst (red) also proved the above results (Fig. S4, ESI†). An FTIR spectrometer equipped with a gas cell was used to analyse the water vapour and further investigate the transformation temperature of α-FeOOH. Results (Fig. S5, ESI†) showed that α-FeOOH began to decompose into α-Fe2O3 and H2O when the temperature was above 200 °C in an N2 atmosphere. However, when H2O(g) and H2O2(g) were existed in N2 atmosphere, they could improve the thermal stability of α-FeOOH. The reason may be that (1) multiple types of surface hydroxyls (–OHs) generated by the adsorption of water on α-FeOOH surface prevented the dehydration of –OHs;25,26 and (2) H2O(g) from the injected H2O2 solution were adsorbed on the reduced ![[triple bond, length as m-dash]](https://www.rsc.org/images/entities/char_e002.gif) Fe(II) and generated
Fe(II) and generated ![[triple bond, length as m-dash]](https://www.rsc.org/images/entities/char_e002.gif) Fe(II)–OH via eqn (1) and (2), and
Fe(II)–OH via eqn (1) and (2), and ![[triple bond, length as m-dash]](https://www.rsc.org/images/entities/char_e002.gif) Fe(II)–OH was converted to
Fe(II)–OH was converted to ![[triple bond, length as m-dash]](https://www.rsc.org/images/entities/char_e002.gif) Fe(III)–OH via eqn (3).12,19,22,27,28 The catalyst α-FeOOH was still stable when temperature was up to 225 °C, and little α-FeOOH close to the wall of the reactor was converted to α-Fe2O3 (the color of catalyst was changed from yellow to red) when temperature was up to 350 °C. Therefore, the catalyst α-FeOOH possesses great thermal stability under the simulated flue gas condition (e.g., the experimental condition in Fig. 1).
Fe(III)–OH via eqn (3).12,19,22,27,28 The catalyst α-FeOOH was still stable when temperature was up to 225 °C, and little α-FeOOH close to the wall of the reactor was converted to α-Fe2O3 (the color of catalyst was changed from yellow to red) when temperature was up to 350 °C. Therefore, the catalyst α-FeOOH possesses great thermal stability under the simulated flue gas condition (e.g., the experimental condition in Fig. 1).
 | (1) |
![[triple bond, length as m-dash]](https://www.rsc.org/images/entities/char_e002.gif) Fe(II) + Vo + H2O → Fe(II) + Vo + H2O → ![[triple bond, length as m-dash]](https://www.rsc.org/images/entities/char_e002.gif) Fe(II)–OH2+ → Fe(II)–OH2+ → ![[triple bond, length as m-dash]](https://www.rsc.org/images/entities/char_e002.gif) Fe(II)–OH + H+ Fe(II)–OH + H+
| (2) |
![[triple bond, length as m-dash]](https://www.rsc.org/images/entities/char_e002.gif) Fe(II)–OH + H2O2 → Fe(II)–OH + H2O2 → ![[triple bond, length as m-dash]](https://www.rsc.org/images/entities/char_e002.gif) Fe(III)–OH + ·OH Fe(III)–OH + ·OH
| (3) |
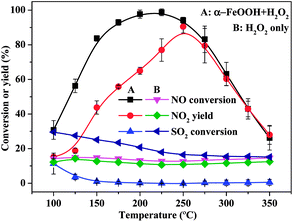
As shown in Fig. 1, NO conversion and NO2 yield were both lower than SO2 conversion when gaseous H2O2 only was used for NO oxidation. This result indicated that SO2 was more easily oxidised by gaseous H2O2 than NO, which consumed a large amount of H2O2. NO conversion and NO2 yield were higher, but SO2 conversion was considerably lower than using gaseous H2O2 only when α-FeOOH was used to catalyse gaseous H2O2 for NO oxidation. Therefore, α-FeOOH performed excellent catalytic activity and high selectivity for NO oxidation. Specifically, NO conversion achieved 98.8% and NO2 yield reached 77.0% at H2O2/NO of 2.0, reaction temperature of 225 °C, catalyst dosage of 0.5 g and GHSV of 137![[thin space (1/6-em)]](https://www.rsc.org/images/entities/char_2009.gif) 747 h−1. The catalyst of α-FeOOH achieved a higher NO oxidation efficiency under low H2O2 consumption and high GHSV compared with those reported by previous studies (Table S1, ESI†).8,9,12,17,19,20
747 h−1. The catalyst of α-FeOOH achieved a higher NO oxidation efficiency under low H2O2 consumption and high GHSV compared with those reported by previous studies (Table S1, ESI†).8,9,12,17,19,20
Fig. 1 shows that NO conversion was higher than NO2 yield within the temperature range of 100–225 °C, and NO conversion was closer to NO2 yield when the temperature further increased from 250 °C to 350 °C. This trend indicated that the products of NO oxidation was not just NO2 within the temperature range of 100–225 °C, and the product of NO oxidation might only be NO2 within the temperature range of 250–350 °C. The products of NO oxidation were determined via FTIR spectroscopy. As shown in Fig. 2, the peaks for NO2 (1599 cm−1), HNO3 (886 cm−1) and N2O5 (1719 cm−1) were observed in the FTIR spectra within the temperature range of 100–200 °C.29,30 However, no obvious peaks for NO2, HNO3, and N2O5 were detected in the FTIR spectra when H2O2 was not added. This result indicated that NO2, HNO3 and N2O5 were the main products of NO oxidation through the catalytic decomposition of gaseous H2O2 over α-FeOOH in low-temperature (100–200 °C) region. Furthermore, the peaks for HNO3 and N2O5 in the FTIR spectra disappeared when the temperature increased from 225 °C to 350 °C. The reason is that HNO3 and N2O5 decomposed in the high-temperature region (225–350 °C) (eqn (4) and (5)).29 In summary, NO2, HNO3 and N2O5 were the main products of NO oxidation in the low-temperature region (100–200 °C), whereas NO2 was the main product in the high-temperature region (225–350 °C).
| N2O5 → NO + NO2 + O2 | (4) |
| 2HNO3 → NO + NO2 + O2 + H2O | (5) |
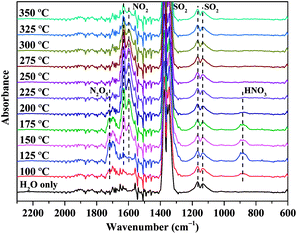 | ||
| Fig. 2 FTIR spectra of simulated flue gas oxidised by gaseous H2O2 over α-FeOOH under different temperature conditions. (Experimental condition was the same as that in Fig. 1.) | ||
Fig. 1 shows that NO conversion sharply increased when the temperature increased from 100 °C to 200 °C and then decreased when the temperature further increased from 225 °C to 350 °C. The increase in NO conversion with temperature was because high temperatures enhance H2O2 decomposition into radicals according to the Arrhenius law,12 which further accelerates NO conversion. The decrease in NO conversion at temperatures above 200 °C could be explained by (1) the thermal decomposition of gaseous H2O2 under high temperature and/or (2) the transformation of α-FeOOH under high temperature. On the one hand, gaseous H2O2 can be decomposed under high temperature. An FTIR spectrometer equipped with a gas cell was used to detect gaseous H2O2 under different temperature conditions (free of catalyst) to investigate the decomposition temperature of gaseous H2O2,31 and the variations in H2O2 content were measured by their homologous infrared absorption characteristic peaks (Fig. S6, ESI†). Results (Fig. S7, ESI†) indicated that H2O2 almost did not decompose at 100–300 °C, and the thermal decomposition of gaseous H2O2 occurred when the temperature increased further to 300 °C. On the other hand, NO-TPD (Fig. S8, ESI†) showed that the absorbed NO began to desorb when the temperature was above 200 °C. Therefore, when the temperature was above 200 °C, NO conversion decreased when the temperature was above 200 °C. Overall, the transformation of α-FeOOH under high temperature (>200 °C) led to the decrease in NO conversion when the temperature was above 200 °C, and the thermal decomposition of gaseous H2O2 also resulted in the decrease in NO conversion when the temperature was above 300 °C.
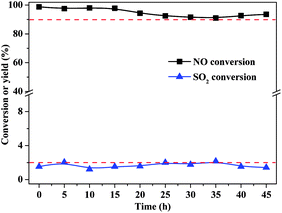
The catalytic stability of α-FeOOH was also investigated. As shown in Fig. 3, NO conversion was maintained at a high level (>97.0%) within the first 15 h and then fluctuated slightly but remained at >90.0% at 15–45 h. SO2 conversion remained stable at about 2.0%. Results indicated that α-FeOOH possesses excellent catalytic activity, good stability and high selectivity for NO oxidation. According to the results in Fig. 1 and 3, the catalyst has an ideal temperature window of 175–250 °C; therefore, α-FeOOH can be applied in coke oven flue gas (200–230 °C) treatment.
Fresh and used (after the 45 h test) α-FeOOH were characterised via FTIR and XRD spectroscopy. The bands at 3363, 3127 and 1628 cm−1 are the O–H stretching mode in α-FeOOH, the stretching mode of surface water and the bending mode of H2O, respectively. The characteristic strong bands at 795 and 891 cm−1 were assigned to the Fe–O–H bending vibrations of α-FeOOH. The band at 638 cm−1 was assigned to the Fe–O stretching vibration of pure α-FeOOH. The characteristic absorption peaks of α-FeOOH in the catalyst after the 45 h test did not change compared with that of the fresh catalyst (Fig. S9, ESI†), indicating that the catalyst maintained the structure of α-FeOOH even after the 45 h test. The band at 999 cm−1 was assigned to ν1(SO4) frequency, and the bands at 1076, 1136 and 1229 cm−1 were interpreted as ν3(SO4) frequencies. These vibrational frequencies are attributed to specifically adsorbed SO42− ions on the external and internal surfaces of catalyst particles after the 45 h test.32,33 The XRD patterns showed that the phase of the catalyst before and after the stability test was still α-FeOOH (Fig. S10, ESI†). This result also indicated that α-FeOOH possessed good stability in the NO oxidation process.
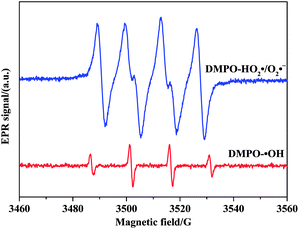
EPR test was conducted to detect the radicals generated by H2O2 decomposition and analyse the oxygen species of the α-FeOOH/H2O2 system. Fig. 4 shows the 4-fold characteristic peak of DMPO–·OH adducts with an intensity ratio of 1![[thin space (1/6-em)]](https://www.rsc.org/images/entities/char_2009.gif) :
:![[thin space (1/6-em)]](https://www.rsc.org/images/entities/char_2009.gif) 2
2![[thin space (1/6-em)]](https://www.rsc.org/images/entities/char_2009.gif) :
:![[thin space (1/6-em)]](https://www.rsc.org/images/entities/char_2009.gif) 2
2![[thin space (1/6-em)]](https://www.rsc.org/images/entities/char_2009.gif) :
:![[thin space (1/6-em)]](https://www.rsc.org/images/entities/char_2009.gif) 1 and four notable signals ascribed to
1 and four notable signals ascribed to  adducts. These peaks and signals indicate the formation of ·OH and
  in the α-FeOOH/H2O2 system.21,34 Furthermore, the intensity of the 4-fold characteristic peak of DMPO–·OH adducts was significantly weaker than that of
  adducts, indicated that the quantity of
  produced by the α-FeOOH/H2O2 system was larger than that of ·OH. Therefore, α-FeOOH can decompose H2O2 into ·OH and
  and
and  may be dominant among ·OH and
  for NO oxidation. Radical trapping experiments (Fig. S11, ESI†) further proved the roles of radicals (·OH and
  ) in the NO oxidation process. Benzoquinone (BQ,
  scavenger20) was added into the H2O2 solutions, and H2O2 and BQ in the mixture solution was vapoured together. NO conversion substantially decreased from 92.9% to 6.1% when the molar ratio of BQ to H2O2 increased from 0 to 1.0. The reason was that the addition of BQ captured the
  generated by gaseous H2O2 decomposition over α-FeOOH, thereby decreasing NO conversion. NO conversion decreased from 92.9% to 8.0% when isopropanol (i-PrOH, ·OH scavenger20) was introduced into the same system as the molar ratio of i-PrOH to H2O2 increased from 0 to 8.0. The reason was that ·OH generated in the α-FeOOH/H2O2 system was captured by i-PrOH instead of oxidised NO. These results indicated that when the addition concentration of the ·OH scavenger (i-PrOH) was eight times that of
  scavenger (BQ), both systems obtained the similar decrease in NO conversion. Therefore,
  as the primary reactive oxygen species was involved in the NO oxidation process together with ·OH.
In this catalytic process, the reaction between H2O2 as an oxidant and iron ions as a catalyst to produce highly active species (·OH and  ).35 The conversion between Fe2+ and Fe3+ was proceed according to the Haber–Weiss mechanism.
 ![[triple bond, length as m-dash]](https://www.rsc.org/images/entities/char_e002.gif) Fe(III)–OH and
Fe(III)–OH and ![[triple bond, length as m-dash]](https://www.rsc.org/images/entities/char_e002.gif) Fe(III) are reduced by H2O2 and generate
Fe(III) are reduced by H2O2 and generate ![[triple bond, length as m-dash]](https://www.rsc.org/images/entities/char_e002.gif) Fe(II)–OH and
Fe(II)–OH and ![[triple bond, length as m-dash]](https://www.rsc.org/images/entities/char_e002.gif) Fe(II) (eqn (6) and (1)), the resulting
Fe(II) (eqn (6) and (1)), the resulting ![[triple bond, length as m-dash]](https://www.rsc.org/images/entities/char_e002.gif) Fe(II)–OH and
Fe(II)–OH and ![[triple bond, length as m-dash]](https://www.rsc.org/images/entities/char_e002.gif) Fe(II) also can be oxidized by H2O2 and produce
Fe(II) also can be oxidized by H2O2 and produce ![[triple bond, length as m-dash]](https://www.rsc.org/images/entities/char_e002.gif) Fe(III)–OH and
Fe(III)–OH and ![[triple bond, length as m-dash]](https://www.rsc.org/images/entities/char_e002.gif) Fe(III) (eqn (3) and (7)).12,19,22,27,28,36
Fe(III) (eqn (3) and (7)).12,19,22,27,28,36
 | (6) |
![[triple bond, length as m-dash]](https://www.rsc.org/images/entities/char_e002.gif) Fe(II) + H2O2 → Fe(II) + H2O2 → ![[triple bond, length as m-dash]](https://www.rsc.org/images/entities/char_e002.gif) Fe(II) + ·OH + OH− Fe(II) + ·OH + OH−
| (7) |
The proposed mechanism of NO oxidation by H2O2 decomposition over α-FeOOH is presented in Fig. 5 based on the study of the products of NO oxidation and reactive oxygen species ( and ·OH) in the NO oxidation process. (1) Gaseous H2O2 decomposed into ·OH and
  on the active sites (
![[triple bond, length as m-dash]](https://www.rsc.org/images/entities/char_e002.gif) Fe(II)–OH and
Fe(II)–OH and ![[triple bond, length as m-dash]](https://www.rsc.org/images/entities/char_e002.gif) Fe(II),
Fe(II), ![[triple bond, length as m-dash]](https://www.rsc.org/images/entities/char_e002.gif) Fe(III)–OH and
Fe(III)–OH and ![[triple bond, length as m-dash]](https://www.rsc.org/images/entities/char_e002.gif) Fe(III)) of the catalyst (eqn (1)–(3), (6) and (7)) according to the Haber–Weiss mechanism, a result that was proved through EPR analysis and scavenger experiments. (2) NO was oxidised by the generated ·OH and
Fe(III)) of the catalyst (eqn (1)–(3), (6) and (7)) according to the Haber–Weiss mechanism, a result that was proved through EPR analysis and scavenger experiments. (2) NO was oxidised by the generated ·OH and  and produced NO2 and HNO3 via eqn (8) and (9). (3) The produced HNO3 reacted with ·OH and produced NO3 or NO2 (eqn (10) and (11)). (4) NO2 reacted with NO3 and produced N2O5 via eqn (12).37 The production of NO2, HNO3 and N2O5 during the NO oxidation process was proved by the FTIR spectra (Fig. 2).
| NO + 2·OH → NO2 + H2O | (8) |
 | (9) |
| HNO3 + ·OH → NO3 + H2O | (10) |
| HNO3 + ·OH → NO2 + H2O2 | (11) |
| NO2 + NO3 → N2O5 | (12) |
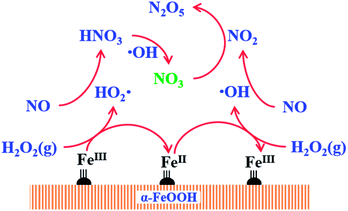 | ||
Fig. 5 Catalytic mechanism of NO oxidation by H2O2 decomposition over α-FeOOH (![[triple bond, length as m-dash]](https://www.rsc.org/images/entities/char_e002.gif) FeIII: FeIII:![[triple bond, length as m-dash]](https://www.rsc.org/images/entities/char_e002.gif) Fe(III), Fe(III), ![[triple bond, length as m-dash]](https://www.rsc.org/images/entities/char_e002.gif) Fe(III)–OH; Fe(III)–OH; ![[triple bond, length as m-dash]](https://www.rsc.org/images/entities/char_e002.gif) FeII: FeII:![[triple bond, length as m-dash]](https://www.rsc.org/images/entities/char_e002.gif) Fe(II), Fe(II), ![[triple bond, length as m-dash]](https://www.rsc.org/images/entities/char_e002.gif) Fe(II)–OH). Fe(II)–OH). | ||
In summary, α-FeOOH can be used as an efficient catalyst for coke oven flue gas to enhance NO oxidation efficiency through the catalytic decomposition of gaseous H2O2. Moreover, α-FeOOH showed high selectivity for NO oxidation in the presence of SO2. In this study, NO conversion achieved 98.8% under the following experimental conditions: H2O2/NO of 2.0, reaction temperature of 225 °C, catalyst dosage of 0.5 g and GHSV of 137![[thin space (1/6-em)]](https://www.rsc.org/images/entities/char_2009.gif) 747 h−1. The 45 h test indicated that α-FeOOH has good catalytic stability. The EPR test and radical trapping experiments revealed that
747 h−1. The 45 h test indicated that α-FeOOH has good catalytic stability. The EPR test and radical trapping experiments revealed that  as the primary reactive oxygen species was involved in the NO oxidation process together with ·OH. Furthermore, NO2, HNO3 and N2O5 were the products of NO oxidation through the catalysis of gaseous H2O2 over α-FeOOH within the temperature range of 100–200 °C, and NO2 was the only oxidation product within the temperature range of 225–350 °C.
The catalyst α-FeOOH can be used to decompose gaseous H2O2 into radicals and oxidise NO into high-valence NOx, and then the oxidation products can be absorbed together with SO2 in existing industrial-scale WFGD systems.4,5 This process can achieve the simultaneous removal of SO2 and NOx from coke oven flue gas.
Conflicts of interest
There are no conflicts of interest to declare.Acknowledgements
This work was financially supported by the NSFC (51574214) and the Young Scientists Fund of the NSFC (21706264).Notes and references
- A. J. Sweeney and Y. A. Liu, Ind. Eng. Chem. Res., 2001, 40, 2618–2627 CrossRef CAS.
- H. Yin, W. Lü, G. Sun, G. Sun and B. Hong, Fuel & Chemical Processes, 2015, 46, 1–4 Search PubMed.
- Q. Ma, Z. Wang, F. Lin, M. Kuang, R. Whiddon, Y. He and J. Liu, Energy Fuels, 2016, 30, 2302–2308 CrossRef CAS.
- Z. Meng, C. Wang, X. Wang, Y. Chen and H. Li, Energy Fuels, 2018, 32, 2028–2036 CrossRef CAS.
- Z. Meng, C. Wang, X. Wang, Y. Chen, W. Wu and H. Li, Fuel, 2019, 255, 115760 CrossRef CAS.
- J. Zhang, R. Zhang, X. Chen, M. Tong, W. Kang, S. Guo, Y. Zhou and J. Lu, Ind. Eng. Chem. Res., 2014, 53, 6450–6456 CrossRef CAS.
- S. Zhou, J. Zhou, Y. Feng and Y. Zhu, Ind. Eng. Chem. Res., 2016, 55, 5825–5831 CrossRef CAS.
- B. Wu, Y. Xiong, J. Ru and H. Feng, Korean J. Chem. Eng., 2016, 33, 3407–3416 CrossRef CAS.
- Y. Zhao, B. Yuan, R. Hao and Z. Tao, Energy Fuels, 2017, 31, 7282–7289 CrossRef CAS.
- S. Yang, Y. Xiong, Y. Ge and S. Zhang, Mater. Lett., 2018, 218, 257–261 CrossRef CAS.
- S. Yang, Y. Xiong and S. He, ChemistrySelect, 2019, 4, 8829–8836 CrossRef CAS.
- B. Wu, Y. Xiong and Y. Ge, Chem. Eng. J., 2018, 331, 343–354 CrossRef CAS.
- Y. Zhao, R. Hao, B. Yuan and J. Jiang, J. Hazard. Mater., 2016, 301, 74–83 CrossRef CAS PubMed.
- Y. Zhao, R. Hao, F. Xue and Y. Feng, J. Hazard. Mater., 2017, 321, 500–508 CrossRef CAS PubMed.
- R. Hao, X. Wang, X. Zhao, M. Xu, Y. Zhao, X. Mao, B. Yuan, Y. Zhang and K. Gao, Chem. Eng. J., 2018, 333, 583–593 CrossRef CAS.
- Y. Zhao, Y. Han, T. Ma and T. Guo, Environ. Sci. Technol., 2011, 45, 4060–4065 CrossRef CAS PubMed.
- B. Wu and Y. Xiong, J. Chem. Technol. Biotechnol., 2018, 93, 43–53 CrossRef CAS.
- K. Kou, W. Zhou, Y. Wang, H. Zhao and J. Gao, Can. J. Chem. Eng., 2019, 97, 2419–2425 CrossRef CAS.
- X. Liu, C. Wang, T. Zhu, Q. Lv, Y. Li and D. Che, Chem. Eng. J., 2019, 371, 486–499 CrossRef CAS.
- B. Yang, S. Ma, R. Cui, S. Sun, J. Wang and S. Li, Chem. Eng. J., 2019, 359, 233–243 CrossRef CAS.
- H. Jin, X. Tian, Y. Nie, Z. Zhou, C. Yang, Y. Li and L. Lu, Environ. Sci. Technol., 2017, 51, 12699–12706 CrossRef CAS PubMed.
- S. He, Y. Xiong, S. Yang and Y. Ge, Chem. Ind. Eng. Prog., 1–12, DOI:10.16085/j.issn.1000-6613.2019-0630.
- J. Böhm, Z. Anorg. Allg. Chem., 1925, 149, 203–216 CrossRef.
- A. N. Christensen, T. R. Jensen, C. R. H. Bahl and E. DiMasi, J. Solid State Chem., 2007, 180, 1431–1435 CrossRef CAS.
- G. Bbuscå and P. F. Rossi, Mater. Chem. Phys., 1983, 9, 561–570 CrossRef.
- J. Jin, Master, Zhengzhou University, 2019.
- J. Ding, Q. Zhong, S. L. Zhang, F. J. Song and Y. F. Bu, Chem. Eng. J., 2014, 243, 176–182 CrossRef CAS.
- J. Ding, Q. Zhong and S. L. Zhang, J. Mol. Catal. A: Chem., 2014, 393, 222–231 CrossRef CAS.
- C. L. Sun, N. Zhao, Z. K. Zhuang, H. Q. Wang, Y. Liu, X. L. Weng and Z. B. Wu, J. Hazard. Mater., 2014, 274, 376–383 CrossRef CAS PubMed.
- H. J. Yoon, H.-W. Park and D.-W. Park, Energy Fuels, 2016, 30, 3289–3297 CrossRef CAS.
- M. Pettersson, S. Tuominen and M. Räsänen, J. Phys. Chem. A, 1997, 101, 1166–1171 CrossRef CAS.
- S. Musić, Z. Orehovec, S. Popović and I. Czakó-Nagy, J. Mater. Sci., 1994, 29, 1991–1998 CrossRef.
- K. Kandori, T. Shigetomi and T. Ishikawa, Colloids Surf., A, 2004, 232, 19–28 CrossRef CAS.
- D. Huang, J. Li, G. Zeng, W. Xue, S. Chen, Z. Li, R. Deng, Y. Yang and M. Cheng, Chem. Eng. J., 2019, 375, 121991 CrossRef CAS.
- S. R. Pouran, A. A. A. Raman and W. M. A. W. Daud, J. Cleaner Prod., 2013, 64, 1–12 Search PubMed.
- L. Guo, Q. Zhong, J. Ding, M. Ou, Z. Lv and F. Song, Ozone: Sci. Eng., 2016, 38, 382–394 CrossRef CAS.
- Z. Wen, PhD, Zhejiang University, 2009.
Footnote |
| † Electronic supplementary information (ESI) available. See DOI: 10.1039/d0ra00533a |
| This journal is © The Royal Society of Chemistry 2020 |

