 Open Access Article
Real-time monitored photocatalytic activity and electrochemical performance of an rGO/Pt nanocomposite synthesized via a green approach†
Satish Kasturia,
Sri Ramulu Torati*a,
Yun Ji Eoma,
Syafiq Ahmada,
Byong-June Leeb,
Jong-Sung Yu b and
CheolGi Kim
 *a
*a
aDepartment of Emerging Materials Science, DGIST, Daegu-42988, Republic of Korea. E-mail: srtorati@dgist.ac.kr; cgkim@dgist.ac.kr; Fax: +82-53-785-6509; Tel: +82-53-785-6516
bDepartment of Energy Science and Engineering, DGIST, Daegu-42988, Republic of Korea
First published on 3rd April 2020
Abstract
Herein, we have reported the real-time photodegradation of methylene blue (MB), an organic pollutant, in the presence of sunlight at an ambient temperature using a platinum-decorated reduced graphene oxide (rGO/Pt) nanocomposite. The photocatalyst was prepared via a simple, one-pot and green approach with the simultaneous reduction of GO and Pt using aqueous honey as a reducing agent. Moreover, the honey not only simultaneously reduced Pt ions and GO but also played a key role in the growth and dispersion of Pt nanoparticles on the surface of rGO. Various rGO/Pt nanocomposites with different percentages of Pt nanoparticles loaded on rGO were obtained by tuning the concentration of the Pt source. The high percentage of Pt nanoparticles with an average size of 2.5 nm dispersed on rGO has shown excellent electrochemical performance. The photocatalytic activity of the rGO/Pt composite was enhanced by increasing the weight percent of the Pt particles on rGO, which led to the formation of a highly efficient photocatalyst. The optimized photocatalyst exhibited remarkable photocatalytic activity and degraded 98% MB in 180 minutes; thus, it can be used for industrial and environmental applications.
Introduction
Water pollution has become one of the major problems in the world that should be addressed immediately; water bodies are affected by large amounts of organic pollutants released from industries.1 Photodegradation is one possible way to degrade these organic pollutants using photocatalysts in the presence of a light source. Hence, there has been much interest in the photodegradation of organic pollutants to reduce pollution effects.2–5 Although several photocatalysts are available, graphene and its derivatives are used as potential materials for the treatment of industrial water owing to their excellent physical, chemical and electronic properties.6,7 Although a few reports have been proposed on rGO-based nanocomposites as effective catalysts to degrade organic dyes in water using visible light, the toxic chemicals used in the synthesis of rGO are hazardous for the environment. Hence, environmentally friendly syntheses of rGO-based nanocomposites towards the photodegradation of organic dyes are highly desirable. On the other hand, inorganic nanoparticle-based graphene nanocomposites have been emerging as a new class of hybrid materials for various applications, including harvesting solar energy, photocatalytic oxygen evolution and oxidative organic transformation, automobiles applications, electrocatalysts, electronics and biomedical applications due to their enhanced optical, electrical and chemical properties, which arise from the synergistic effect as a result of the combination of graphene and metal nanoparticles.8–16Furthermore, inorganic nanoparticles play a crucial role to prevent van der Waals interactions between graphene layers and decrease the aggregation of graphene sheets.17,18 Among all nanoparticle-based graphene nanocomposites, platinum-based nanocomposites have aroused more interest as electrocatalysts and sensor materials for electrochemical and biomedical applications.19 Hence, more efforts and new approaches for the synthesis of platinum nanoparticle-based graphene nanocomposites are highly essential. Among the various techniques available for graphene/nanoparticle nanocomposite synthesis, the chemical reduction method has been proven to be the most popular due to its reliability and scalability.20 Although this method is simple, it has some inherent limitations, such as high cost and the usage of highly toxic reagents, including hydrazine, dimethylhydrazine and NaBH4; these can generate adverse effects on the environment, which restricts the potential use of the nanocomposites in practical applications.21–24 To overcome these limitations, recently, various eco-friendly synthesis routes have been explored as a new class of methods for the synthesis of graphene or graphene-based nanocomposites. In particular, green reagents such as plant extracts, bovine serum albumin, vitamin C, and caffeic acid have been used to reduce graphene oxide (GO) to reduced graphene oxide (rGO) or graphene.21,25–28 Moreover, in our previous study, we successfully demonstrated a simple method for the preparation of rGO using honey as a reducing agent, where the presence of monosaccharide sugars such as glucose and fructose played an important role in the reduction process. Although various reports are available for the reduction of GO-based nanocomposites using green reagents, it is still a challenging task; also, in situ green synthesis methods of rGO-based nanocomposites for real applications are needed.29,30
In this work, we developed a simple, eco-friendly, inexpensive synthesis method based on the simultaneous reduction of platinum ions and GO to form rGO/Pt nanocomposites using honey as a reducing agent. Herein, honey acts as a reducing agent and also plays a crucial role in the in situ functionalization of Pt nanoparticles on the surface of rGO. The rGO/Pt nanocomposites with various ratios of Pt nanoparticles were synthesized by controlling the precursor Pt concentration. The electrochemical performance of all the rGO/Pt nanocomposites was tested to understand the conductivity and the electron transfer properties of the nanocomposites. Furthermore, the synthesized rGO/Pt nanocomposites were used as a potential catalyst for MB dye degradation, where the catalytic activity was improved by increasing the concentration of Pt nanoparticles on the rGO surface. The synthesized rGO/Pt nanocomposite could be used as an efficient photocatalyst for both research and industrial applications.
Experimental details
Materials and chemicals
Graphite powder (325 mesh, 99.9995%) was obtained from Alfa-Aesar Korea Co. Ltd. Hexachloroplatinic acid (H2PtCl6), potassium ferricyanide [K3Fe(CN)6], potassium ferrocyanide [K4Fe(CN)6] and MB were obtained from Sigma Aldrich (USA). All other analytical grade chemicals were used without any additional purification. The natural honey was purchased from a local market. The phosphate buffer saline (PBS) solution was made using Na2HPO4 and NaH2PO4 with 0.15 M NaCl and maintained at pH 7.4.Instruments
Ultraviolet-visible (UV-vis) absorption spectra were measured by a NanoDrop 2000c spectrophotometer from Thermo Fisher Scientific. Fourier-transform infrared (FT-IR) spectra were obtained on an ATR-FT-IR instrument (Continuum, Thermo Scientific, USA). The morphological and crystalline structure of the synthesized rGO/Pt was observed through transmission electron microscopy (TEM, FEI Technai F20) and X-ray powder diffraction patterns (XRD, PANalytical/Empyrean, the Netherlands), respectively. The elemental composition of the nanocomposites was measured by energy dispersive spectroscopy (EDS) coupled with TEM. Raman spectrometry and X-ray photoelectron spectroscopy (XPS) were performed on NICOLET ALMECA XR (Thermo Scientific, USA) and ESCALAB 250Xi (Thermo Scientific, USA) instruments, respectively. The electrochemical impedance spectroscopy (EIS) and cyclic voltammetry (CV) were measured using an AutoLab (EchoChemie, Netherlands) potentiostat/galvanostat.Synthesis of the rGO/Pt nanocomposite
The synthesis of GO was described elsewhere.31 The GO solution was prepared by adding 1 mg of GO to 1 mL of deionized water and maintaining the solution in an ultrasonication bath for 2 hours. The aqueous solution of honey was made by dissolving 1 g of natural honey in 10 mL deionized water followed by stirring for 15 minutes to obtain a homogeneous mixture. Then, the GO solution was thoroughly mixed with the aqueous honey solution. Next, H2PtCl6 aqueous solutions with 5%, 10%, 15% and 20% weight ratios were added to the GO/honey mixture solution and refluxed at 100 °C for 12 hours with continuous stirring. The color change of the mixture to black indicates the deoxygenation of GO as well as the growth of Pt nanoparticles on rGO. The nanocomposites of rGO/Pt were separated by centrifugation and washing with distilled water and methanol several times; finally, they were dried at 60 °C. The samples obtained from different wt% ratios of H2PtCl6, i.e. 5%, 10%, 15% and 20%, were labeled as rGO/Pt1, rGO/Pt2, rGO/Pt3 and rGO/Pt4, respectively.Electrochemical measurements
The source GO and the synthesized rGO/Pt1, rGO/Pt2, rGO/Pt3 and rGO/Pt4 nanocomposites in aqueous solutions of 10 μL (0.5 mg mL−1) were drop-casted on gold-sputtered glass electrodes (20 × 10 × 0.7 mm), followed by drying at 70 °C for 3 to 4 hours in the oven. These surface-modified gold electrodes were used as a working electrode in electrochemical measurements with a commercially available platinum sheet as a counter electrode and Ag/AgCl as a reference electrode. The depth to which the electrode was dipped into the electrolyte solution in the electrochemical cell was 10 mm; this depth was maintained accurately by adjusting the controller on the electrochemical stand as described in our previous report.32 Hence, the total active area in the electrolyte was 1 cm2. The CV and EIS measurements were conducted in 0.05 M PBS (pH 7.4) with the 5 mM redox couple of [Fe(CN)6]−3/−4.Catalytic degradation of MB using visible light
The photocatalytic activity of all rGO/Pt nanocomposites was studied by photodegradation of MB in the presence of direct sunlight as a source of light. In a typical process, 10 mg of the photocatalyst was dispersed in 50 mL of 100 ppm MB dye solution. The solution was stirred for 30 minutes at room temperature in the dark to achieve adsorption–desorption equilibrium in the dark; then, it was exposed to sunlight. An appropriate amount of aliquot from the catalytic reaction was taken to measure the dye degradation activity in 15 min time intervals starting from 0 min. The photocatalytic behavior of the samples was analyzed by UV-vis absorption spectra. Finally, after completion of the reaction, the solid material was removed by centrifugation for further analysis.Results and discussion
Synthesis and characterization of rGO/Pt nanocomposites
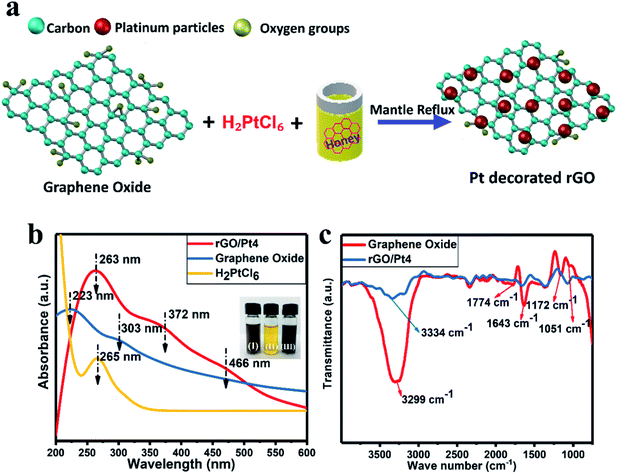
We synthesized rGO/Pt nanocomposites with different Pt source concentrations of 5, 10, 15 and 20 wt% using honey as a reducing agent, as shown in Fig. 1a. The synthesized rGO/Pt4 nanocomposite was first characterized by UV-visible spectrometry to confirm the formation of rGO/Pt from simultaneous reduction of GO and H2PtCl6. The UV-visible spectra of H2PtCl6 and the synthesized GO and rGO/Pt nanocomposite are presented in Fig. 1b. The absorption peaks of GO observed at 223 and 303 nm correspond to the π–π* and n–π* transitions of the C![[double bond, length as m-dash]](https://www.rsc.org/images/entities/char_e001.gif) C and C
C and C![[double bond, length as m-dash]](https://www.rsc.org/images/entities/char_e001.gif) O bonds, respectively.33 The absorbance peak for platinum is observed at 265 nm. The absorption spectrum for rGO/Pt4 consists of three peaks; the corresponding absorption peak of GO at 223 is shifted to 263 nm, indicating the reduction of GO to rGO. The absorption peaks observed at 372 and 466 nm indicate the formation of Pt nanoparticles from the platinum ions in the presence of honey.34 In addition, from the inset of Fig. 1b, it can be seen that upon treatment with honey for 10 hours at 100 °C, the color of the precursor solution changes from brown-yellow to black, indicating the formation of the rGO/Pt nanocomposite.
O bonds, respectively.33 The absorbance peak for platinum is observed at 265 nm. The absorption spectrum for rGO/Pt4 consists of three peaks; the corresponding absorption peak of GO at 223 is shifted to 263 nm, indicating the reduction of GO to rGO. The absorption peaks observed at 372 and 466 nm indicate the formation of Pt nanoparticles from the platinum ions in the presence of honey.34 In addition, from the inset of Fig. 1b, it can be seen that upon treatment with honey for 10 hours at 100 °C, the color of the precursor solution changes from brown-yellow to black, indicating the formation of the rGO/Pt nanocomposite.
The formation of the rGO/Pt nanocomposite was further confirmed by FT-IR analysis (Fig. 1c). In the case of GO, the peaks obtained at 3299, 1774, 1643, 1051, and 1172 cm−1 correspond to O–H, C![[double bond, length as m-dash]](https://www.rsc.org/images/entities/char_e001.gif) O, C
O, C![[double bond, length as m-dash]](https://www.rsc.org/images/entities/char_e001.gif) C, and C–O epoxy stretching and O–H bending vibrations, respectively.30,35 This indicates that the GO sample contained abundant oxygenated functional groups. However, the intensities of the oxygenated functional groups decreased for the rGO/Pt nanocomposite, as can be seen from the FT-IR spectrum. Particularly, the broad peak at 3334 cm−1 corresponding to the hydroxyl functional group shows a decrease in intensity, indicating the reduction of GO by aqueous honey.21
C, and C–O epoxy stretching and O–H bending vibrations, respectively.30,35 This indicates that the GO sample contained abundant oxygenated functional groups. However, the intensities of the oxygenated functional groups decreased for the rGO/Pt nanocomposite, as can be seen from the FT-IR spectrum. Particularly, the broad peak at 3334 cm−1 corresponding to the hydroxyl functional group shows a decrease in intensity, indicating the reduction of GO by aqueous honey.21
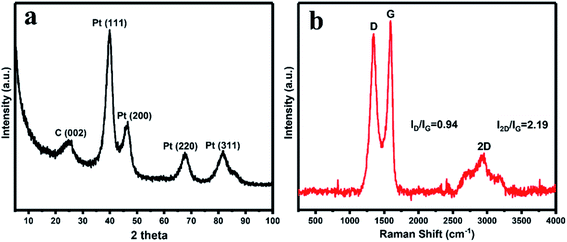
The crystalline structure of the synthesized rGO/Pt4 nanocomposite was observed through XRD patterns. Fig. 2a displays the XRD patterns of the rGO/Pt4 nanocomposite. The appearance of a diffraction peak at 2θ = 24.5 corresponding to the (002) index plane with an interlayer distance of 0.36 nm and the disappearance of the peak at 2θ = 10.4 indicate the successful reduction of GO. The characteristic peaks at 40 (111), 46.54 (200), 67.0 (220), and 81.46 (311) are related to Pt with the face-centered cubic structure, respectively, confirming the formation of rGO/Pt nanocomposite.36
The formation of the rGO/Pt nanocomposites was further justified by Raman analysis (Fig. 2b). The nature of the C–C bonds and defects was studied by observing the variation in the Raman band intensities of rGO/Pt. rGO/Pt shows two distinct peaks related to the D and G bands at 1345 and 1587 cm−1, respectively. The G band is due to the E2g mode of C sp2 atoms and the D band arises from a breathing κ-point phonon with A1g symmetry.37 The calculated ID/IG ratio is 0.94 for rGO/Pt4, which is greater than that of the source material GO (ID/IG = 0.86); this indicates that after the formation of rGO/Pt nanocomposite from GO, the average size of the sp2 carbon domain is reduced while the structural defects are increased.30,38 The increase in structural defects due to the decoration of Pt nanoparticles on the surface of rGO may be the reason for the increase in the ratio of ID/IG. The 2D band for rGO/Pt4 is observed at 2940 cm−1. The intensity ratio of the G and 2D band is associated with the number of layers in rGO/Pt. The broad 2D band with I2D/IG = 2.19 of rGO/Pt4 indicates the multilayer structure of rGO.39,40
The morphological structure of the rGO/Pt nanocomposite was studied by TEM, which indicated the dispersion of Pt nanoparticles on the rGO (Fig. 3a). The high-resolution TEM image confirmed the good dispersion and decoration of Pt nanoparticles on the surface of rGO (Fig. 3b). The selected area electron diffraction pattern (SAED) of the rGO/Pt nanocomposite is shown in the inset of Fig. 3b; it exhibits various diffractions, representing the good crystallinity of the rGO/Pt nanocomposite. The calculated average size of Pt nanoparticles dispersed on the rGO is 2.5 nm (Fig. 3c). The elemental composition of rGO/Pt was analysed by EDS (Fig. 3d). The presence of an elemental peak for Pt in the EDS spectrum confirms the formation of Pt nanoparticles. The presence of an oxygen peak in the EDS spectrum indicates the incomplete reduction of GO, which further confirms the formation of rGO instead of graphene. The elemental mapping analysis of rGO/Pt is shown in Fig. 3e–i, where the carbon, oxygen, and Pt elements are present in the rGO/Pt4 nanocomposite. Furthermore, by changing the platinum source concentration from 5% to 20% weight, the distribution of Pt nanoparticles on the surface of rGO varies, as shown in Fig. 3b and 4. The rGO/Pt4 nanocomposite shows the presence of a high percentage of Pt nanoparticles compared to rGO/Pt1, rGO/Pt2 and rGO/Pt3 (Fig. 4a–f).
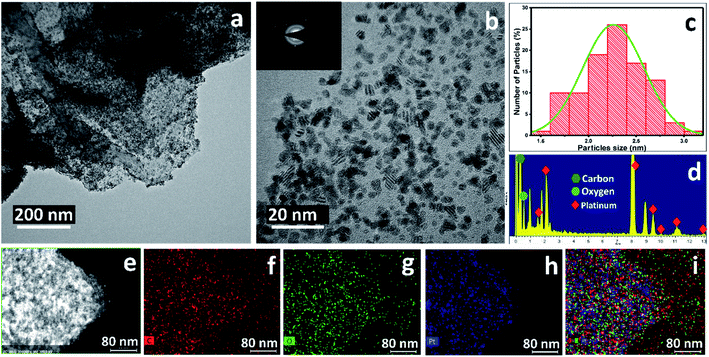 | ||
| Fig. 3 TEM images of the rGO/Pt4 nanocomposite with (a) low resolution and (b) high resolution; the insets of Fig. 4b represent the selected area electron diffraction patterns. (c) Size distribution of the Pt nanoparticles; (d) EDS spectra of the rGO/Pt4 nanocomposite. Elemental mapping analysis of the rGO/Pt4 nanocomposite: (e) the analyzed TEM image, (f) map of the C concentration, (g) map of the O concentration, (h) map of the Pt concentration, (i) merged image. | ||
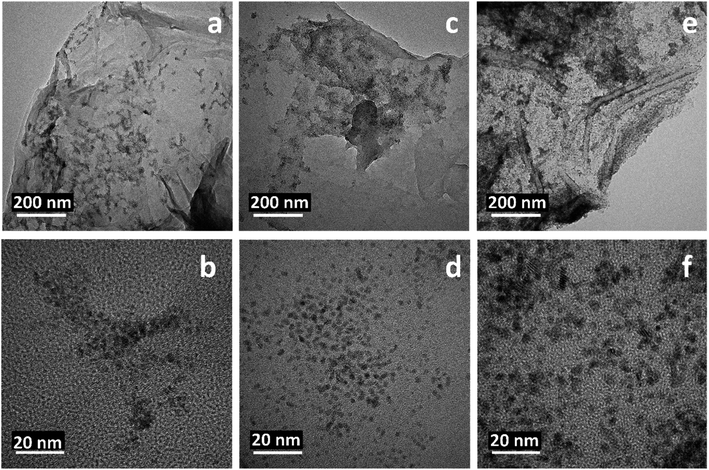 | ||
| Fig. 4 TEM images of the rGO/Pt1, rGO/Pt2, and rGO/Pt3 nanocomposites with (a, c and e) low resolution and (b, d and f) high resolution, respectively. | ||
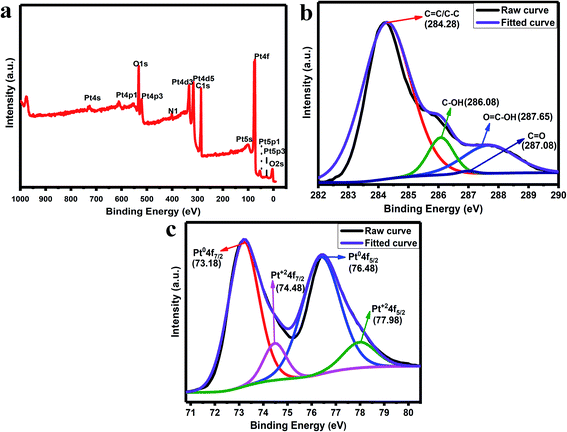
The XPS analysis is used to study the presence of elements in the synthesized rGO/Pt4 nanocomposite. Fig. 5a shows the total survey spectrum for the rGO/Pt4 nanocomposite. The spectrum confirms the presence of all the elements, namely C, O, and Pt, in agreement with the EDS analysis. The C 1s spectra of the rGO/Pt4 sample were deconvoluted into various peaks which can be indexed to different binding states of carbon. Fig. 5b shows the C 1s XPS spectrum of rGO/Pt4; the characteristic peaks at 284.28, 286.08, 287.08, and 287.65 eV can be ascribed to graphitic C![[double bond, length as m-dash]](https://www.rsc.org/images/entities/char_e001.gif) C/C–C, C–OH/C–O, C
C/C–C, C–OH/C–O, C![[double bond, length as m-dash]](https://www.rsc.org/images/entities/char_e001.gif) O, and COO, respectively, indicating the presence of a few epoxide, hydroxyl, and carboxyl groups.30 However, the C 1s peak intensity related to C–O–H and C–O–C decreased, suggesting the removal of most of the abovementioned functional groups from GO.30 The Pt 4f spectrum of the rGO/Pt4 nanocomposite shows two doublets that correspond to Pt0 and Pt2+ moieties (Fig. 5c). The Pt 4f spectra consist of a pair of intense doublets at binding energies of 73.18 and 76.48 eV with a spin–orbit splitting of 3.3 eV, corresponding to Pt 4f7/2 and Pt 4f5/2, respectively; these can be attributed to metallic Pt (Pt0), confirming the formation of Pt nanoparticles.41 Another pair of less intense peaks with binding energies at 74.48 and 77.98 eV assigned to Pt 4f7/2 and Pt 4f5/2, respectively, can be ascribed to Pt2+.36,41 The presence of Pt2+ obtained during the nucleation and growth process of Pt on the surface of rGO containing oxygen groups leads to Pt–O–C bond formation.36,42
O, and COO, respectively, indicating the presence of a few epoxide, hydroxyl, and carboxyl groups.30 However, the C 1s peak intensity related to C–O–H and C–O–C decreased, suggesting the removal of most of the abovementioned functional groups from GO.30 The Pt 4f spectrum of the rGO/Pt4 nanocomposite shows two doublets that correspond to Pt0 and Pt2+ moieties (Fig. 5c). The Pt 4f spectra consist of a pair of intense doublets at binding energies of 73.18 and 76.48 eV with a spin–orbit splitting of 3.3 eV, corresponding to Pt 4f7/2 and Pt 4f5/2, respectively; these can be attributed to metallic Pt (Pt0), confirming the formation of Pt nanoparticles.41 Another pair of less intense peaks with binding energies at 74.48 and 77.98 eV assigned to Pt 4f7/2 and Pt 4f5/2, respectively, can be ascribed to Pt2+.36,41 The presence of Pt2+ obtained during the nucleation and growth process of Pt on the surface of rGO containing oxygen groups leads to Pt–O–C bond formation.36,42
Electrochemical analysis
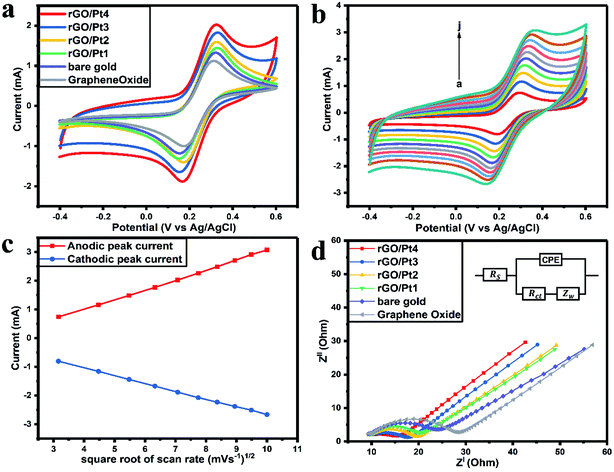
The CVs of bare gold, GO, rGO/Pt1, rGO/Pt2, rGO/Pt3, and rGO/Pt4 electrodes were measured from −0.4 to 0.6 V with a scan rate of 50 mV s−1 (Fig. 6a). The anodic peak current (Ia) of GO (1.14 mA) is smaller than that of the bare gold electrode (1.31 mA) because of the presence of oxygen functional groups in GO (Fig. 6a).21 The observed Ia values for the rGO/Pt1, rGO/Pt2, rGO/Pt3 and rGO/Pt4-modified gold electrodes are 1.44, 1.58, 1.82 and 2.02 mA, respectively. The increase in Ia for the nanocomposites is due to the incorporation of Pt metal nanoparticles on the surface of rGO, which may increase the surface area of the nanocomposites. Furthermore, with increasing concentration of Pt nanoparticles on the surface of rGO, there is an increase in Ia, as can be seen from rGO/Pt1 to rGO/Pt4.The electrochemical response of the rGO/Pt4 modified gold electrode with a scan rate from 10 to 100 mV s−1 is presented in Fig. 6b. There is a shift of the cathodic peak potential towards the negative direction and a shift of the anodic peak potential towards a positive direction with increasing scan rate. Also, the magnitudes of Ia and Ic (cathodic peak current) increase linearly with the square root of the scan rate, as shown in Fig. 6c; this represents typical diffusion-controlled electrochemical behavior of the electrode32 and obeys eqn (1) and (2):
| Ia(mA)rGO/Pt4 = −3.80 × 10⁻⁴ (sqrt of scan rate in mV s−1) + 3.43 × 10⁻⁴ (R2 = 0.9991) | (1) |
| Ic(mA)rGO/Pt4 = 4.86 × 10⁻⁵ (sqrt of scan rate in mV s−1) − 2.71 × 10⁻⁴ (R2 = 0.9997) | (2) |
Furthermore, EIS was employed to study the electrochemical conductivity of the modified electrodes. The impedance spectra were measured by sweeping the frequency (f) in the range from 0.1 mHz to 10 kHz with an amplitude of 10 mV. The measured Nyquist plots for the GO, bare gold, rGO/Pt1, rGO/Pt2, rGO/Pt3, and rGO/Pt4 electrodes are presented in Fig. 6d. The inset of Fig. 6d shows the Randles equivalent circuit, which represents the resistance of the bulk electrolyte (Rs), charge transfer resistance (Rct), Warburg impedance (Zw) and constant phase element (CPE). Considering the surface roughness of the electrode due to the coating of rGO/Pt nanocomposite, CPE was used to explain the double layer capacitance instead of pure capacitance.43 The magnitude of Rct can be obtained from the Nyquist plot by calculating the diameter of the semicircles in the plot.32 The Rct value of the bare electrode is 14.88 Ω; meanwhile, the Rct is increased for the GO electrode (18.79 Ω) due to the poor conductivity of GO, which obstructs the charge transfer between the electrode and electrolyte. However, the Rct values for the rGO/Pt1, rGO/Pt2, rGO/Pt3, and rGO/Pt4-modified electrodes are 10.95, 10.28, 8.31 and 5.81 Ω, respectively; this indicates that increasing the concentration of Pt nanoparticles on the rGO surface increases the conductivity of the nanocomposite. Overall, rGO/Pt4 shows excellent electrochemical performance; thus, it can be used as an electrode material for various electrochemical biosensors and electrocatalyst applications.
Photocatalytic degradation of methylene blue
The photocatalytic activity of the rGO/Pt nanocomposites was estimated by photodegradation of MB in real time under irradiation of sunlight with an irradiation intensity of 3.75 kW h m−2.44 The experiment was carried out without stirring the sample, which is crucial for large scale on-site applications. The photodegradation of MB was observed by UV-visible spectroscopy with intervals of 15 min. The catalytic activities (i.e. degradation efficiencies) were calculated using the given formula:2
 | (3) |
As shown in Fig. 7a and S1,† the photodegradation using rGO/Pt samples showed a systematic decrease in the absorption peak of MB with respect to increasing irradiation time. The photocatalytic activity results illustrate the photodegradation of our best performing photocatalyst, rGO/Pt4, which degrades 98% of MB in 180 min, whereas without any catalyst, the irradiation of MB with sunlight showed no degradation ability (Fig. S1d†). Also, there was no significant degradation of MB in the dark with the catalyst rGO/Pt4 (Fig. S1e†). The degradation activity varied with the different Pt weight percentages decorated on the rGO samples, as shown in Fig. S1a–c.† Here, the samples rGO/Pt1, rGO/Pt2, and rGO/Pt3 exhibit 89.7%, 91.95 and 95.99% photo-degradation, respectively, in 180 minutes, whereas rGO/Pt4 shows 98% degradation in 180 minutes. Furthermore, the photodegradation of MB using rGO as a catalyst shows 70.2% photodegradation efficiency in 180 minutes, which indicates that the photodegradation ability of rGO significantly increased after the addition of Pt metal (Fig. S1f†). To clearly understand the degradation ability with respect to the weight percentage of Pt nanoparticles loaded on rGO, XPS analysis was performed, and the results are shown in Table S1 and Fig. S2.† As can be seen, the best catalyst, rGO/Pt4, has the highest Pt content (5.73 atomic wt%) among the rGO/Pt samples. The Pt metal plays a very important role in mediating the interfacial electron transfer in rGO composites for high degradation efficiency; however, further increase of Pt content on rGO may show the adverse effects of the resulting charge separation due to the abundant electrons generated from excess Pt metal.45 Therefore, we believe that the most suitable Pt content added to rGO in our photocatalytic system is between l.61 to 5.73 atomic wt%.
All the photocatalytic tests were performed in natural sunlight without stirring the reaction mixture; therefore, we believe that our catalytic system shows extremely satisfactory efficiency. Fig. 7b shows the kinetics of photocatalytic degradation of MB with respect to the time of irradiation, where C denotes the MB absorption at each interval of the irradiation time and Co denotes the initial concentration (when time t = 0) of MB absorption. The higher photodegradation effect of rGO/Pt4 can be ascribed to the uniform distribution of Pt nanoparticles on rGO, which provides a higher number of active sites with a higher specific surface area than the other rGO/Pt samples (Fig. 3b and Table S2†).
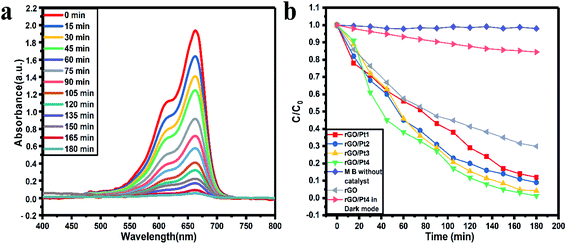 | ||
| Fig. 7 Photocatalytic (a) degradation of MB in the presence of rGO/Pt4 nanocomposite and (b) kinetics of the rGO/Pt nanocomposites and control experiments. | ||
According to the pseudo-first-order reaction, the rates of the catalytic reaction (k) for all the samples were calculated as shown in Fig. 8a by the equation given below:2
| kt = −ln(C/C0) | (4) |
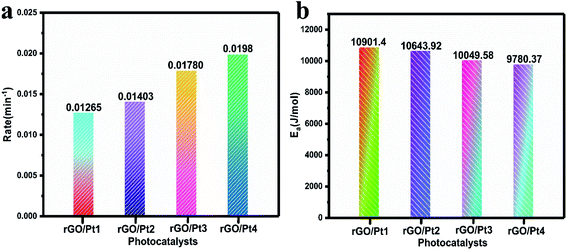 | ||
| Fig. 8 (a) The rates of photodegradation and (b) activation energies for the degradation of MB by different rGO/Pt catalysts under irradiation of direct sunlight. | ||
The activation energy (Ea) for the MB degradation was calculated using the following equation:2
log![[thin space (1/6-em)]](https://www.rsc.org/images/entities/char_2009.gif) k = −Ea/2.303RT k = −Ea/2.303RT
| (5) |
Comparisons of the efficiencies of photodegradation, k, and of the Ea values of the photocatalysts is shown in Table 1. Here, rGO/Pt4 shows the highest k among all the samples, indicating its superior catalytic activity. The estimated Ea for the reaction to understand the kinetics of the catalytic process is shown in Fig. 8b. As expected, the rGO/Pt4 sample requires a lower activation energy compared to the other samples and delivered high catalytic activity. A comparative study of rGO and its derivatives, synthesized by various reducing agents, towards the degradation of organic dyes is presented in Table 2. The synthesized rGO/Pt nanocomposites show excellent degradation ability of 98% compared to previous reports.46–52
| Parameter | rGO/Pt1 | rGO/Pt2 | rGO/Pt3 | rGO/Pt4 |
|---|---|---|---|---|
| (η%) efficiency | 89.7 | 91.95 | 95.99 | 98.0 |
| k (min−1) | 0.01265 | 0.01403 | 0.01780 | 0.0198 |
| Ea | 10![[thin space (1/6-em)]](https://www.rsc.org/images/entities/char_2009.gif) 901.4 901.4 |
10![[thin space (1/6-em)]](https://www.rsc.org/images/entities/char_2009.gif) 643.92 643.92 |
10![[thin space (1/6-em)]](https://www.rsc.org/images/entities/char_2009.gif) 049.58 049.58 |
9780.37 |
| S. N. | Reported material | Reducing agent used | Organic dye | Dye conc. | Degradation% of dye | Reference |
|---|---|---|---|---|---|---|
| 1 | Ag–graphene nanocomposite | Sodium acetate | Methylene blue | 10 ppm | 65 | 46 |
| 2 | Chemically reduced graphene oxide | Concentrated ammonia solution (37 wt%) | Methylene blue | 31.5 μM | 84.5 | 47 |
| 3 | Reduced graphene oxide | Grape extract | Malachite green | 5 ppm | 90 | 48 |
| 4 | SnO2 quantum dots (QDs)-decorated rGO | A hybrid complex [(N2H4)m(SnCl4)] | Methylene blue | 10 ppm | 94 | 49 |
| 5 | Graphene oxide (RGO)/Fe3O4 nanocomposite | Solanum trilobatum extract | Methylene blue | 93.7 μM | 95.18 | 50 |
| 6 | (CRG–Ag) nanocomposite | Custard apple leaf extract | Methylene blue | 5 ppm | 96 | 51 |
| 7 | TiO2/rGO/polymer composite | Tetrabutyl titanate | Rhodamine B | 8 ppm | 96 | 52 |
| 8 | rGO/Pt nanocomposite | Natural honey | Methylene blue | 100 ppm | 98 | Present work |
Photodegradation mechanism
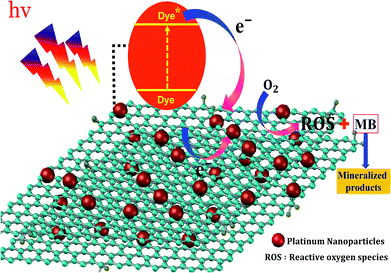
In the photocatalytic process, the mechanism starts with the formation of powerful reactive oxidizing species, including superoxide radical , hydroxyl radical (OH˙) and hydrogen peroxide radicals; these are generated by the photocatalytic reduction of oxygen and oxidation of water and can initiate the photodegradation of MB dye.46,53–55 The mechanism of the photodegradation process is shown in Fig. 9, which provides a mechanistic frame of the electron transfer of the photoinduced charge separation and its migration. When the sunlight irradiates rGO/Pt, the dye* itself acts as a sensitizer and the excited electrons are inserted into the rGO surface; the dye* becomes dye˙*, which then starts to be degraded by the adsorbed O2.56–58 Subsequently, the inserted electrons transfer to the Pt nanoparticles from the rGO surface, which separates the dye˙* and electrons and therefore hinders the recombination procedure. Furthermore, rGO possesses excellent charge carrier mobility and can maintain the improved charge transfer and separation of photogenerated electrons; thus, rGO is a good electron acceptor and transporter in the photocatalytic system of the composite.56 Due to the transfer of electrons from rGO to the Pt nanoparticles, a decrease in the accumulation of electrons on the rGO surface could obviously increase the continuous transfer of electrons from the dye* to rGO. Also, the dye can be oxidized by free hydroxyl radicals (OH˙) formed in solution due to the irradiation of sunlight.59 In addition, many powerful reactive oxidizing species (ROS) can be formed due to the trapping of electrons from the Pt nanoparticles by surface-adsorbed O2; this indicates that the Pt nanoparticles act as an electron mediator for charge separation, and the photodegradation efficiency is therefore greatly improved.58–61 Overall, among all the nanocomposites, rGO/Pt4 shows high photocatalytic degradation efficiency and thus can be used as an efficient catalyst for practical applications.
Conclusions
In summary, a facile green-mediated method has been developed for the synthesis of rGO/Pt nanocomposites using aqueous honey as a reducing agent at a temperature of 100 °C. Here, the reduction of GO to rGO and the growth and functionalization of Pt nanoparticles on rGO occurred simultaneously, indicating the dual role of honey as a reducing agent and as an anchoring agent for the growth of Pt nanoparticles on rGO. TEM analysis confirmed the decoration and good distribution of Pt nanoparticles with an average size of 2.5 nm on the surface of rGO. The rGO/Pt4 nanocomposite shows good electron transfer properties, with higher current and conductivity than the other samples; thus, this composite can be useful for electrochemical applications. The rGO/Pt nanocomposite with a high concentration of Pt dispersed on rGO shows high catalytic efficiency. Hence, the synthesized rGO/Pt nanocomposite shows excellent electrochemical properties and remarkable catalytic activity; it can be used not only as an efficient photocatalyst for industrial applications but can also be used as an electrode material for electrochemical applications. Hence, the developed low cost photocatalysis technology can be used as an advanced technology for versatile energy conversion systems.62–64 Furthermore, the proposed eco-friendly, facile approach can be extended to synthesize various metal/metal oxide-based rGO nanocomposites.Conflicts of interest
There are no conflicts to declare.Acknowledgements
This research was supported by a National Research Foundation of Korea (NRF) grant funded by the Korea government (MSIT) (2018R1A5A1025511).References
- X. Lin, Y. Ni and S. Kokot, Anal. Chim. Acta, 2015, 867, 29–37 CrossRef CAS PubMed.
- C. B. Hiragond, P. K. Khanna and P. V More, Vacuum, 2018, 155, 159–168 CrossRef CAS.
- C. B. Hiragond, A. S. Kshirsagar and D. P. Khanna, J. Nanomed. Res., 2018, 7, 254–257 Search PubMed.
- V. Srinivasan, C. B. Hiragond, P. K. Khanna and P. V More, ChemistrySelect, 2018, 3, 8491–8500 CrossRef CAS.
- P. K. Khanna, A. Kumar, A. Kshirsagar and C. Hiragond, J. Nanosci. Nanotechnol., 2018, 18, 143–155 CrossRef CAS PubMed.
- K. Ullah, S. Ye, L. Zhu, Z.-D. Meng, S. Sarkar and W.-C. Oh, J. Mater. Sci. Eng. B, 2014, 180, 20–26 CrossRef CAS.
- Z. Xiong, L. L. Zhang, J. Ma and X. S. Zhao, Chem. Commun., 2010, 46, 6099–6101 RSC.
- Y.-C. Pu, H.-Y. Chou, W.-S. Kuo, K.-H. Wei and Y.-J. Hsu, Appl. Catal., B, 2017, 204, 21–32 CrossRef CAS.
- K.-A. Tsai and Y.-J. Hsu, Appl. Catal., B, 2015, 164, 271–278 CrossRef CAS.
- Y.-C. Chen, K. Katsumata, Y.-H. Chiu, K. Okada, N. Matsushita and Y.-J. Hsu, Appl. Catal., A, 2015, 490, 1–9 CrossRef CAS.
- H. Wang, L.-F. Cui, Y. Yang, H. Sanchez Casalongue, J. T. Robinson, Y. Liang, Y. Cui and H. Dai, J. Am. Chem. Soc., 2010, 132, 13978–13980 CrossRef CAS PubMed.
- C. J. Murphy, T. K. Sau, A. M. Gole, C. J. Orendorff, J. Gao, L. Gou, S. E. Hunyadi and T. Li, 2005.
- K. A. Willets and R. P. Van Duyne, Annu. Rev. Phys. Chem., 2007, 58, 267–297 CrossRef CAS PubMed.
- C. B. Murray, a C. R. Kagan and M. G. Bawendi, Annu. Rev. Mater. Sci., 2000, 30, 545–610 CrossRef CAS.
- S. E. Skrabalak, J. Chen, Y. Sun, X. Lu, L. Au, C. M. Cobley and Y. Xia, Acc. Chem. Res., 2008, 41, 1587–1595 CrossRef CAS PubMed.
- L. Au, D. Zheng, F. Zhou, Z.-Y. Li, X. Li and Y. Xia, ACS Nano, 2008, 2, 1645–1652 CrossRef CAS PubMed.
- A. H. Al-Marri, M. Khan, M. R. Shaik, N. Mohri, S. F. Adil, M. Kuniyil, H. Z. Alkhathlan, A. Al-Warthan, W. Tremel and M. N. Tahir, Arabian J. Chem., 2016, 9, 835–845 CrossRef CAS.
- M. Tang, X. Wang, F. Wu, Y. Liu, S. Zhang, X. Pang, X. Li and H. Qiu, Carbon, 2014, 71, 238–248 CrossRef CAS.
- A. K. Ateş, E. Er, H. Çelikkan and N. Erk, New J. Chem., 2017, 41, 15320–15326 RSC.
- X. Gao, J. Li, D. Guan and C. Yuan, ACS Appl. Mater. Interfaces, 2014, 6, 4154–4159 CrossRef CAS PubMed.
- G. Bhattacharya, S. Sas, S. Wadhwa, A. Mathur, J. McLaughlin and S. S. Roy, RSC Adv., 2017, 7, 26680–26688 RSC.
- C. K. Chua and M. Pumera, Chem. Commun., 2016, 52, 72–75 RSC.
- S. Park, J. An, J. R. Potts, A. Velamakanni, S. Murali and R. S. Ruoff, Carbon, 2011, 49, 3019–3023 CrossRef CAS.
- Z. Yang, Q. Zheng, H. Qiu, L. I. Jing and J. Yang, N. Carbon Mater., 2015, 30, 41–47 CrossRef CAS.
- X. Jin, N. Li, X. Weng, C. Li and Z. Chen, Chemosphere, 2018, 208, 417–424 CrossRef CAS PubMed.
- J. Liu, S. Fu, B. Yuan, Y. Li and Z. Deng, J. Am. Chem. Soc., 2010, 132, 7279–7281 CrossRef CAS PubMed.
- J. Zhang, H. Yang, G. Shen, P. Cheng, J. Zhang and S. Guo, Chem. Commun., 2010, 46, 1112–1114 RSC.
- C. Zhu, S. Guo, Y. Fang and S. Dong, ACS Nano, 2010, 4, 2429–2437 CrossRef CAS PubMed.
- Z. Bo, X. Shuai, S. Mao, H. Yang, J. Qian, J. Chen, J. Yan and K. Cen, Sci. Rep., 2014, 4, 4684 CrossRef PubMed.
- V. Reddy, K. K. C. S. Babu, S. R. Torati, Y. J. Eom, T. Q. Trung, N.-E. Lee and C. Kim, J. Ind. Eng. Chem., 2018, 63, 19–26 CrossRef CAS.
- D. C. Marcano, D. V Kosynkin, J. M. Berlin, A. Sinitskii, Z. Sun, A. Slesarev, L. B. Alemany, W. Lu and J. M. Tour, ACS Nano, 2010, 4, 4806–4814 CrossRef CAS PubMed.
- S. R. Torati, K. C. S. B. Kasturi, B. Lim and C. Kim, Sens. Actuators, B, 2017, 243, 64–71 CrossRef CAS.
- T. T. Dang, V. H. Pham, S. H. Hur, E. J. Kim, B.-S. Kong and J. S. Chung, J. Colloid Interface Sci., 2012, 376, 91–96 CrossRef CAS PubMed.
- H. Cheng, C. Xi, X. Meng, Y. Hao, Y. Yu and F. Zhao, J. Colloid Interface Sci., 2009, 336, 675–678 CrossRef CAS PubMed.
- Y. Xu, J. Li and W. Huang, Materials, 2017, 10, 936 CrossRef PubMed.
- Z. Liu, X. Duan, H. Cheng, J. Zhou, X. Zhou and W. Yuan, Carbon, 2015, 89, 93–101 CrossRef CAS.
- K.-C. Hsu and D.-H. Chen, Nanoscale Res. Lett., 2014, 9, 484 CrossRef PubMed.
- A. Shaikh, S. Parida and S. Böhm, RSC Adv., 2016, 6, 100383–100391 RSC.
- Y. Zhang, Z. Shao, Q. Shen, M. Li, L. Xu and Z. Luo, Catalysts, 2018, 8, 519 CrossRef.
- T. Maiyalagan, X. Dong, P. Chen and X. Wang, J. Mater. Chem., 2012, 22, 5286–5290 RSC.
- S. H. Patil, B. Anothumakkool, S. D. Sathaye and K. R. Patil, Phys. Chem. Chem. Phys., 2015, 17, 26101–26110 RSC.
- P. Kundu, C. Nethravathi, P. A. Deshpande, M. Rajamathi, G. Madras and N. Ravishankar, Chem. Mater., 2011, 23, 2772–2780 CrossRef CAS.
- T. S. Ramulu, R. Venu, B. Sinha, B. Lim, S. J. Jeon, S. S. Yoon and C. G. Kim, Biosens. Bioelectron., 2013, 40, 258–264 CrossRef CAS PubMed.
- M. H. Alsharif and J. Kim, Sustainability, 2016, 8, 942 CrossRef.
- Y.-C. Chen, Y.-C. Pu and Y.-J. Hsu, J. Phys. Chem. C, 2012, 116, 2967–2975 CrossRef CAS.
- M. E. Khan, M. M. Khan and M. H. Cho, New J. Chem., 2015, 39, 8121–8129 RSC.
- H. Sun, S. Liu, G. Zhou, H. M. Ang, M. O. Tadé and S. Wang, ACS Appl. Mater. Interfaces, 2012, 4, 5466–5471 CrossRef CAS PubMed.
- R. K. Upadhyay, N. Soin, G. Bhattacharya, S. Saha, A. Barman and S. S. Roy, Mater. Lett., 2015, 160, 355–358 CrossRef CAS.
- D. Dutta, S. Thiyagarajan and D. Bahadur, Chem. Eng. J., 2016, 297, 55–65 CrossRef CAS.
- M. Vinothkannan, C. Karthikeyan, A. R. Kim and D. J. Yoo, Spectrochim. Acta, Part A, 2015, 136, 256–264 CrossRef CAS PubMed.
- B. Chandu, C. M. Kurmarayuni, S. Kurapati and H. B. Bollikolla, Carbon Lett., 2020, 30, 225–233 Search PubMed.
- R. Fang, Y. Liang, X. Ge, M. Du, S. Li, T. Li and Z. Li, Colloid Polym. Sci., 2015, 293, 1151–1157 CrossRef CAS.
- X. Lü, J. Shen, J. Wang, Z. Cui and J. Xie, RSC Adv., 2015, 5, 15993–15999 RSC.
- R. Rajesh, S. S. Kumar and R. Venkatesan, New J. Chem., 2014, 38, 1551–1558 RSC.
- M. M. Khan, S. A. Ansari, J.-H. Lee, M. O. Ansari, J. Lee and M. H. Cho, J. Colloid Interface Sci., 2014, 431, 255–263 CrossRef CAS PubMed.
- J. Zhang, Z. Xiong and X. S. Zhao, J. Mater. Chem., 2011, 21, 3634–3640 RSC.
- D. Zhao, C. Chen, Y. Wang, W. Ma, J. Zhao, T. Rajh and L. Zang, Environ. Sci. Technol., 2008, 42, 308–314 CrossRef CAS PubMed.
- R. D. Martínez-Orozco, H. C. Rosu, S.-W. Lee and V. Rodríguez-González, J. Hazard. Mater., 2013, 263, 52–60 CrossRef PubMed.
- I. V Lightcap, S. Murphy, T. Schumer, P. V Kamat and J. Phys, Chem. Lett., 2012, 3, 1453–1458 Search PubMed.
- T. Wu, G. Liu, J. Zhao, H. Hidaka and N. Serpone, J. Phys. Chem. B, 1998, 102, 5845–5851 CrossRef CAS.
- Y. Haldorai, B.-K. Kim, Y.-L. Jo and J.-J. Shim, Mater. Chem. Phys., 2014, 143, 1452–1461 CrossRef CAS.
- Y.-H. Chiu, T.-F. M. Chang, C.-Y. Chen, M. Sone and Y.-J. Hsu, Catalysts, 2019, 9, 430 CrossRef CAS.
- Y.-H. Chiu, T.-H. Lai, M.-Y. Kuo, P.-Y. Hsieh and Y.-J. Hsu, APL Mater., 2019, 7, 80901 CrossRef.
- M.-J. Fang, C.-W. Tsao and Y.-J. Hsu, J. Phys. D. Appl. Phys., 2020, 53, 143001 CrossRef.
Footnote |
| † Electronic supplementary information (ESI) available. See DOI: 10.1039/d0ra00541j |
| This journal is © The Royal Society of Chemistry 2020 |

