 Open Access Article
Microwave assisted green synthesis of Fe2O3/biochar for ultrasonic removal of nonsteroidal anti-inflammatory pharmaceuticals
Zakaria Anfar ab,
Mohamed Zbair
 *c,
Hassan Ait Ahsiane
 *de,
Amane Jadab and
Noureddine El Alema
aLaboratoire Matériaux et Environnement LME, Faculté des Sciences, Université Ibn Zohr, BP 8106, Cité Dakhla, Agadir, Morocco
bInstitute of Materials Science of Mulhouse, Haute Alsace University, Mulhouse, 68100, France
cLaboratoire de Catalyse et Corrosion des Matériaux, Faculté des Sciences El Jadida, Université Chouaïb Doukkali, BP 20, El Jadida 24000, Morocco
dChemical and Biochemical Sciences, Mohammed VI Polytechnic University, Lot 660-Hay Moulay Rachid, Ben Guerir, Morocco. E-mail: hassan.aitahsaine@um6p.ma
eLaboratoire de Chimie Appliqueé des Matériaux, Centre des Sciences des Matériaux Science Center, Faculty of Sciences, Mohammed V University, Rabat, Morocco
First published on 20th March 2020
Abstract
Iron oxide/biochar (Fe2O3/biochar) was prepared by green synthesis via a microwave to evaluate ultrasound-assisted adsorption capacity of Nonsteroidal Anti-inflammatory Drugs (NSAIDs) (salicylic acid, naproxen, and ketoprofen) from the water. Several techniques of characterization, including, Fourier transform infrared spectrometry, scanning electron microscopy, EDS analysis, N2 adsorption–desorption, X-ray diffraction, and Raman spectrometry were applied. The adsorption of NSAIDs onto Fe2O3/biochar was performed using an ultrasonic bath. The effects of batch adsorption under various experimental parameters such as contact time (0–120 min), initial concentration (10–500 mg L−1) and pH (2–12) were tested. The obtained Fe2O3/biochar specific surface area, mesopore volume/micropore volume, and pores size were equal to 786 m2 g−1, 0.409 cm3 g−1, and 1.534 cm3 g−1, respectively. The pseudo-second-order model could describe better all NSAID adsorptions onto Fe2O3/biochar. The Langmuir model agreed well with the NSAID adsorptions and the maximum adsorption capacities reached 683 mg g−1, 533 mg g−1 and 444 mg g−1 for salicylic acid, naproxen, and ketoprofen, respectively. Fe2O3/biochar can be used as an excellent adsorbent for the treatment of NSAIDs in water.
1 Introduction
Currently, it is becoming more obvious that pharmaceutical drugs constitute a gathering of new organic emerging pollutants, which are ceaselessly brought into the water because of their broad medical utilization and ineffective expulsion in wastewater treatment plants (WWTPs).1 Several studies stated that pharmaceutical compounds and their metabolites are generally identified in wastewater, sewage, surface water, groundwater and even drinking water with a concentration range from nano-gram per liter (ng L−1) to microgram per liter (μg L−1).2Among these, indomethacin, ibuprofen, ketoprofen, naproxen, diclofenac, and ketoprofen, categorized as non-steroidal anti-inflammatory drugs (NSAIDs), share certain analgesic and antipyretic properties and, due to their high annual consumption, present important research concern worldwide.1,3 The presence of these compounds (NSAIDs) has been detected in surface and drinking water concentrations going from <0.1 ng L−1 to few hundreds of ng L−1.4–6 Hence, it is not easy for the conventional water treatment plants to totally eliminate NSAIDs from water.7
Accordingly, some alternative approaches have already been explored for the removal or degradation of NSAIDs,8 as well as adsorption, electrochemical oxidation, photo-degradation, ultrasonic irradiation, and advanced oxidation process.9–17 However, adsorption has been found to be the most appropriate technology due to its low-cost, exactitude, feasibility, the simplicity, and safety of the treatment process.18–25 Moreover, a number of adsorbents such as functionalized carbon nanotubes (FCN), graphene, polystyrene-divinylbenzene resin, activated carbon, and etc. have been employed to remove the pharmaceutical drugs from water.9,26–28
Besides, searching for new proficient, simple and cheap method to control NSAIDs is also of huge interest. Currently, biochar-based materials have been widely studied in the environmental remediation because of its intrinsic characteristics:29,30
• Biochar is cheap, non-toxic and easy to obtain,
• Biochar has inherent high specific surface areas, large pore volumes, allowing the chance of physisorption and hydrophobic interaction and electrostatic adsorption with contaminants proficiently.
• Biochar can be modified and have an increasing quantity of oxygen functional groups on the surface, which permitting the possibility of particular binding (e.g., hydrogen bonding, π–π electron-donor–acceptor interactions and also covalent binding) for toxins efficiently.
Henceforth, to improve the adsorption effect of biochar, the modification was necessary to improve its surface properties.
Recently, several paper were published about the modification of biochar surface such as: ZnO,31 WO3,32 Mg/Al,33 Ni/Mn,33 Mg/Fe,33 amino groups (polyethylenimine),34 oxygen functional groups (β-cyclodextrin–chitosan)35 and etc. The outcomes of these published paper suggest that functionalization of biochar might intensely develop its adsorption ability. Additionally, these studies point out that the surface and physicochemical properties of biochar can be simply modified with functional groups or incorporated with zinc and/or iron, exhibiting improved physical or chemical properties for the removal of harmful contaminants.
Henceforth, the aim of this research was to (i) synthesis and characterize iron oxide/biochar, (ii) study the removal efficiency of NSAIDs (salicylic acid, naproxen, and ketoprofen) and investigate the impacts of some key parameters, namely pH, concentration and contact time on the adsorption capacity using ultrasonic bath.
2 Methods and materials
2.1. Materials
The walnut shell (WS) was collected from the southwestern of Morocco (Taroudant city). The walnut shell (WS) was washed with tap water and distilled water. The washed walnut shell (WS) was oven dried at 60 °C for 12 h. The iron precursor was ferric chloride (FeCl3·6H2O) and was purchased from Merck Millipore. Salicylic acid (SA), naproxen (Nap), and ketoprofen (Keto) were acquired from Sigma-Aldrich. Moreover, pH values of the solutions were controlled with HCl (Merck Millipore) and NaOH (Merck Millipore) solutions. All chemicals were used as received and all solutions were prepared with distilled water. The synthesis was performed in a Teflon autoclave using microwave radiation (Delonghi EMD MW 311 adjustable power < 800 W, 230 V, 50 Hz).2.2. Synthesis of Fe2O3/biochar
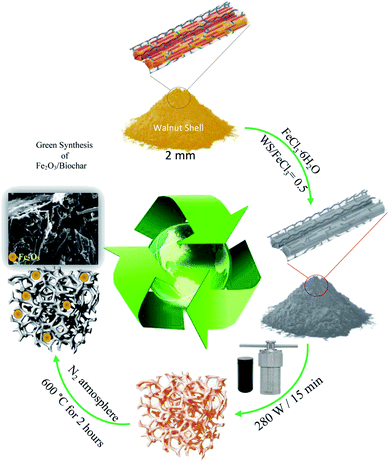
Firstly, walnut shell (WS) was mixed with 50 mL of FeCl3·6H2O (WS/FeCl3 = 0.5) and put into Teflon autoclave. Then, the mixture was heated for 15 min under microwave radiation 280 W. The obtained material was loaded in a quartz reactor and pyrolyzed under an N2 atmosphere (50 mL min−1) at 600 °C for 2 hours. Finally, the sample was rinsed with distilled water and dried at 105 °C. The obtained sample was labeled Fe2O3/biochar. Scheme 1 illustrates the synthesis route of the labeled iron oxide/biochar composite.2.3. Batch adsorption experiments
The adsorption of SA, Nap, and Keto onto Fe2O3/biochar were performed using an ultrasonic bath. About, 20 mg of Fe2O3/biochar was added into 100 mL of the SA, Nap, and Keto with known concentration under various experimental parameters such as contact time (0–120 min), initial concentration (10–500 mg L−1) and pH (2–12). All adsorption experiments were conducted using an ultrasonic bath with the heating system (PS-30A, Ultrasonic Cleaner) at 40 kHz of frequency and 180 W of power. After a suitable time, a portion of the samples was collected from the beakers and filtered. The concentration of SA, Nap, and Keto were determined using a UV-vis spectrophotometer (Shimadzu, 84000S) at an absorbance wavelength of 294.4, 262, and 277 nm, respectively. Table 1 highlights the mathematical models using in this work to fit the data.| Equations | Utility | Description | Ref. |
|---|---|---|---|
 |
Adsorption capacity | C0 (mg L−1) and Ce,t (mg L−1) are the initial and equilibrium concentrations, respectively. m (g) is the weight of adsorbent and V (L) is the volume of adsorbate | 36 |
 |
Removal efficiency | 37 | |
| Qt = Qcal(1 − expK1t) | Pseudo-first-order | Qe and Qt are the adsorbed adsorbate amounts at equilibrium and at times t, respectively. K1: the rate constant; K2: rate constant | 38 |
 |
Pseudo-second-order | 39 | |
 |
Intraparticle diffusion | Kip (mg g−1 min−1/2): rate coefficient; C: thickness of the boundary layer | 40 |
 |
Langmuir isotherm | KL: direct measure of the intensity of the adsorption process; Qm: maximum adsorption capacity | 41 |
 |
Freundlich isotherm | KF: adsorption capacity; n: intensity of adsorption; 1/n = 0 irreversible; 1/n > 1 unfavorable 0 < 1/n < 1 favorable | 42 |
2.4. Regeneration
The renewability and reusability and of Fe2O3/biochar, regeneration experiments were carried out by washing the Fe2O3/biochar after adsorption with ethanol for 4 hours of stirring. Then, sonicated for 15 min, and finally filtered, washed with distilled water and then dried at 110 °C. Five cycles of adsorption-regeneration studies were carried out accordingly.2.5. Characterization
Raman spectroscopy was used to characterize Fe2O3/biochar using a spectrometer NRS-5100 model Jasco Raman spectrometer and a CCD detector, laser line of 532 nm and objective lens 100×, with a laser power of 1.6 mW. Surface area (SBET) of Fe2O3/biochar after and before adsorption of toxic pollutants was measured using an AUTOSORB-1 and pore size analyzer at 77 K. The Fourier transform infrared spectra of Fe2O3/biochar was obtained in the mid-infrared region (400–4000 cm−1) using a Shimadzu 4800S. The spectra were scanned at a resolution of 2.0 cm−1 and with 30 scanning. Scanning electron microscopy (SEM) of Fe2O3/biochar was analyzed using FEI, Quanta 200-ESEM operated at 20 kV.3 Results and discussions
3.1. Characterization
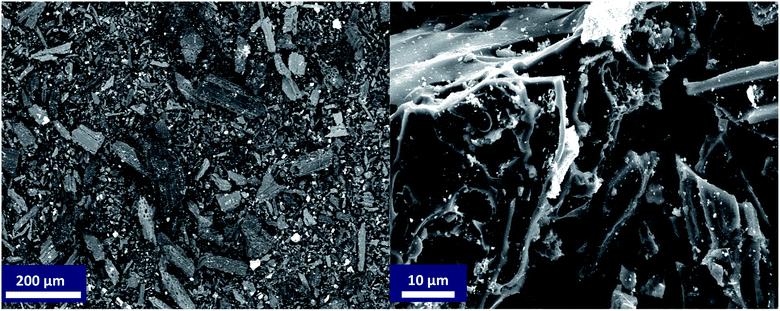
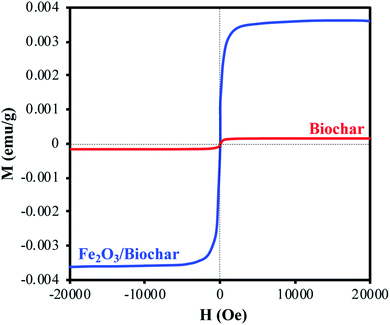
N2-physisorption isotherm of Fe2O3/biochar exhibit type IV with a hysteresis loop according to IUPAC classification.43 The calculated textural parameters: specific surface area (SBET), mesopores volume, micropores volume, and pores size were equal to 786 m2 g−1, 0.409 cm3 g−1, 1.534 cm3 g−1, and 4.6 nm (Fig. 1a). Fig. 1b presents the FTIR spectra of Fe2O3/biochar. Fe2O3/biochar spectra show a broad peak at 3374 cm−1 ascribed to –OH groups. Furthermore, the peak at 1589 cm−1 recognize to vibration of C![[double bond, length as m-dash]](https://www.rsc.org/images/entities/char_e001.gif) C and at 1059 cm−1 is corresponding C–O vibration.44 Finally, the peak centered at 611 cm−1 is assigned to Fe–O vibrations. The same results were reported in the literature for the synthesis of magnetic Fe/AC nanocomposites.45 The Raman spectrum of Fe2O3/biochar is shown in Fig. 1c. For Fe2O3/biochar, the peak located at 666 cm−1 is assigned to the A1g modes of Fe.46 Moreover, the G peak at 1606 cm−1 is related to E2g graphite mode and D-line at ∼1324 cm−1 is induced by defective structures.47 Fig. 1d displays XRD patterns of Fe2O3/biochar. The diffraction pattern of Fe2O3/biochar confirms that iron oxide present in biochar is corresponding with the standard γ-Fe structure (JCPDS no. 39-1346). Moreover, the formation of γ-Fe2O3 phase was also confirmed by Raman analysis (Fig. 1d). Fig. 2 display the SEM micrographs of prepared Fe2O3/biochar. The particle of Fe can be clearly seen on the surface, this confirmed the successful impregnation. As well, the heterogeneous and porous surface was clearly observed which developed after pyrolysis. The EDS analysis (Table 2) indicate the presence of three main atoms: carbon (68.75%), oxygen (23.37%), and Fe (7.23%). EDS analysis of Fe2O3/biochar showed many other chemicals elements as Al, P, S and Ca. The magnetic properties of prepared composite were analyzed at room temperature by using MPMS-XL-7A. Magnetic hysteresis loop show that the saturation magnetic moment was equal 0.0036 emu g−1 (Fig. 3). This small saturation magnetic moment was attributed to the mass of biochar in magnetic nanocomposites, which does not contribute to the magnetic moment as which was consistent with the published results.48
C and at 1059 cm−1 is corresponding C–O vibration.44 Finally, the peak centered at 611 cm−1 is assigned to Fe–O vibrations. The same results were reported in the literature for the synthesis of magnetic Fe/AC nanocomposites.45 The Raman spectrum of Fe2O3/biochar is shown in Fig. 1c. For Fe2O3/biochar, the peak located at 666 cm−1 is assigned to the A1g modes of Fe.46 Moreover, the G peak at 1606 cm−1 is related to E2g graphite mode and D-line at ∼1324 cm−1 is induced by defective structures.47 Fig. 1d displays XRD patterns of Fe2O3/biochar. The diffraction pattern of Fe2O3/biochar confirms that iron oxide present in biochar is corresponding with the standard γ-Fe structure (JCPDS no. 39-1346). Moreover, the formation of γ-Fe2O3 phase was also confirmed by Raman analysis (Fig. 1d). Fig. 2 display the SEM micrographs of prepared Fe2O3/biochar. The particle of Fe can be clearly seen on the surface, this confirmed the successful impregnation. As well, the heterogeneous and porous surface was clearly observed which developed after pyrolysis. The EDS analysis (Table 2) indicate the presence of three main atoms: carbon (68.75%), oxygen (23.37%), and Fe (7.23%). EDS analysis of Fe2O3/biochar showed many other chemicals elements as Al, P, S and Ca. The magnetic properties of prepared composite were analyzed at room temperature by using MPMS-XL-7A. Magnetic hysteresis loop show that the saturation magnetic moment was equal 0.0036 emu g−1 (Fig. 3). This small saturation magnetic moment was attributed to the mass of biochar in magnetic nanocomposites, which does not contribute to the magnetic moment as which was consistent with the published results.48
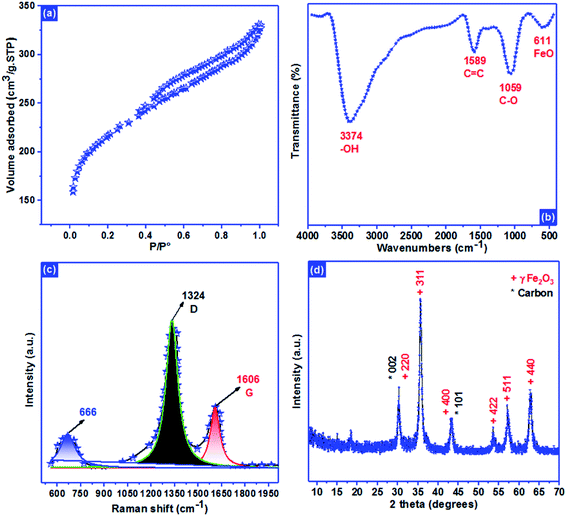 | ||
| Fig. 1 (a) N2 adsorption–desorption, (b) Fourier transform infrared spectrometry, (c) Raman spectrometry and (d) X-ray diffraction. | ||
| Element | Line s. | Mass (%) | Mass norm. (%) | Atom (%) |
|---|---|---|---|---|
| C | K-serie | 74.63 | 50.77 | 68.75 |
| O | K-serie | 33.79 | 22.99 | 23.37 |
| Al | K-serie | 0.12 | 0.08 | 0.05 |
| P | K-serie | 0.03 | 0.02 | 0.01 |
| S | K-serie | 0.88 | 0.60 | 0.31 |
| Ca | K-serie | 1.07 | 0.73 | 0.29 |
| Fe | K-serie | 36.48 | 24.82 | 7.23 |
| 147.00 | 100.00 | 100.00 |
3.2. Adsorption performance
| Total acidity (meq. g−1) | Total basicity (meq. g−1) | |
|---|---|---|
| Biochar/Fe2O3 | 4.13 | 4.76 |
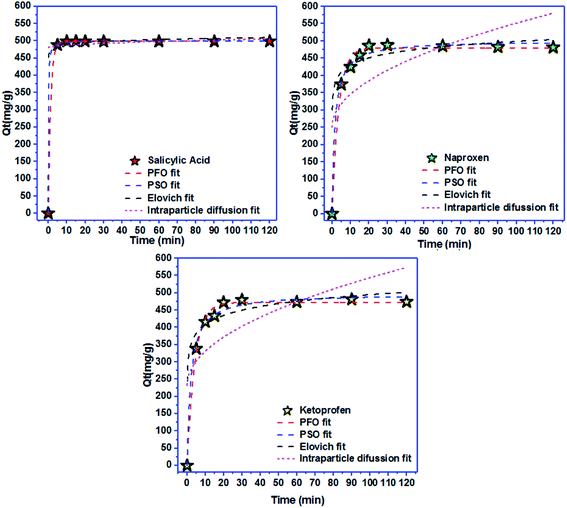 | ||
| Fig. 5 Effect of contact time and adsorption kinetics for salicylic acid, naproxen, and ketoprofen removal. | ||
| Pseudo-first-order model | Pseudo-second-order model | ||||||
|---|---|---|---|---|---|---|---|
| Qe,exp (mg g−1) | Qe,cal (mg g−1) | K1 (min−1) | R2 | Qe,cal (mg g−1) | K2 (g mg−1 min−1) | R2 | |
| Salicylic acid | 498.97 | 498.92 | 0.76 | 1.000 | 500.73 | 0.018 | 0.998 |
| Naproxen | 481.38 | 479.80 | 0.27 | 0.994 | 500.69 | 0.001 | 0.991 |
| Ketoprofen | 473.13 | 472.26 | 0.23 | 0.994 | 497.47 | 0.001 | 0.992 |
| Elovich model | Intra-particle diffusion model | |||||
|---|---|---|---|---|---|---|
| α (mg g−1 min−1) | B (g mg−1) | R2 | Kip | C | R2 | |
| Salicylic acid | 4.47 | 0.12 | 0.978 | 2.39 | 480.24 | 0.097 |
| Naproxen | 6.42 | 0.03 | 0.979 | 30.12 | 250.37 | 0.455 |
| Ketoprofen | 2.13 | 0.03 | 0.972 | 31.10 | 232.69 | 0.499 |
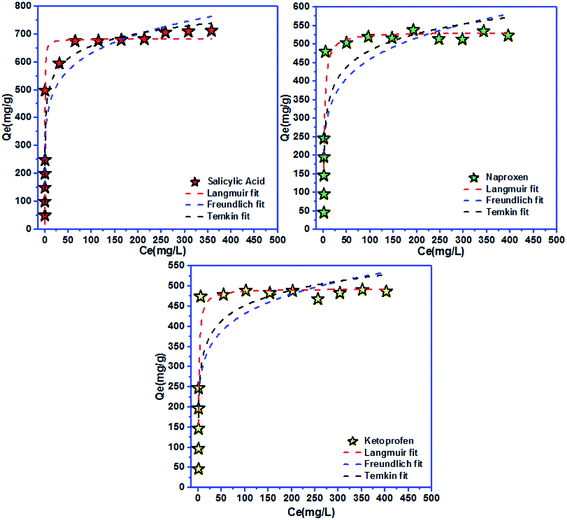 | ||
| Fig. 6 Langmuir, Freundlich, and Temkin models for salicylic acid, naproxen, and ketoprofen removal at equilibrium. | ||
| Langmuir isotherm | Freundlich isotherm | ||||||
|---|---|---|---|---|---|---|---|
| Qmax (mg g−1) | KL (L mg−1) | RL | R2 | KF ((mg g−1)/(mg L−1)n) | n | R2 | |
| Salicylic acid | 683 | 3.44 | 0.006 | 0.977 | 318.83 | 6.73 | 0.900 |
| Naproxen | 533 | 0.50 | 0.004 | 0.912 | 210 | 5.88 | 0.766 |
| Ketoprofen | 494 | 0.71 | 0.003 | 0.914 | 212 | 6.49 | 0.754 |
| Temkin isotherm | |||
|---|---|---|---|
| BT (J mol−1) | KT (L g−1) | R2 | |
| Salicylic acid | 0.015 | 268.59 | 0.945 |
| Naproxen | 0.015 | 18.24 | 0.823 |
| Ketoprofen | 0.018 | 37.04 | 0.796 |
| Adsorbent | Qmax (mg g−1) | Reference | |
|---|---|---|---|
| Salicylic acid | Fe2O3/biochar | 683 | This work |
| Barley straw biochar | 210 | 54 | |
| Cross-linked resin | 396 | 59 | |
| Douglas fir biochar | 108 | 60 | |
| Naproxen | Fe2O3/biochar | 533 | This work |
| ED-MIL-101 | 154 | 50 | |
| MIL-101-(OH)3 | 156 | 61 | |
| Oxidized activated carbon | 80 | 51 | |
| Activated carbon | 39 | 51 | |
| Ketoprofen | Fe2O3/biochar | 494 | This work |
| Activated carbon | 25 | 62 | |
| MIL-101-(OH)3 | 80 | 61 | |
| Graphene oxide | 63 | 63 | |
| MIL-101(Cr)/CS | 156 | 52 |
3.3. Renewability, mechanism and thermodynamic behavior
Renewability is an important factor to evaluate the adsorbent pollutants adsorption.64,65 The Fe2O3/biochar regenerated was investigated using ethanol for 4 hours of stirring. The sorption regeneration was repeated 5 times for SA, Nap, and Keto molecules (Fig. 7a). After 5 cycles, the performance sorption decreased from:65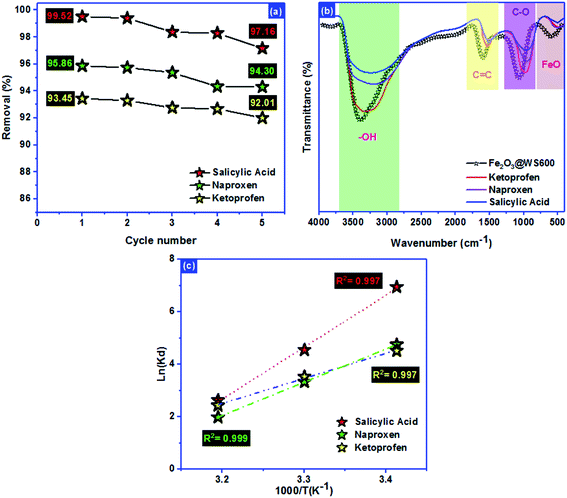 | ||
| Fig. 7 (a) Renewability, (b) mechanism and (c) thermodynamic behavior of salicylic acid, naproxen, and ketoprofen adsorption. | ||
99.52% → 97.16%, 95.86% → 94.30% and 93.45% → 92.01% for SA, Nap, and Keto molecules, respectively. The sorption regeneration test revealed that the Fe2O3/biochar could be effectively used as a promising adsorbent for SA, Nap, and Keto nonsteroidal molecules adsorption from aqueous solutions.
The ultrasound-assisted adsorption mechanism of NSAIDs (salicylic acid, naproxen, and ketoprofen) onto Fe2O3/biochar was investigated using FTIR after adsorption (Fig. 7b). The fixation of anti-inflammatory pharmaceuticals pollutants molecules inside the adsorbent pores was not only the determined step of process adsorption. FTIR analysis after adsorption shows that the peaks of –OH groups, carbon–carbon bond with sp2 hybridization, C–O vibration, and Fe–O vibrations were shifted from the original position. These results confirm that the mechanism of adsorption referred to the formation of hydrogen bonding, the π–π interaction between, an electrostatic attraction with C–O groups and the interaction between Keto molecules and Fe impregnated on the biochar surface.
Thermodynamic parameters offer extra deep information about the inherent energetic changes involved during adsorption. To evaluate the thermodynamic parameters, the adsorption isotherms of SA, Nap, and Keto on Fe2O3/biochar surfaces were measured at 293 K, 303 K and 313 K and changes in thermodynamic parameters of the standard Gibbs free energy of adsorption ΔG°, the standard enthalpy ΔH° and the standard entropy ΔS° were calculated using Van't Hoff and Gibbs free energy equations presented in Table 7. The R2 value is higher than 0.99, indicating that the SA, Nap, and Keto adsorption data fitted well the Van't Hoff equation (Fig. 7c).
| ΔH (J mol−1) | ΔS (J mol−1 K−1) | ΔG (kJ mol−1) | |||
|---|---|---|---|---|---|
| 293 K | 303 K | 313 K | |||
| Salicylic acid | −164.51 | −504.22 | −16.91 | −10.88 | −6.84 |
| Naproxen | −105.50 | −320.56 | −11.57 | −8.37 | −5.16 |
| Ketoprofen | −79.51 | −233.58 | −11.00 | −8.88 | −6.31 |
The negative ΔH° (SA: −164.51 J mol−1; Nap: −105.50 J mol−1; Keto: −79.51 J mol−1) affirmed the exothermic nature of SA, Nap, and Keto adsorption on Fe2O3/biochar (Table 7). The negative ΔS° (SA: −504.22 J mol−1; Nap: −320.56 J mol−1; Keto: −233.58 J mol−1) revealed the decreases randomness solid/liquid interface during adsorption process (Table 7). If the heat value of adsorption process ranges from 40 kJ mol−1 to 800 kJ mol−1, the adsorption process is typically chemisorption, while the values less than 40 kJ mol−1 denote to a physisorption process.20 In this study, the heat of SA, Nap, and Keto adsorption on Fe2O3/biochar were less than 40 kJ mol−1, which indicate that the process was predominantly a physical adsorption. The Gibbs free energy change ΔG° reveals the possibility of the adsorption process of SA, Nap, and Keto on Fe2O3/biochar. The ΔG° values were negative at all temperatures, proving that the adsorption of SA, Nap, and Keto was spontaneous and thermodynamically favorable.
4 Conclusion
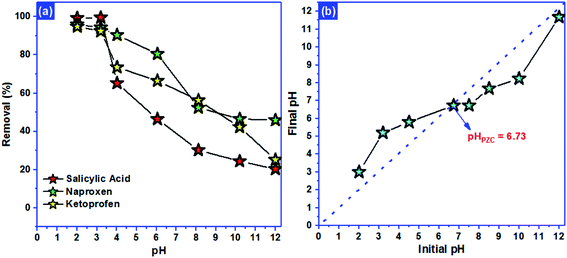
The present study evaluated the ultrasound-assisted adsorption capacity of salicylic acid, naproxen and ketoprofen (SA, Nap, and Keto) onto Fe2O3/biochar prepared by green synthesis via microwave. The results revealed that the sorption was dependent on different functional parameters such as pH, temperature, contact time and concentration. The characteristics of prepared material predicted several functional groups on the surfaces and shows very interesting textural and morphological properties. Results show that the removal of SA, Nap, and Keto were higher in the acidic medium than in the basic medium. The adsorption kinetics and isotherms were well fitted to the pseudo-second-order model and Langmuir for all adsorbates. The maximum adsorption capacities reached 683, 533 and 444 mg g−1 for SA, Nap, and Keto, respectively. The thermodynamic study from the experimental model showed that all ΔG°, ΔH° and ΔS° parameters values are negative, indicating that the adsorption was exothermic, spontaneous and thermodynamically favorable. The thermodynamic study showed that the heat was less than 40 kJ mol−1, which indicate that the process was predominantly a physical adsorption, involving hydrogen bond type interaction, the π–π interaction and electrostatic attraction with surface functional groups. Fe2O3/biochar could potentially be applied as an efficient adsorbent for the removal of SA, Nap, and Keto from aqueous solutions.Conflicts of interest
The authors declare that they do not have any conflict of interest.References
- K. Fent, A. A. Weston and D. Caminada, Aquat. Toxicol., 2006, 76, 122–159 CrossRef CAS PubMed.
- T. Heberer, Toxicol. Lett., 2002, 131, 5–17 CrossRef CAS PubMed.
- D. F. Martin, J. M. Martin and T. A. Ward, J. Environ. Sci. Health, Part A: Toxic/Hazard. Subst. Environ. Eng., 2016, 51, 186–191 CrossRef CAS PubMed.
- T. Kosjek, E. Heath and A. Krbavčič, Environ. Int., 2005, 31, 679–685 CrossRef CAS PubMed.
- A. Togola and H. Budzinski, J. Chromatogr. A, 2008, 1177, 150–158 CrossRef CAS PubMed.
- M. D. Hernando, E. Heath, M. Petrovic and D. Barceló, Anal. Bioanal. Chem., 2006, 385, 985–991 CrossRef CAS PubMed.
- D. Zhang, R. M. Gersberg, W. J. Ng and S. K. Tan, Environ. Pollut., 2014, 184, 620–639 CrossRef CAS PubMed.
- H. F. D. Almeida, I. M. Marrucho and M. G. Freire, ACS Sustainable Chem. Eng., 2017, 5, 2428–2436 CrossRef CAS PubMed.
- V. Rakić, V. Rac, M. Krmar, O. Otman and A. Auroux, J. Hazard. Mater., 2015, 282, 141–149 CrossRef PubMed.
- Y. Zhou, X. Liu, Y. Xiang, P. Wang, J. Zhang, F. Zhang, J. Wei, L. Luo, M. Lei and L. Tang, Bioresour. Technol., 2017, 245, 266–273 CrossRef CAS PubMed.
- Y. Zhou, X. Liu, L. Tang, F. Zhang, G. Zeng, X. Peng, L. Luo, Y. Deng, Y. Pang and J. Zhang, J. Hazard. Mater., 2017, 333, 80–87 CrossRef CAS PubMed.
- S. E. Evans, P. Davies, A. Lubben and B. Kasprzyk-Hordern, Anal. Chim. Acta, 2015, 882, 112–126 CrossRef CAS PubMed.
- F. Sopaj, M. A. Rodrigo, N. Oturan, F. I. Podvorica, J. Pinson and M. A. Oturan, Chem. Eng. J., 2015, 262, 286–294 CrossRef CAS.
- X. Liu, D. Yang, Y. Zhou, J. Zhang, L. Luo, S. Meng, S. Chen, M. Tan, Z. Li and L. Tang, Chemosphere, 2017, 182, 306–315 CrossRef CAS PubMed.
- D. Russo, A. Siciliano, M. Guida, E. Galdiero, A. Amoresano, R. Andreozzi, N. M. Reis, G. Li Puma and R. Marotta, Water Res., 2017, 122, 591–602 CrossRef CAS PubMed.
- F. Méndez-Arriaga, R. A. Torres-Palma, C. Pétrier, S. Esplugas, J. Gimenez and C. Pulgarin, Water Res., 2008, 42, 4243–4248 CrossRef PubMed.
- E. Isarain-Chávez, R. M. Rodríguez, P. L. Cabot, F. Centellas, C. Arias, J. A. Garrido and E. Brillas, Water Res., 2011, 45, 4119–4130 CrossRef PubMed.
- S. A. Baig, T. Sheng, C. Sun, X. Xue, L. Tan and X. Xu, PLoS One, 2014, 9, e100704 CrossRef PubMed.
- G. Zelmanov and R. Semiat, Desalination, 2014, 333, 107–117 CrossRef CAS.
- M. Zbair, K. Ainassaari, A. Drif, S. Ojala, M. Bottlinger, M. Pirilä, R. L. Keiski, M. Bensitel and R. Brahmi, Environ. Sci. Pollut. Res., 2018, 25, 1869–1882 CrossRef CAS PubMed.
- I. Anastopoulos, A. Bhatnagar, B. Hameed, Y. S. Ok and M. Omirou, A review on waste-derived adsorbents from sugar industry for pollutant removal in water and wastewater, J. Mol. Liq., 2017, 240, 179–188 CrossRef CAS.
- M. Zbair, Z. Anfar, H. Khallok and H. A. Ahsaine, Fullerenes, Nanotubes, Carbon Nanostruct., 2018, 26, 433–442 CrossRef CAS.
- Z. Anfar, A. Amedlous, A. Ait El Fakir, H. Ait Ahsaine, M. Zbair, S. Lhanafi, R. El Haouti, A. Jada and N. El Alem, ACS Omega, 2019, 4, 9434–9445 CrossRef CAS PubMed.
- Z. Anfar, M. Zbair, H. A. Ahsaine, Y. Abdellaoui, A. A. El Fakir, E. H. Amaterz, A. Jada and N. El Alem, ChemistrySelect, 2019, 4, 4981–4994 CrossRef CAS.
- Z. Anfar, H. Ait Ahsaine, M. Zbair, A. Amedlous, A. Ait El Fakir, A. Jada and N. El Alem, Crit. Rev. Environ. Sci. Technol., 2019, 1–42 Search PubMed.
- H. Li, D. Zhang, X. Han and B. Xing, Chemosphere, 2014, 95, 150–155 CrossRef CAS PubMed.
- B. Huang, Y. Liu, B. Li, S. Liu, G. Zeng, Z. Zeng, X. Wang, Q. Ning, B. Zheng and C. Yang, Carbohydr. Polym., 2017, 157, 576–585 CrossRef CAS PubMed.
- C. Ling, X. Li, Z. Zhang, F. Liu, Y. Deng, X. Zhang, A. Li, L. He and B. Xing, Environ. Sci. Technol., 2016, 50, 10015–10023 CrossRef CAS PubMed.
- D. Mohan, A. Sarswat, Y. S. Ok and C. U. Pittman, Bioresour. Technol., 2014, 160, 191–202 CrossRef CAS PubMed.
- B. Wang, Y. Jiang, F. Li and D. Yang, Bioresour. Technol., 2017, 233, 159–165 CrossRef CAS PubMed.
- C. Gan, Y. Liu, X. Tan, S. Wang, G. Zeng, B. Zheng, T. Li, Z. Jiang and W. Liu, RSC Adv., 2015, 5, 35107–35115 RSC.
- H. A. Ahsaine, M. Zbair and R. El Haouti, Desalin. Water Treat., 2017, 85, 330–338 CrossRef.
- X. Tan, S. Liu, Y. Liu, Y. Gu, G. Zeng, X. Cai, Z. Yan, C. Yang, X. Hu and B. Chen, Sci. Rep., 2016, 6, 39691 CrossRef PubMed.
- Y. Ma, W.-J. Liu, N. Zhang, Y.-S. Li, H. Jiang and G.-P. Sheng, Bioresour. Technol., 2014, 169, 403–408 CrossRef CAS PubMed.
- X. Huang, Y. Liu, S. Liu, X. Tan, Y. Ding, G. Zeng, Y. Zhou, M. Zhang, S. Wang and B. Zheng, RSC Adv., 2016, 6, 94–104 RSC.
- J. Wang, C. P. Huang, H. E. Allen, D. K. Cha and D. W. Kim, J. Colloid Interface Sci., 1998, 208, 518–528 CrossRef CAS PubMed.
- V. K. Garg, R. Gupta, A. B. Yadav and R. Kumar, Bioresour. Technol., 2003, 89, 121–124 CrossRef CAS PubMed.
- B. K. S. Lagergren, Z. Chem. Ind. Kolloide, 1898, 24, 15 Search PubMed.
- G. McKay, Process Biochem., 1999, 34, 451 CrossRef.
- W. J. Weber and J. C. Morris, J. Sanit. Eng. Div. Proc. Am. Soc. Civ. Eng., 1963, 89, 31–60 Search PubMed.
- I. Langmuir, J. Am. Chem. Soc., 1916, 38, 2221–2295 CrossRef CAS.
- H. Freundlich, Z. Phys. Chem., 1907, 57U(1), 385–470 Search PubMed.
- M. Thommes, K. Kaneko, A. V. Neimark, J. P. Olivier, F. Rodriguez-Reinoso, J. Rouquerol and K. S. W. Sing, Pure Appl. Chem., 2015, 87, 1051–1069 CAS.
- M. Zbair, Z. Anfar, H. Ait Ahsaine, N. El Alem and M. Ezahri, J. Environ. Manage., 2018, 206, 383–397 CrossRef CAS PubMed.
- R.-S. Juang, Y.-C. Yei, C.-S. Liao, K.-S. Lin, H.-C. Lu, S.-F. Wang and A.-C. Sun, J. Taiwan Inst. Chem. Eng., 2018, 90, 51–60 CrossRef CAS.
- A. M. Jubb and H. C. Allen, ACS Appl. Mater. Interfaces, 2010, 2, 2804–2812 CrossRef CAS.
- H. Ait Ahsaine, M. Zbair, Z. Anfar, Y. Naciri, R. El haouti, N. El Alem and M. Ezahri, Mater. Today Chem., 2018, 8, 121–132 CrossRef CAS.
- Y. Zhang, M. Z. Joel, Y. He, D. Weathersby, F. Han, G. Rimal, J. Tang and Q. Dai, Materials Letters: X, 2019, 3, 100020 Search PubMed.
- V. Bernal, L. Giraldo and J. C. Moreno-Piraján, Adsorpt. Sci. Technol., 2017, 36, 833–850 CrossRef.
- Z. Hasan, E. J. Choi and S. H. Jhung, Chem. Eng. J., 2013, 219, 537–544 CrossRef CAS.
- J. Y. Song, B. N. Bhadra and S. H. Jhung, Microporous Mesoporous Mater., 2017, 243, 221–228 CrossRef CAS.
- N. Zhuo, Y. Lan, W. Yang, Z. Yang, X. Li, X. Zhou, Y. Liu, J. Shen and X. Zhang, Sep. Purif. Technol., 2017, 177, 272–280 CrossRef CAS.
- X. Ling, H. Li, H. Zha, C. He and J. Huang, Chem. Eng. J., 2016, 286, 400–407 CrossRef CAS.
- M. J. Ahmed and B. H. Hameed, J. Cleaner Prod., 2018, 195, 1162–1169 CrossRef CAS.
- A. M. Oickle, S. L. Goertzen, K. R. Hopper, Y. O. Abdalla and H. A. Andreas, Carbon, 2010, 48, 3313–3322 CrossRef CAS.
- Z. Anfar, R. El Haouti, S. Lhanafi, M. Benafqir, Y. Azougarh and N. El Alem, J. Environ. Chem. Eng., 2017, 5, 5857–5867 CrossRef CAS.
- H. M. F. Freundlich, J. Phys. Chem., 1906, 57, 385–471 CAS.
- L. Wang, J. Zhang, R. Zhao, Y. Li, C. Li and C. Zhang, Bioresour. Technol., 2010, 101, 5808–5814 CrossRef CAS PubMed.
- G. Xiao, R. Wen, A. Liu, G. He and D. Wu, J. Hazard. Mater., 2017, 329, 77–83 CrossRef CAS PubMed.
- A. G. Karunanayake, O. A. Todd, M. L. Crowley, L. B. Ricchetti, C. U. Pittman, R. Anderson and T. E. Mlsna, Chem. Eng. J., 2017, 319, 75–88 CrossRef CAS.
- J. Y. Song and S. H. Jhung, Chem. Eng. J., 2017, 322, 366–374 CrossRef CAS.
- R. Baccar, M. Sarrà, J. Bouzid, M. Feki and P. Blánquez, Chem. Eng. J., 2012, 211–212, 310–317 CrossRef CAS.
- F. Liu, J. Zhao, S. Wang, P. Du and B. Xing, Environ. Sci. Technol., 2014, 48, 13197–13206 CrossRef CAS PubMed.
- Z. Anfar, M. Zbair, H. A. Ahsaine, M. Ezahri and N. El Alem, Fullerenes, Nanotubes, Carbon Nanostruct., 2018, 26, 389–397 CrossRef CAS.
- H. Ait Ahsaine, Z. Anfar, M. Zbair, M. Ezahri and N. El Alem, J. Chem., 2018, 2018 DOI:10.1155/2018/6982014.
| This journal is © The Royal Society of Chemistry 2020 |

