DOI:
10.1039/D0RA00754D
(Paper)
RSC Adv., 2020,
10, 15501-15513
4-Methyl-2,6-diformylphenol based biocompatible chemosensors for pH: discrimination between normal cells and cancer cells†
Received
24th January 2020
, Accepted 13th April 2020
First published on 20th April 2020
Abstract
Two compounds, namely, 2-hydroxy-5-methyl-3-((pyridin-2-ylimino)methyl)benzaldehyde (HM-2py-B) and 2-hydroxy-5-methyl-3-((pyridin-3-ylimino)methyl)benzaldehyde (HM-3py-B), have been explored as fluorescent chemosensors for pH. HM-2py-B and HM-3py-B were synthesized by single step condensation reaction between 4-methyl-2,6-diformylphenol and the appropriate aminopyridine. These compounds have been characterized by elemental analysis, FT-IR, 1H NMR, 13C NMR, ESI mass spectrometry, and absorption and fluorescence spectroscopy. Their structures have been confirmed by single crystal X-ray diffraction analysis. Both of the compounds show low emission at 530 nm at low pH. Fluorescence intensity increases with the increase in pH. With the alteration in pH of the medium from 4.0 to 10.0, the fluorescence intensity at 530 nm enhances by 66 and 195 fold for HM-2py-B and HM-3py-B, respectively. pKa values of HM-2py-B and HM-3py-B have been determined to be 7.15 and 6.57, respectively. Fluorescence increase occurs mainly due to deprotonation of the phenolic OH group. Several cations and anions could not induce significant change in fluorescence behavior for both of the probes. The quantum yield and life-time enhance significantly when the pH of the medium is changed from 5.0 to 9.0. Naked eye identification of different pH environments is possible by using these compounds. Some theoretical calculations have been carried out to support experimentally obtained spectral transitions. As cancer cell has a pH in the range of 5.5–7.0 in comparison to normal cell pH of 7.4, these probes have been used effectively to discriminate between normal cells and cancer cells.
Introduction
pH is an important parameter in many fields of chemical, biological and environmental sciences, and also in industrial processes.1 It could be used to understand acid rain, biochemical processes, etc. In the laboratory, pH of a solution is determined using a pH-meter. But this technique has some limitations such as acid error, frequent calibration, electrical interference, etc.2 Moreover, the pH of biological domains cannot be determined using a pH meter. Normal cells have pH in the range of 7.2–7.4. This value varies in the case of affected tissues such as those in tumors. The local pH may be in the range of 5.5–7.0. Irregular pH may lead to the abnormal cell growth with generation of several health issues including cancer.3 During treatment period, tumor cells along with its neighboring normal can be killed. In this procedure, it becomes extremely important to differentiate the healthy cells and the abnormal cells. As pH values of these cells are different, some sensors may be used to recognize this different pH range. Thus, it becomes important to develop suitable pH sensor to distinguish different pH regions and these chemosensors should be compatible in the biological domain. This biocompatible pH sensor exhibits cell permeability and displays different fluorescence behavior owing to the changes in pH within the cellular milieu of normal and cancerous cells. These findings help to differentiate normal and cancerous cells, which can be utilized in various biomedical applications.
As pH of biological system cannot be determined by pH meter, fluorescence spectroscopic technique could be an alternative as it provides easy determination, high sensitivity, low operational costs, etc. Chemosensors for pH have so far been developed based on several fluorophores such as xanthenes, quinoline, phenol, etc.4 Spectral properties of the protonated and deprotonated forms are different. This forms the basis of development of a pH sensor. Protonation and deprotonation of a chemosensor occur either in heterocyclic nitrogen or in phenoxy group. Saha et al. reported one half condensed compound (HL-2-py) based on DFP as pH sensor (Scheme 1).5 We have reported pH chemosensors (HL-3-qui, HL-6-qui and HL-2-qui) based on 4-methyl-2,6-diformylphenol (DFP) and aminoquinoline isomers.6 Deprotonation of the phenolic OH group is occurred in HL-2-py, HL-3-qui, HL-6-qui and HL-2-qui in the sensing process. Recently, Mandal and coworkers constructed one chemosensor for pH by condensing o-vanillin and 3-aminoquinoline.7 But there are rare reports on compounds which have been used to distinguish normal and cancer cells.
 |
| | Scheme 1 Different pH sensors. | |
In this context, we report pH sensing properties of compounds (HM-2py-B and HM-3py-B) derived from 4-methyl-2,6-diformylphenol (DFP) and pyridylamines. HM-2py-B and HM-3py-B have been synthesized by the reaction between DFP and corresponding pyridylamine (2-aminopyridine for HM-2py-B and 3-aminopyridine for HM-3py-B) in 1![[thin space (1/6-em)]](https://www.rsc.org/images/entities/char_2009.gif) :
:![[thin space (1/6-em)]](https://www.rsc.org/images/entities/char_2009.gif) 1 ratio under mild conditions. Previously, we had used different isomers of quinoline to construct chemosensors for pH.6 Here we have chosen pyridylamine to reduce the ring size of aromatic ring in the probe and to examine effect of the decrease of ring size on pH sensing properties. We also wanted to check whether these isomeric compounds show any difference in pH sensing properties. Some theoretical calculations have been performed to investigate some absorption spectral transitions. These compounds have been applied in biological cell imaging studies and to discriminate between normal cell and cancer cells.
1 ratio under mild conditions. Previously, we had used different isomers of quinoline to construct chemosensors for pH.6 Here we have chosen pyridylamine to reduce the ring size of aromatic ring in the probe and to examine effect of the decrease of ring size on pH sensing properties. We also wanted to check whether these isomeric compounds show any difference in pH sensing properties. Some theoretical calculations have been performed to investigate some absorption spectral transitions. These compounds have been applied in biological cell imaging studies and to discriminate between normal cell and cancer cells.
Experimental section
Materials and physical methods
2-Aminopyridine, 3-aminopyridine were purchased from Sigma Aldrich and used as received. 4-Methyl-2,6-diformylphenol (DFP) was synthesized following a published procedure.8 All other reagents were purchased from commercial sources and were used without further purification. Solvents used during spectroscopic studies were purified and dried by standard procedures.9 Britton Robinson buffer in the pH range of 2.0–11.0 has been prepared following a published method.10 FT-IR spectra were recorded in a PerkinElmer spectrometer (Spectrum Two) with the powder samples measured by attenuated total reflectance (ATR) technique. Absorption spectra were recorded on a Lambda 25 PerkinElmer spectrophotometer. Emission spectra were recorded on a HORIBA made Fluoromax-4C spectrofluorometer. Elemental analysis was carried out with a 2400 Series-II CHN analyzer, PerkinElmer, USA. ESI-MS+ spectra were recorded on a QTOF Micro YA263 mass spectrometer. 1H and 13C NMR spectra of the compound were recorded on Bruker 400 MHz or 300 MHz spectrometer.
Emission quantum yields (Φ) of HL-2-qui at different pH were determined by using the formula:
| Φsample = {(ODstandard × Asample × ηsample2)/(ODsample × Astandard × ηstandard2)} × Φstandard |
where
A is the area under the emission spectral curve, OD is optical density of the compound at the excitation wavelength and
η is the refractive index of the solvent, quantum yield of standard (quinine sulphate) (
Φ = 0.546 in water).
11
Synthesis of 2-hydroxy-5-methyl-3-((pyridin-2-ylimino)methyl)benzaldehyde (HM-2py-B) and 2-hydroxy-5-methyl-3-((pyridin-3-ylimino)methyl)benzaldehyde (HM-3py-B)
The Schiff-base molecules, HM-2py-B and HM-3py-B were synthesized following a general synthetic protocol. Typically, to a 10 mL acetonitrile solution of 4-methyl-2,6-diformylphenol (DFP) (0.08 g, 0.5 mmol), 0.5 mmol of the respective amine (0.046 g of pyridin-2-amine for HM-2py-B and 0.046 g of pyridin-3-amine for HM-3py-B) in 5 mL of acetonitrile was added slowly under stirring condition. The mixture was stirred for 30 min and then refluxed for 6 h. Then the mixture was cooled to room temperature. The mixture was filtered to remove any solid material and filtrate was kept for slow evaporation of solvent under ambient condition. Single crystals of both HM-2py-B and HM-3py-B were obtained within few days.
Data for HM-2py-B. Yield = 0.102 g, 78%; anal. calc. (%) for C14H12N2O2: C, 69.99; H, 5.03; N, 11.66. Found: C, 69.82; H, 4.96; N, 11.76; 1H NMR (300 MHz, CDCl3; δ ppm, TMS): 14.04 (s, 1H), 10.53 (s, 1H), 8.64 (s, 1H), 7.72 (s, 1H), 7.45–7.41 (3H, overlapped), 7.32–7.25 (2H, overlapped), 2.34 (s, 3H). 13C NMR (CDCl3, 75 MHz, ppm): 20.21, 120.18, 120.50, 123.10, 124.06, 128.39, 133.18, 138.69, 139.87, 149.14, 156.80, 163.00, 163.68, 189.42; ESI-MS+ (m/z): 241.11 [(HM-2py-B + H+)] and 263.09 [(HM-2py-B + Na+)].
Data for HM-3py-B. Yield = 0.102 g, 78%; anal. calc. (%) for C14H12N2O2: C, 69.99; H, 5.03; N, 11.66. Found: C, 69.92; H, 4.95; N, 11.58; 1H NMR (300 MHz, CDCl3; δ ppm, TMS): 13.38 (s, 1H), 10.49 (s, 1H), 8.69 (s, 1H), 8.57–8.55 (2H, overlapped), 7.76 (s, 1H), 7.61 (d, J = 8 Hz, 1H), 7.55 (s, 1H), 7.39 (t, J = 4.8 Hz, 1H), 2.36 (s, 3H). 13C-NMR (DMSO-d6, 75 MHz): 189.22, 165.28, 161.64, 148.70, 143.75, 139.92, 137.75, 134.65, 129.6, 124.67, 123.72, 121.64, 120.75, 20.12. ESI-MS+ (m/z): 241.11 [(HM-3py-B + H+)].
Crystallographic data collection and refinement
A suitable single crystal of HM-2py-B or HM-3py-B was mounted on the tip of a glass fiber with the help of commercially available glue. X-ray single crystal data collection was carried out at room temperature using a Bruker APEX II diffractometer, equipped with a normal focus, sealed tube X-ray source with graphite monochromated Mo-Kα radiation (λ = 0.71073 Å). The data integration was carried out using a SAINT program12 and the absorption correction was made with SADABS. The structure was solved by SHELXS 9713 using the Patterson method followed by successive Fourier and difference Fourier synthesis. Full matrix least-squares refinements were performed on F2 using SHELXL-97 with anisotropic displacement parameters for all the non-hydrogen atoms.14 All the hydrogen atoms were fixed geometrically by HFIX command and placed in ideal positions. Calculations were carried out using SHELXL 97, SHELXS 97, PLATON v1.15,15 ORTEP-3v2 (ref. 16) and WinGX system Ver-1.80.17 CCDC 1977160 and 1977153 include supplementary crystallographic data of HM-2py-B or HM-3py-B, respectively. Data collection and structure refinement parameters are given in Table 1.
Table 1 Crystal data of HM-2py-B and HM-3py-B
| Compound |
HM-2py-B |
HM-3py-B |
| Formula |
C14H12N2O2 |
C14H12N2O2 |
| Formula weight |
240.26 |
240.26 |
| T (K) |
298(2) |
298(2) |
| Crystal color |
Colorless |
Colorless |
| Crystal system |
Monoclinic |
Orthorhombic |
| Space group |
Pn |
Fdd2 |
| a (Å) |
7.4213(10) |
29.004(4) |
| b (Å) |
4.2957(5) |
37.698(6) |
| c (Å) |
19.130(3) |
4.4554(7) |
| α (°) |
90 |
90 |
| β (°) |
92.660(4) |
90 |
| γ (°) |
90 |
90 |
| V (Å3) |
609.21(13) |
4871.7(13) |
| Z |
2 |
16 |
| Crystal dimensions (mm) |
0.55 × 0.35 × 0.15 |
0.55 × 0.35 × 0.15 |
| F(0 0 0) |
252 |
2000 |
| Dc (g cm−3) |
1.310 |
1.310 |
| λ (Mo Kα) (Å) |
0.71073 |
0.71073 |
| θ range (°) |
0.963–0.987 |
2.05–27.004 |
| Reflection collected/unique/observed |
8157, 2695, 1805 |
16![[thin space (1/6-em)]](https://www.rsc.org/images/entities/char_2009.gif) 785, 2670, 1559 785, 2670, 1559 |
| Absorption correction |
Multi-scan |
Multi-scan |
| Rint |
0.0616 |
0.0919 |
| Final R1 index [I > 2σ(I)] |
0.0909 |
0.1715 |
| Final wR2 index (all reflections) |
0.2011 |
0.1637 |
| Goodness-of-fit |
1.092 |
1.223 |
Theoretical calculations
The ground state (S0) geometries of HM-2py-B, HM-3py-B and their anions were fully optimized by DFT/B3LYP method using the Gaussian 09 program.18 The optimized structures of molecules and the corresponding anions were obtained from B3LYP hybrid function with 6-31G basis set for H, C, N and O atoms.19,20 The nature of all stationary points was authenticated by performing a normal mode analysis, where all vibrational frequencies were positive. On the basis of the optimized structures of HM-2py-B, HM-3py-B and their anions in the ground and excited state, the absorption spectral properties of these were calculated in water by a time-dependent density functional theory (TD-DFT)21–24 associated with the CPCM model (conductor-like polarizable continuum model)25–27 using the same B3LYP method and basis sets.
Cell line culture
Human hepatocellular carcinoma cells, HepG2 and human lung fibroblast cells, WI38 were obtained from the National Center for Cell Science (NCCS) Pune, India. The cells were grown in DMEM with 10% FBS (Fetal Bovine Serum), and penicillin/streptomycin (100 units per ml) at 37 °C and 5% CO2.
Cell survivability assay
Cell survivability of the ligand were studied for human lung fibroblast cells, WI38 following reported procedure.28,3c In brief, viability of WI-38 cells after exposure to various concentrations of ligand were assessed by MTT assay. The cells were seeded in 96-well plates at 1 × 10⁴ cells per well and exposed to ligand at concentrations of 0 μM, 20 μM, 40 μM, 60 μM, 80 μM, 100 μM for 24 h. After incubation cells were washed with 1× PBS twice and incubated with MTT solution (450 μg mL−1) for 3–4 h at 37 °C. The resulting formazan crystals were dissolved in an MTT solubilization buffer and the absorbance was measured at 570 nm by using a spectrophotometer (BioTek) and the value was compared with control cells.
Cell imaging
It is already well established that normal cells have a pH of 7.4 while that of cancer cells is 5.5 (intracellular acidic pH of cancer cells). Different methods have been developed to detect cancer cells by utilizing the acidic pH of cancer cells. HM-2py-B and HM-3py-B have pH responsive behavior and show different fluorescence properties in pH 5.5 and pH 7.4. The purpose of performing the cell imaging studies by fluorescence microscopy is to exploit this attribute of our ligand so that the cancer cells having lower pH can be readily differentiated from the normal cells. The HepG2 and WI38 cells were grown on coverslips for 24 h. After that, the cells were either mock-treated or treated with 10 μM of the probes (HM-2py-B and HM-3py-B) for 1 h at 37 °C. The cells were washed with 1× PBS. Then they were mounted on a glass slide and observed under a fluorescence microscope (Leica).
Results and discussion
Synthesis and characterization
HM-2py-B and HM-3py-B have been synthesized following the route as shown in Scheme 2. One equivalent of both pyridin-2-amine and pyridin-3-amine is allowed to react with one equivalent of DFP to obtain HM-2py-B and HM-3py-B, respectively. Less amount of the amine compound is used in both the cases so that one of the formyl groups remains free.
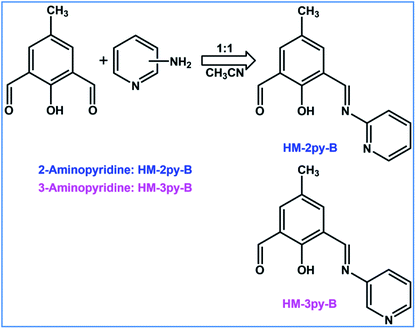 |
| | Scheme 2 Synthetic route of HM-2py-B and HM-3py-B. | |
FT-IR spectra of HM-2py-B and HM-3py-B have been recorded with their solid samples by ATR technique. All of the spectra are shown in Fig. s1.† All of these compounds show bands in the range of 2850–2950 cm−1 indicating the presence of methyl group. HM-2py-B and HM-3py-B show bands at 1668 and 1669, respectively which may be assigned to the presence of aldehyde group.29 These compounds display bands at 1615 and 1622 cm−1, respectively. These may be due to the presence of azomethine moiety. ESI mass spectra of HM-2py-B and HM-3py-B have been recorded in methanol (Fig. s2–s4†). ESI mass spectrum of HM-2py-B shows m/z peaks at 241.11 and 263.09 due to the presence of (HM-2py-B + H+) and (HM-2py-B + Na+), respectively. Mass spectrum of HM-2py-B exhibits m/z peak at 241.11 which may be attributed to the presence of (HM-3py-B + H+) species. Formation of these compounds has further been supported by 1H NMR and 13C NMR spectroscopic studies. 13C NMR spectra of HM-2py-B and HM-3py-B have been given in Fig. s5 and s6,† respectively. 1H NMR spectra of HM-2py-B and HM-3py-B have been discussed later. All of these spectra indicate formation of the corresponding compounds.
Single crystals of HM-2py-B and HM-3py-B have obtained from slow evaporation of solvent within few days. HM-2py-B crystallizes in monoclinic system with Pn space group. A perspective view of HM-2py-B is shown in Fig. 1. Selected bond lengths and bond angles are given in Table s1.† Crystal structure of the compound shows the presence of one formyl group and formation of the azomethine group in it. Presence of azomethine linkage is indicated by the shorter C![[double bond, length as m-dash]](https://www.rsc.org/images/entities/char_e001.gif) N bond distance (N1–C9 distance: 1.297 Å) in comparison to the C–N bond in acyclic N and ring C of pyridine unit (N1–C10 distance: 1.408 Å). The bond angles C10–N1–C9 and N1–C9–C7 are very close to 120°. The pyridine unit and phenyl ring are almost coplanar. HM-3py-B crystallizes in orthorhombic system with Fdd2 space group. A perspective view of HM-3py-B is shown in Fig. 1. Selected bond lengths and bond angles are given in Table s2.† Crystal structures of the Schiff-bases also confirm the conversion of one aldehyde group into azomethine moiety and one unattended formyl group. HM-3py-B is more or less planar. Formation of azomethine bond in HM-3py-B is further supported by the shortening of C9–N1 (double) bond distance (1.284 Å vs. 1.418 Å of C10–N1 bond distance). The bond angles C7–C9–N1 (122.1°) and C9–N1–C10 (120.9°) are close to 120°. The values of bond lengths and bond angles are in good agreement with the published results.6c,30
N bond distance (N1–C9 distance: 1.297 Å) in comparison to the C–N bond in acyclic N and ring C of pyridine unit (N1–C10 distance: 1.408 Å). The bond angles C10–N1–C9 and N1–C9–C7 are very close to 120°. The pyridine unit and phenyl ring are almost coplanar. HM-3py-B crystallizes in orthorhombic system with Fdd2 space group. A perspective view of HM-3py-B is shown in Fig. 1. Selected bond lengths and bond angles are given in Table s2.† Crystal structures of the Schiff-bases also confirm the conversion of one aldehyde group into azomethine moiety and one unattended formyl group. HM-3py-B is more or less planar. Formation of azomethine bond in HM-3py-B is further supported by the shortening of C9–N1 (double) bond distance (1.284 Å vs. 1.418 Å of C10–N1 bond distance). The bond angles C7–C9–N1 (122.1°) and C9–N1–C10 (120.9°) are close to 120°. The values of bond lengths and bond angles are in good agreement with the published results.6c,30
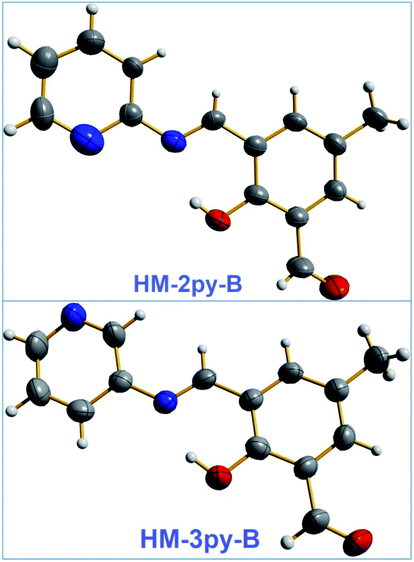 |
| | Fig. 1 ORTEPs of HM-2py-B and HM-3py-B (50% thermal ellipsoid probability). Color code: blue-nitrogen, red-oxygen, grey-carbon and rest-hydrogen. | |
Fluorescence properties
Fluorescence spectra of HM-2py-B and HM-3py-B have been recorded in Britton–Robinson buffer in the pH range of 2.0–12.0 at room temperature (Fig. 2). Excitation wavelength is 378 nm for HM-2py-B and 430 nm for HM-3py-B. Fluorescence intensity of both the compounds at 530 nm is very low when pH of the medium is highly acidic. Here, Stokes shifts are large for both the probes especially for HM-2py-B (152 nm). Large Stokes shift reduces the possibilities of self-absorption and interference from light source. Intensity starts to increase with the increase in pH of the medium. The increase in fluorescence intensity is huge in both the cases when pH of the media is changed from 2.0 to 12.0. No shift in the emission peak has been noticed with the alteration in pH. Fluorescence intensity increase occurs in 28 and 10 fold for HM-2py-B and HM-3py-B, respectively when pH of the medium is changed from 5.0 to 9.0. But if we change pH 4.0 to 10.0, the fluorescence intensity enhances by 66 and 195 fold for HM-2py-B and HM-3py-B, respectively. Enhancement in fluorescence intensity occurs due to the deprotonation of the phenolic OH group of both the probes. Similar fluorescence enhancement has been reported for compounds derived from DFP.5,6 Fluorescence intensity of HL-2-py and HL-2-qui increases at 530 nm while pH sensing of HL-3-qui and HL-6-qui is ratiometric in nature. Emission intensity of both HL-3-qui and HL-6-qui increases at 530 nm in alkaline medium. In all of the cases, deprotonation of phenolic OH group causes the fluorescence enhancement. Deprotonation of phenolic OH group in both of the probes has been supported by 1H NMR spectral study, theoretical calculations and previous reports.
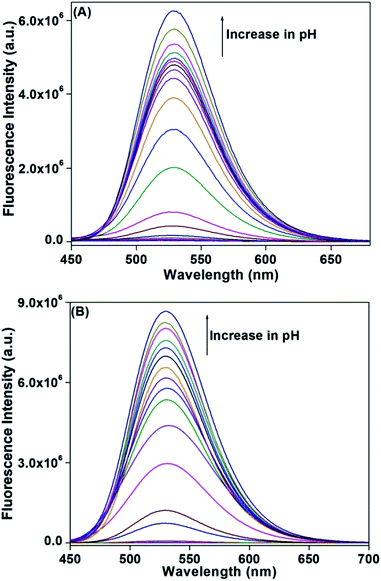 |
| | Fig. 2 Fluorescence intensity of (A) HM-2py-B and (B) HM-3py-B (1 × 10⁻⁴ M) at pH 2.0, 2.5, 3.0, 3.5, 4.0, 4.5, 5.0, 5.5, 6.0, 6.5, 7.0, 7.5, 8.0, 8.5, 9.0, 9.5, 10.0, 10.5, 11.0, 11.5 and 12.0 in Britton–Robinson buffer at room temperature. | |
Quantum yields of HM-2py-B and HM-3py-B have been determined at pH 5.0 and 9.0 (Table 2). Quantum yields of HM-2py-B and HM-3py-B at pH 5.0 have been found to be 0.014 and 0.045, respectively while that of HM-2py-B and HM-3py-B at pH 9.0 have been measured to be 0.285 and 0.535, respectively. It has been found that the quantum yields of both the Schiff-base molecules enhance significantly when the acidic medium is changed to alkaline medium.
Table 2 Some parameters of HM-2py-B and HM-3py-B
| Compound |
Quantum yield at pH 5.0 |
Quantum yield at pH 9.0 |
Life time at pH 5.0 (ns) |
χ2 |
Life time at pH 9.0 (ns) |
χ2 |
pKa |
| HM-2py-B |
0.014 |
0.285 |
4.50 |
1.089 |
4.76 |
1.027 |
7.15 |
| HM-3py-B |
0.045 |
0.535 |
4.60 |
1.088 |
4.73 |
1.007 |
6.57 |
The life-time of both the probes has been measured at two different pH media, namely, pH 4.0 and 9.0 using Time-Correlated Single Photon Counting (TCSPC) method. Fluorescence decay behavior has been given in Fig. s7 and s8.† The compounds show monoexponential decay. The life time of the species are given in Table 2. Life-times of HM-2py-B are 4.50 and 4.76 ns at pH 5.0 and 9.0, respectively whereas life-times of HM-3py-B are determined to be 4.60 and 4.73 ns at pH 5.0 and 9.0, respectively.
pKa is an important parameter for a pH sensor. pKa values of HM-2py-B and HM-3py-B have been measured by using the following Henderson–Hasselbach type equation31
| log[(Fmax − F)/(F − Fmin)] = pH − pKa |
where
Fmax,
Fmin and
F are the maximum, minimum and obtained fluorescence intensity at a particular pH value, respectively. Plots of log[(
Fmax −
F)/(
F −
Fmin)]
vs. log[H
+] for both the compounds are shown in Fig. s9 and s10.
† p
Ka has been determined to be 7.15 and 6.57, for
HM-2py-B and
HM-3py-B, respectively.
Effect of different cations and anions
Next we have measured fluorescence intensities of HM-2py-B and HM-3py-B at pH 4.0 and 9.0 in the presence of different cations (Na+, K+, Mg2+, Ca2+, Al3+, Cr3+, Mn2+, Fe3+, Co2+, Ni2+, Cu2+, Zn2+, Cd2+, Hg2+ and Pb2+) and anions (NO3−, Cl−, CO32− and CH3COO−) to examine whether these cations and anions have any significant effect on fluorescence intensity of the probe in acidic as well as in alkaline media. These ions are either abundant plenty in the nature or threatening towards environment. Results of fluorescence measurement are shown in Fig. 3 and s11.† It is clearly evident from the figures that the fluorescence intensity at 530 nm for both the probes does change considerably in the presence of these cations and anions either in acidic or in basic medium.
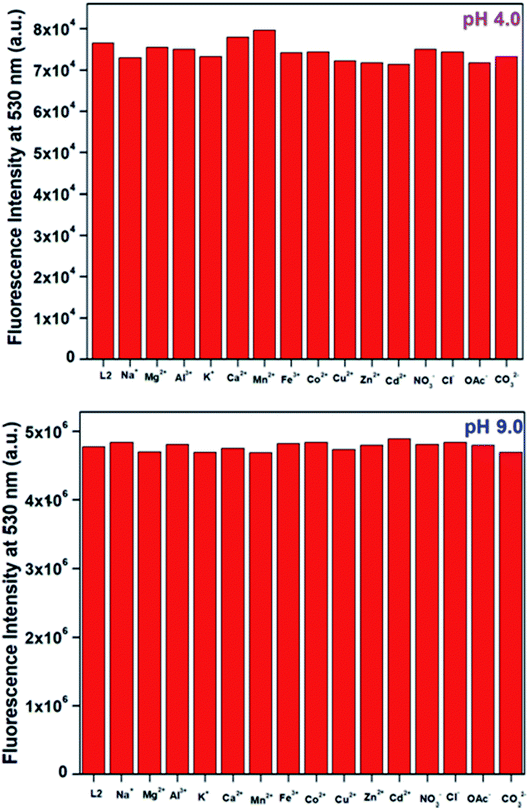 |
| | Fig. 3 Fluorescence intensity of HM-2py-B in the presence of different cations and anions at pH 4.0 and pH 9.0. Here L2 denotes HM-2py-B. | |
Reversibility test
Reversibility test of a pH chemosensor is very important. It shows stability of the probe under various pH media. Schiff-base compound may undergo hydrolysis and be decomposed under different conditions. There are many reported Schiff-base molecules which have been used as chemosensor for different metal ions. They did not undergo any hydrolysis at different pH medium. Here we have performed reversibility test of HM-2py-B and HM-3py-B by recording fluorescence intensity at pH 4.0 and 9.0 repeatedly for several cycles. Results of reversibility test of HM-2py-B are shown in Fig. 4. Fluorescence intensity at low pH is low and it enhances when the pH of medium is changed to 9.0. Again, lowering of pH of the medium leads to decrease in intensity. This goes on for several cycles. Similar observations have been marked for HM-3py-B (Fig. s12†). The reversibility test indicates that the pH sensing procedure is reversible for HM-2py-B and HM-3py-B and both of the chemosensors are quite stable in this pH range.
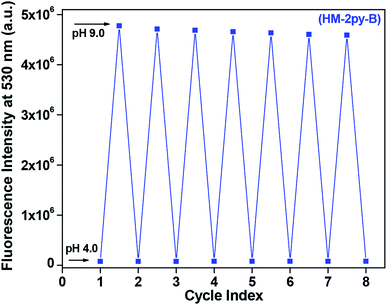 |
| | Fig. 4 Fluorescence reversibility of HM-2py-B between pH 4.0 and 9.0. | |
Absorption spectral studies
UV-vis spectra of HM-2py-B and HM-3py-B have been obtained in the pH range of 2.0–12.0 using the Britton–Robinson buffer at room temperature (Fig. 5). HM-2py-B shows absorption peak at 355 nm at pH 2.0. Spectral behavior changes with the increase in pH of the medium. When pH of the medium is changed from acidic to alkaline region, absorbance at 355 nm decreases while a new band at 430 nm emerges. Absorbance at 430 nm increases as the pH of the medium increases gradually. Change in absorption spectral behavior with altering pH is ratiometric in nature. It shows an isosbestic point at 378 nm. Isosbestic point indicates the existence of an equilibrium between HM-2py-B and its deprotonated anion. Similar spectral change has been observed for HM-3py-B. It exhibits absorption band at 354 nm under acidic condition, 430 nm under alkaline medium and isosbestic point at 377 nm.
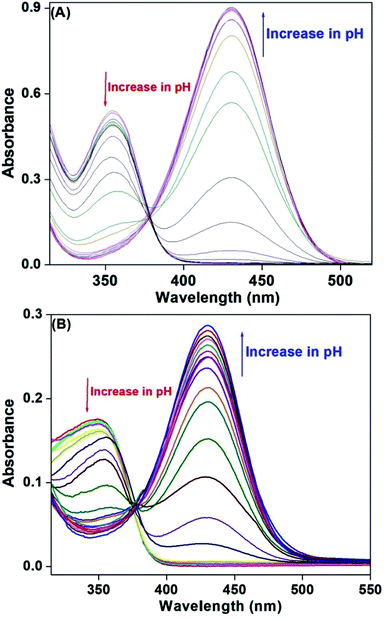 |
| | Fig. 5 UV-visible spectra of (A) HM-2py-B and (B) HM-3py-B (1 × 10⁻⁴ M) at pH 2.0, 2.5, 3.0, 3.5, 4.0, 4.5, 5.0, 5.5, 6.0, 6.5, 7.0, 7.5, 8.0, 8.5, 9.0, 9.5, 10.0, 10.5, 11.0, 11.5 and 12.0 in Britton–Robinson buffer at room temperature. | |
Theoretical studies
Theoretical calculations support the spectral transition observed in UV-vis spectral analysis. Ground state geometries of HM-2py-B and HM-3py-B along with their anions have been optimized by DFT/B3LYP method using the Gaussian 09 program. Optimized structures of all of the probe and their deprotonated forms are shown in Fig. s13 and s14.† Selected bond lengths are bond angles are listed in Table s3.† Absorption spectral transitions of HM-2py-B, HM-3py-B and their anions have been calculated assuming water as solvent by TD-DFT (time dependent density functional theory) approach with the conductor-like polarizable continuum model (CPCM). Electronic correlation present in the TD-DFT approach may give more accurate energies for electronic excitation. HM-2py-B and HM-3py-B show strong absorption bands at 357 nm (experimentally obtained at 355 nm) and 351 nm (experimentally obtained at 354 nm), respectively (Table 3 and Fig. 6). The deprotonated forms HM-2py-B and HM-3py-B exhibit strong absorption bands at 428 nm (experimentally obtained at 430 nm) and 434 nm (experimentally obtained at 430 nm), respectively (Table 3 and Fig. 7). So, theoretically obtained values are in good agreement with the experimental results. It is clear from Fig. 6 and 7 that energy gap between the HOMO and LUMO of the both of the probes decreases to that in their anionic forms. This fact explains why red shifts are occurred for both the probes with the increase in pH of the media.
Table 3 Calculated optical transitions for HM-2py-B and HM-3py-B and their anions with different parameters obtained from TDDFT/B3LYP/CPCM method in water
| Compound |
Excitation (eV) |
Electronic transition state |
Excitation (nm) |
Osc. strength (f) |
Key transitions |
| HM-2py-B |
3.4695 |
S0 → S1 |
357.36 |
0.4704 |
(90.54%) HOMO → LUMO |
| Anion of HM-2py-B |
2.8456 |
S0 → S2 |
427.98 |
0.0002 |
(96.65%) HOMO−1 → LUMO |
| HM-3py-B |
3.5291 |
S0 → S3 |
351.32 |
0.0001 |
(54.12%) HOMO−2 → LUMO |
| Anion of HM-3py-B |
2.8588 |
S0 → S2 |
433.69 |
0.0003 |
(96.69%) HOMO−1 → LUMO |
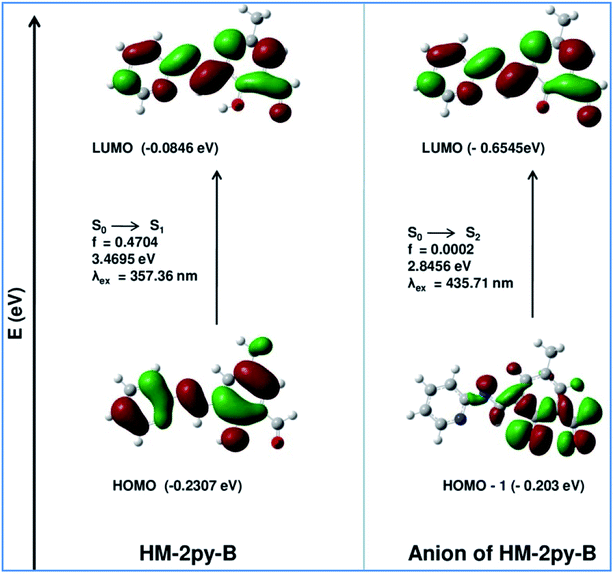 |
| | Fig. 6 Energy level diagram of HM-2py-B and its anion. | |
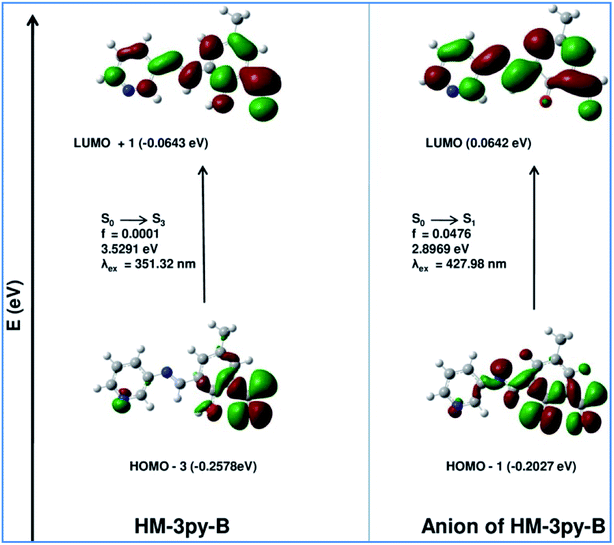 |
| | Fig. 7 Energy level diagram of HM-3py-B and its anion. | |
Naked eye detection
pH region can be visually identified using HM-2py-B and HM-3py-B. Images of these probes in different pH solutions are captured under visible and UV light (Fig. 8). It is clearly evident that, under visible light, the solution of HM-2py-B is colorless until pH of the medium becomes 6.0 and the color of the medium with HM-2py-B is first turned as pale yellow and then to yellow when pH of the medium is changed to alkaline region. When these solution have been observed using UV light, it becomes clear that sharp change in color occurs when pH of the medium is changed from 6.0 to 6.5. The solution is indigo at pH 6.0 and becomes fluorescent green at pH 6.5 or higher when the pictures have been captured under UV light. Very similar observations have been noticed for HM-3py-B (Fig. s15†). Under observed light, the color of solution of HM-3py-B is changed from colorless to yellow when pH of the medium is altered from 5.5 to 6.0. Solution is colorless below pH 5.5 and yellow above pH 6.0. When the images have been captured under UV light, the solution of HM-3py-B is indigo and fluorescent green at pH 5.5 and 6.0, respectively. The change in absorption spectra is highly correlated with the color change for both the probes. Thus, pH region can be identified with both HM-2py-B and HM-3py-B under visible and UV light.
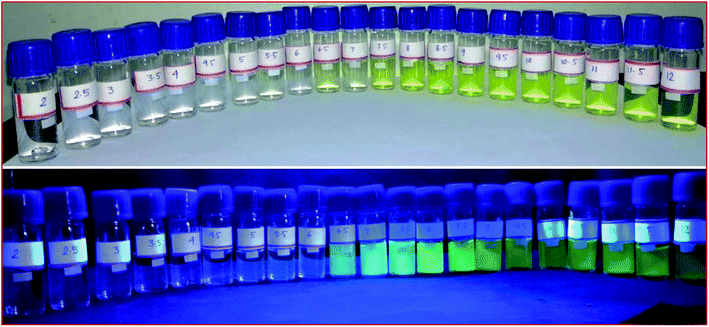 |
| | Fig. 8 Colors of HM-2py-B in the presence of different pH media under visible light (upper row) and UV light (lower row) in Britton–Robinson buffer at room temperature. | |
1H NMR spectral studies
1H NMR spectrum of HM-3py-B has been recorded in CDCl3 (Fig. 9A). Signals for phenolic OH group and CHO group appear at 13.38 ppm and 10.49 ppm. Presence of imine proton appears at 8.69 ppm. This indicates conversion of one of CHO groups into the corresponding azomethine moiety while one CHO group remains as it is. Aliphatic protons of CH3 group give singlet peak 2.36 ppm. Signals for all aromatic protons emerge in the range of 8.57–7.39 ppm. 1H NMR spectrum of HM-3py-B has been obtained in the presence of alkali in DMSO-d6 (Fig. 9B). Peak for phenolic proton at 13.38 ppm disappears. All other peaks are more or less corresponding to the relevant protons. Thus, in the presence of alkali deprotonation of phenolic OH group occurs. 1H NMR spectrum of HM-2py-B has been given Fig. s16.† Similar observations are expected to happen for HM-2py-B also.
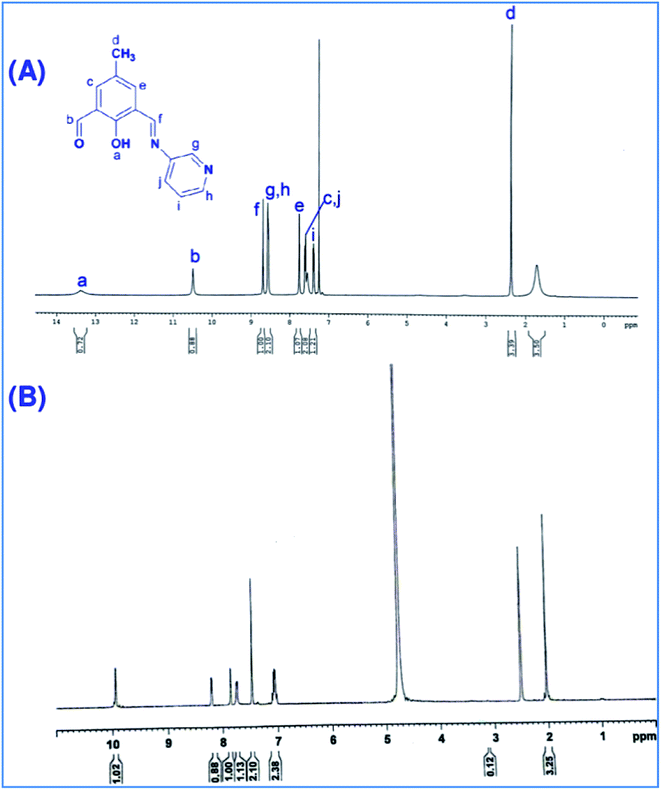 |
| | Fig. 9 (A) 1H NMR spectrum of HM-3py-B in CDCl3 and (B) 1H NMR spectrum of HM-3py-B in the presence of alkali in DMSO-d6. | |
Cell imaging studies
The in vitro cytotoxicity of HM-2py-B and HM-3py-B has been evaluated for the purpose of checking the biocompatibility with normal lung fibroblast cells, WI38. The cells have been treated with five different concentrations (20 μM, 40 μM, 60 μM, 80 μM and 100 μM) of the probe for 24 h followed by MTT assay. It has been observed that both of the probes exhibit negligible toxicity even at the highest concentration of 100 μM. Therefore, HM-2py-B and HM-3py-B are biocompatible and can be used effectively applied in various biomedical fields (Fig. s17†).
The fluorescence microscopy study has been performed to envisage the pH responsive changes in fluorescence of the probe within normal and cancer cells. Normal cells have a pH of 7.4 while that of cancer cells is 5.5 (intracellular acidic pH of cancer cells). After the addition of HM-2py-B and HM-3py-B (10 μM), a prominent green fluorescence signal is observed under the microscope in the case of normal WI38 cells (Fig. 10). On the other hand, no fluorescence is observed in case of the cancerous, HepG2 cells (Fig. 11). Therefore the cells readily internalize the probes which results in green fluorescence signal normal cell while the fluorescence quenches in cancerous cells due to low intracellular pH. Thus, we can conclude that the probe has the capability to differentiate between cancerous and non cancerous cells owing to its pH dependent fluorescence characteristics.
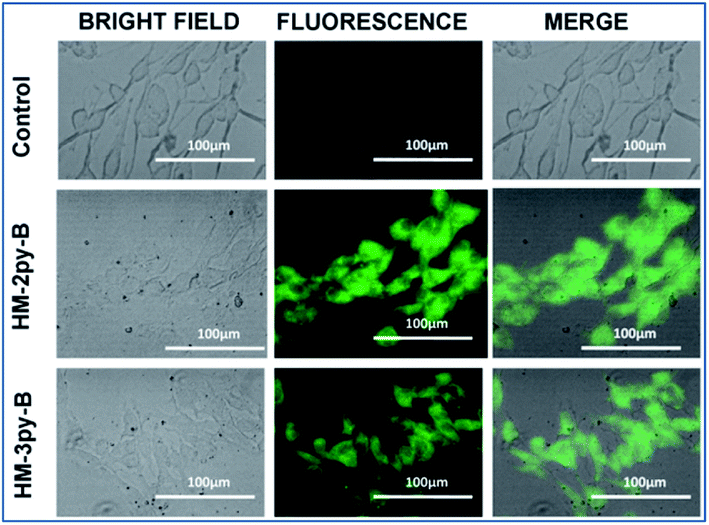 |
| | Fig. 10 Cellular internalization study of HM-2py-B and HM-3py-B in the normal human lung fibroblast, WI38 cells. | |
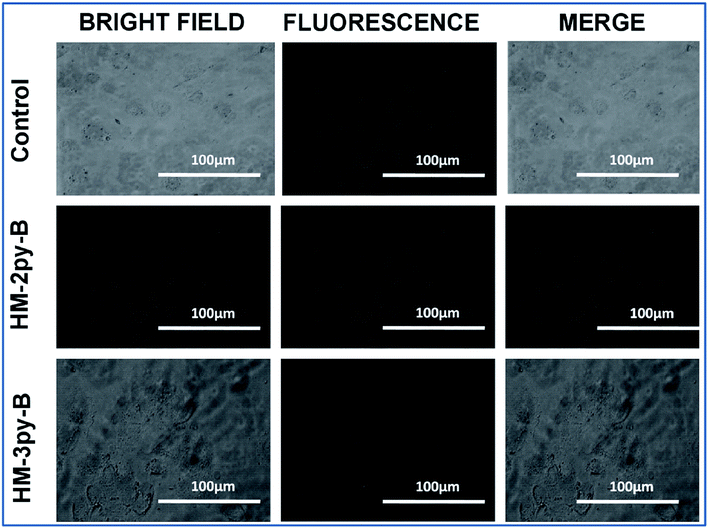 |
| | Fig. 11 Cellular internalization study of HM-2py-B and HM-3py-B in the hepatocellular cancer, HepG2 cells. | |
Comparative discussion
Only few articles of pH sensors based on DFP were published. A probe, 3-[(3-benzyloxypyridin-2-ylimino)methyl]-2-hydroxy-5-methylbenzaldehyde (HL-2-py)5 showed 250 fold increment in fluorescence intensity at 528 nm. It was applied in cell imaging studies but not to discriminate different cells. Another compound, 2-hydroxy-5-methyl-3-((quinolin-3-yliminio)methyl)benzaldehyde (HL-3-qui)6a behaved as a ratiometric chemosensor for pH. Fluorescence intensity at 464 nm decreased with the emergence of peak at 530 nm when pH of the media was altered from acidic condition to alkaline. It was used in real sample and cell imaging studies. Isomer of HL-3-qui, 2-hydroxy-5-methyl-3-((quinolin-6-ylimino)methyl)benzaldehyde (HL-6-qui)6b showed similar ratiometric pH sensing as HL-3-qui did. However, another isomer of HL-3-qui, 2-hydroxy-5-methyl-3-((quinolin-2-ylimino)methyl)benzaldehyde (HL-2-qui)6c was found as pH sensor but not as ratiometric in nature. Its fluorescence intensity at 530 nm enhanced with the gradual increase in pH of the medium. There are other pH sensors based on different fluorophoric platforms. Li et al. reported a benzimidazole-BODIPY based chemosensor with pKa value of 5.2.32 With the change in pH from 8.0 to 3.0, absorbance at 505 nm decreased and emission intensity at 520 nm increased accompanied by color change from yellow to green. It was used to label acidic organelle lysosome. Another ratiometric probe for pH was developed with N N-dimethylaniline and imidazopyridine (pKa of 3.1).33 When pH was changed from 7.0 to 2.2, absorbance altered from 412 to 442 nm and fluorescence changed from 560 to 650 nm with the protonation of nitrogen atom of imidazopyridine. It was applied to monitor intracellular pH changes in HeLa cells. A ratiometric fluorescent probe based on rhodamine and imidazo[1,5-α]pyridine derivative was reported for sensing lysosomal pH via FRET mechanism.34 Fluorescence intensity of another rhodamine based probe enhanced at 575 nm and colorless solution turned pink when pH was changed from 3.06 to 1.75.35 Cell imaging of bacteria was performed using the probe under strongly acidic condition. Fluorescence intensity of a rhodamine B based sensor with appendage of crown-ether increased with the pH change from 7.0 to 4.0 accompanying by pink coloration.36 It was also utilized in cell imaging. Another rhodamine-based chemosensor was reported recently for lysosomal pH when fluorescence intensity was enhanced at 705 nm with the change in pH from 7.40 to 2.00.37 This probe was also used in cell imaging. A coumarin based chemosensor could bring changes in fluorescence emissions over a broad pH range from 1.0–13.5 and used in bioimaging of living cells and animals.38 One probe with perylene moiety as the fluorophore exhibited spectral sensitivities in monitoring strongly acidic pH ranges (pH: 2.6–4.0).39 In the present study, two DFP based compounds were synthesized and characterized by single crystal X-ray diffraction analysis along with other standard methods. These probes were able to identify low acidic regions both as colorimetric and fluorescent chemosensor. Moreover, these were utilized to make differences between normal cell and cancer cell. Above discussions indicates that several chemosensors for pH were constructed and used in different pH regions according to their properties. Present chemosensors are well characterized and their properties are appropriate to use them to differentiate between normal cells and cancer cell.
Conclusions
In summary, we have synthesized to two compounds, 2-hydroxy-5-methyl-3-((uinolon-2-ylimino)methyl)benzaldehyde (HM-2py-B) and 2-hydroxy-5-methyl-3-((uinolon-3-ylimino)methyl)benzaldehyde (HM-3py-B), as fluorescent and chromogenic chemosensor for pH. These compounds have been characterized by single crystal diffraction analysis along with other standard methods. Fluorescence intensity at 530 nm of both of the compounds increases with the increase in pH. Quantum yield and life-time of both the compounds enhance when acidic medium is changed to alkaline medium. In absorption spectra analysis, it has been found that a peak at 430 nm emerges with gradual increase in absorbance when pH of the medium in gradually increased. Solutions of the probes turn yellow from colorless when the solution is made alkaline from acidic under visible light. Color of the solution is colorless and fluorescent yellowish green in acidic and alkaline conditions, respectively under UV light. This indicates the HM-2py-B and HM-3py-B could be used to identify different pH regions by naked eye. With the decrease in ring size from quinolone to pyridine, fluorescence properties of the probe do not change considerably. Different isomers of pyridylamine have been used to construct HM-2py-B and HM-3py-B. However, there is little effect in fluorescence character of these compounds. Both of the probes show similar sensing properties. Both, HM-2py-B and HM-3py-B, have been used effectively in biological domain to distinguish between normal cell and cancer cell. These features make these probes strong candidate for cancer cell detection and other associated applications in the field of biomedicine.
Conflicts of interest
There are no conflicts to declare.
Acknowledgements
PR thankfully acknowledges financial supports from CSIR-New Delhi (Sanction letter no. 01(2993)/19/EMR-II dated 20.05.2019) and RUSA 2.0, Jadavpur University. TD wishes to thank UGC, New Delhi for providing him a fellowship. AH and AR thank CSIR-New Delhi for providing them fellowships. Authors sincerely thank Dr Shouvik Chattopadhyay of Department of Chemistry, Jadavpur University for his help regarding single crystal X-ray analysis.
References
-
(a) R. G. Bates, Determination of pH: theory and practice, John Wiley & Sons, Inc., New York, London, Sydney, 1964 Search PubMed;
(b) K. Xu and A. M. Klibanov, J. Am. Chem. Soc., 1996, 118, 9815 CrossRef CAS;
(c) R. A. Gottlieb and A. Dosanjh, Proc. Natl. Acad. Sci. U. S. A., 1996, 93, 3587 CrossRef CAS PubMed.
- G. Mattock and G. R. Taylor, pH Measurement and Titration, Heywood, London, 1961, pp. 198–246 Search PubMed.
-
(a) A. Lardner, J. Leukocyte Biol., 2001, 69, 522 CAS;
(b) T. R. Arnett, J. Nutr., 2008, 138, 415S CrossRef CAS PubMed;
(c) M. Damaghi, J. W. Wojtkowiak and R. J. Gillies, Front. Physiol., 2013, 4, 370 Search PubMed.
-
(a) X. Li, X. Gao, W. Shi and H. Ma, Chem. Rev., 2014, 114, 590 CrossRef CAS PubMed;
(b) J. Y. Han and K. Burgess, Chem. Rev., 2010, 110, 2709 CrossRef CAS PubMed;
(c) S. Halder, S. Dey and P. Roy, RSC Adv., 2015, 5, 54873 RSC.
- U. C. Saha, K. Dhara, B. Chattopadhyay, S. K. Mandal, S. Mondal, S. Sen, M. Mukherjee, S. van Smaalen and P. Chattopadhyay, Org. Lett., 2011, 13, 4510 CrossRef CAS PubMed.
-
(a) S. Halder, A. Bhattacharjee, A. Roy, S. Chatterjee and P. Roy, RSC Adv., 2016, 6, 39118 RSC;
(b) S. Halder, A. Hazra and P. Roy, J. Lumin., 2018, 195, 326 CrossRef CAS;
(c) A. Hazra, A. Roy, A. Bhattacharjee, A. Barma and P. Roy, J. Mol. Struct., 2020, 1201, 127173 CrossRef CAS.
- J. Mandal, P. Ghorai, P. Brandão, K. Pal, P. Karmakar and A. Saha, New J. Chem., 2018, 42, 19818 RSC.
- R. R. Gagne, C. L. Spiro, T. J. Smith, C. A. Hamann, W. R. Thies and A. K. Schiemke, J. Am. Chem. Soc., 1981, 103, 4073 CrossRef CAS.
- D. D. Perrin, W. L. F. Armarego and D. R. Perrin, Purification of Laboratory Chemicals, Pergamon Press, Oxford, U.K., 1980 Search PubMed.
- H. T. S. Britton and R. A. Robinson, J. Chem. Soc., 1931, 1456 RSC.
- A. M. Brouwer, Pure Appl. Chem., 2011, 83, 2213 CAS.
- APEX-II, SAINT and SADABS, Bruker AXS Inc., Madison, WI, 2008 Search PubMed.
- G. M. Sheldrick, Acta Crystallogr., Sect. A: Fundam. Crystallogr., 2015, 71, 3 CrossRef PubMed.
- G. M. Sheldrick, Acta Crystallogr., Sect. C: Cryst. Struct. Commun., 2015, 71, 3 CrossRef PubMed.
- A. L. Spek, Acta Crystallogr., Sect. D: Biol. Crystallogr., 2009, 65, 148 CrossRef CAS PubMed.
- L. J. Farrugia, J. Appl. Crystallogr., 1997, 30, 565 CrossRef CAS.
- L. J. Farrugia, J. Appl. Crystallogr., 1999, 32, 83 CrossRef.
- M. J. Frisch, G. W. Trucks, H. B. Schlegel, G. E. Scuseria, M. A. Robb, J. R. Cheeseman, G. Scalmani, V. Barone, B. Mennucci, G. A. Petersson, H. Nakatsuji, M. Caricato, X. Li, H. P. Hratchian, A. F. Izmaylov, J. Bloino, G. Zheng, J. L. Sonnenberg, M. Hada, M. Ehara, K. Toyota, R. Fukuda, J. Hasegawa, M. Ishida, T. Nakajima, Y. Honda, O. Kitao, H. Nakai, T. Vreven, J. A. Montgomery Jr., J. E. Peralta, F. Ogliaro, M. Bearpark, J. J. Heyd, E. Brothers, K. N. Kudin, V. N. Staroverov, R. Kobayashi, J. Normand, K. Raghavachari, A. Rendell, J. C. Burant, S. S. Iyengar, J. Tomasi, M. Cossi, N. Rega, J. M. Millam, M. Klene, J. E. Knox, J. B. Cross, V. Bakken, C. Adamo, J. Jaramillo, R. Gomperts, R. E. Stratmann, O. Yazyev, A. J. Austin, R. Cammi, C. Pomelli, J. W. Ochterski, R. L. Martin, K. Morokuma, V. G. Zakrzewski, G. A. Voth, P. Salvador, J. J. Dannenberg, S. Dapprich, A. D. Daniels, Ö. Farkas, J. B. Foresman, J. V. Ortiz, J. Cioslowski and D. J. Fox, GAUSSIAN 09, Revision D.01, Gaussian Inc., Wallingford, CT, 2009 Search PubMed.
- G. A. Petersson, A. Bennett, T. G. Tensfeldt, M. A. Al-Laham, W. A. Shirley and J. Mantzaris, J. Chem. Phys., 1988, 89, 2193 CrossRef CAS.
- G. A. Petersson and M. A. Al-Laham, J. Chem. Phys., 1991, 94, 6081 CrossRef CAS.
- A. D. Becke, J. Chem. Phys., 1993, 98, 5648 CrossRef CAS.
- P. J. Hay and W. R. Wadt, J. Chem. Phys., 1985, 82, 299 CrossRef CAS.
- S. Miertus, E. Scrocco and J. Tomasi, Chem. Phys., 1981, 55, 117 CrossRef CAS.
- V. Barone, M. Cossi and J. Tomasi, J. Comput. Chem., 1998, 19, 404 CrossRef CAS.
- V. Barone and M. Cossi, J. Phys. Chem. A, 1998, 102, 1995 CrossRef CAS.
- M. Cossi and V. Barone, J. Chem. Phys., 2001, 115, 4708 CrossRef CAS.
- M. Cossi, N. Rega, G. Scalmani and V. Barone, J. Comput. Chem., 2003, 24, 669 CrossRef CAS PubMed.
- M. Anderson, A. Moshnikova, D. M. Engelman, Y. K. Reshetnyak and O. A. Andreev, Proc. Natl. Acad. Sci. U. S. A., 2016, 113, 8177 CrossRef CAS PubMed.
- A. Roy, S. Das, S. Sacher, S. K. Mandal and P. Roy, Dalton Trans., 2019, 48, 17594 RSC.
- S. Halder, A. Dey, J. Ortega-Castro, A. Frontera, P. P. Ray and P. Roy, J. Phys. Chem. C, 2016, 120, 25557 CrossRef CAS.
- L. Cao, X. Li, S. Wang, S. Li, Y. Li and G. Yang, Chem. Commun., 2014, 50, 8787 RSC.
- Z. Li, L.-J. Li, T. Sun, L. Liu and Z. Xie, Dyes Pigm., 2016, 128, 165 CrossRef CAS.
- T. Zhang, Y. Zhang, R. Wang and D. Xu, Dyes Pigm., 2019, 171, 107672 CrossRef CAS.
- G.-J. Song, S.-Y. Bai, J. Luo, X.-Q. Cao and B.-X. Zhao, J. Fluoresc., 2016, 26, 2079 CrossRef CAS PubMed.
- J.-L. Tan, T.-T. Yang, Y. Liu, X. Zhang, S.-J. Cheng, H. Zuoa and H. He, Luminescence, 2016, 31, 865 CrossRef CAS.
- D. Lee, K. M. K. Swamy, J. Hong, S. Lee and J. Yoon, Sens. Actuators, B, 2018, 266, 416 CrossRef CAS.
- X.-F. Zhang, T.-R. Wang, X.-Q. Cao and S.-L. Shen, Spectrochim. Acta, Part A, 2020, 227, 117761 CrossRef CAS PubMed.
- X. Zhu, Q. Lin, P. Chen, Y.-P. Fu, Y.-M. Zhang and T.-B. Wei, New J. Chem., 2016, 40, 4562 RSC.
- F. Ye, X.-M. Liang, N. Wu, P. Li, Q. Chai and Y. Fu, Spectrochim. Acta, Part A, 2019, 216, 359 CrossRef CAS.
Footnotes |
| † Electronic supplementary information (ESI) available. CCDC 1977153 and 1977160. For ESI and crystallographic data in CIF or other electronic format see DOI: 10.1039/d0ra00754d |
| ‡ Contributed equally. |
|
| This journal is © The Royal Society of Chemistry 2020 |
Click here to see how this site uses Cookies. View our privacy policy here.  Open Access Article
 b and
Partha Roy
 *a
*a
![[thin space (1/6-em)]](https://www.rsc.org/images/entities/char_2009.gif) :
:![[thin space (1/6-em)]](https://www.rsc.org/images/entities/char_2009.gif) 1 ratio under mild conditions. Previously, we had used different isomers of quinoline to construct chemosensors for pH.6 Here we have chosen pyridylamine to reduce the ring size of aromatic ring in the probe and to examine effect of the decrease of ring size on pH sensing properties. We also wanted to check whether these isomeric compounds show any difference in pH sensing properties. Some theoretical calculations have been performed to investigate some absorption spectral transitions. These compounds have been applied in biological cell imaging studies and to discriminate between normal cell and cancer cells.
1 ratio under mild conditions. Previously, we had used different isomers of quinoline to construct chemosensors for pH.6 Here we have chosen pyridylamine to reduce the ring size of aromatic ring in the probe and to examine effect of the decrease of ring size on pH sensing properties. We also wanted to check whether these isomeric compounds show any difference in pH sensing properties. Some theoretical calculations have been performed to investigate some absorption spectral transitions. These compounds have been applied in biological cell imaging studies and to discriminate between normal cell and cancer cells.![[thin space (1/6-em)]](https://www.rsc.org/images/entities/char_2009.gif) 785, 2670, 1559
785, 2670, 1559![[double bond, length as m-dash]](https://www.rsc.org/images/entities/char_e001.gif) N bond distance (N1–C9 distance: 1.297 Å) in comparison to the C–N bond in acyclic N and ring C of pyridine unit (N1–C10 distance: 1.408 Å). The bond angles C10–N1–C9 and N1–C9–C7 are very close to 120°. The pyridine unit and phenyl ring are almost coplanar. HM-3py-B crystallizes in orthorhombic system with Fdd2 space group. A perspective view of HM-3py-B is shown in Fig. 1. Selected bond lengths and bond angles are given in Table s2.† Crystal structures of the Schiff-bases also confirm the conversion of one aldehyde group into azomethine moiety and one unattended formyl group. HM-3py-B is more or less planar. Formation of azomethine bond in HM-3py-B is further supported by the shortening of C9–N1 (double) bond distance (1.284 Å vs. 1.418 Å of C10–N1 bond distance). The bond angles C7–C9–N1 (122.1°) and C9–N1–C10 (120.9°) are close to 120°. The values of bond lengths and bond angles are in good agreement with the published results.6c,30
N bond distance (N1–C9 distance: 1.297 Å) in comparison to the C–N bond in acyclic N and ring C of pyridine unit (N1–C10 distance: 1.408 Å). The bond angles C10–N1–C9 and N1–C9–C7 are very close to 120°. The pyridine unit and phenyl ring are almost coplanar. HM-3py-B crystallizes in orthorhombic system with Fdd2 space group. A perspective view of HM-3py-B is shown in Fig. 1. Selected bond lengths and bond angles are given in Table s2.† Crystal structures of the Schiff-bases also confirm the conversion of one aldehyde group into azomethine moiety and one unattended formyl group. HM-3py-B is more or less planar. Formation of azomethine bond in HM-3py-B is further supported by the shortening of C9–N1 (double) bond distance (1.284 Å vs. 1.418 Å of C10–N1 bond distance). The bond angles C7–C9–N1 (122.1°) and C9–N1–C10 (120.9°) are close to 120°. The values of bond lengths and bond angles are in good agreement with the published results.6c,30


