 Open Access Article
Enhanced energy efficiency for the complete mineralization of diclofenac by self-sequential ultrasound enhanced ozonation
Zhen Chenabd,
Shewei Yangbd,
Yonghong Wangbd,
Mingshan Zhu c and
Chaohai Wei*a
aSchool of Environment and Energy, South China University of Technology, Guangzhou 510006, PR China. E-mail: cechwei@scut.edu.cn
bGuangdong Provincial Academy of Environmental Sciences, Guangzhou 510045, PR China
cSchool of Environment, Jinan University, Guangzhou, 510632, PR China
dGuangdong-Hongkong-Macau Joint Laboratory of Collaborative Innovation for Environmental Quality, PR China
First published on 20th April 2020
Abstract
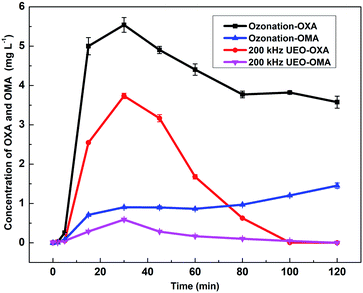
Diclofenac (DCF), an anti-biodegradable drug, needs to be post-treated after conventional biochemical treatment. In this paper, ultrasound enhanced ozonation (UEO) under different conditions was employed to degrade DCF. The results showed that DCF was completely degraded by UEO in 8 min and complete total organic carbon (TOC) removal occurred in 120 min. The generation of ˙OH via UEO could be achieved through ozone decomposition, H2O sonolysis, and ozone sonolysis, which contributed to the complete mineralization of DCF. The total amount of ˙OH produced by 200 kHz UEO was 3.8 times higher than that of single ozonation plus single sonolysis in 120 min. Typical persistent intermediates of DCF, such as oxalic acid and oxamic acid, could be efficiently degraded by UEO. It was found that 60 min ozonation followed by 60 min UEO had the best mineralization energy efficiency (MEE) (113 mg (kW h)−1) at the base of complete mineralization and there was one-third reduction in the total energy consumption compared to that for single UEO. Based on the analysis of the evolution index (EI), pH was selected as the best judgment index of self-sequential UEO for indicating the time point of ultrasound irradiation, which saves irradiation times for practical use.
1. Introduction
As a primary component of non-steroidal anti-inflammatory drugs, diclofenac (DCF) is thought to be one of the emerging pollutants in the last ten years.1 At present, DCF is often detected in municipal sewage influents and effluents, surface water, and groundwater.2 Toxicological investigations have shown harmful effects on aquatic species even at low DCF concentrations,3,4 and toxic breakdown products are formed by the degradation of DCF.5,6 Accordingly, DCF must be eliminated entirely before reaching natural water.2Ozone is a highly selective oxidant with the standard potentials of 1.25 V in basic solutions and 2.07 V in acidic solutions.7 It has been extensively reported that organic contaminants are rapidly destroyed by ozonation. However, the reaction intermediates of these contaminants cannot be completely mineralized generally, which limits the broad applications of ozonation.8–10 The introduction of different physical fields in ozone-based advanced oxidation processes (AOPs), including ultrasound, ultraviolet radiation, and electricity, are practical protocols to improve the mineralization capacity of ozonation.11–13 Among various protocols, previous investigations have shown that in ultrasound enhanced ozonation (UEO), the ultrasound process promotes mass transfer between ozone and the solution through agitation14 as well as promotes ozone cleavage and hydrolysis through cavitation, which results in the improvement of oxidation ability through the production of more ˙OH radicals.15 Moreover, UEO has the potential advantages of being simpler, safer, and cleaner than conventional AOPs.16
It is well known that energy efficiency is one of the critical factors for the application of AOPs. The sequential reactions combine the advantages of different AOPs for improving treatment performance and promoting energy efficiency.17,18 As no additional equipment is required for UEO, the O3–UEO self-sequential treatment, which combines the degradation ability of ozonation and the mineralization ability of UEO, has been proposed for process optimization. The environment friendliness and cost-effectiveness of the O3–UEO self-sequential treatment are determined by the time point of ultrasound irradiation, which has barely been reported. The aims of this study are (1) to study the complete degradation of DCF by ozonation and UEO and the enhanced mechanism of UEO; (2) to improve the mineralization energy efficiency using the O3–UEO self-sequential process; and (3) to find the best judgment index for the self-sequential UEO process for indicating the time point of ultrasound irradiation. This study offers more insights into the development of UEO for the mineralization of DCF in water, provides a feasible innovative energy-saving mode for the practical applications of combined processes, such as the O3–UEO self-sequential process, and proposes reaction control indicators to improve the operability of applications.
2. Materials and methods
2.1 Materials
Diclofenac (sodium salt), characterized by a water solubility of 237 mg L−1 at 25 °C, was provided by Sinopharm Chemical Reagent Co. Ltd. (Shanghai, China). Spiked solutions with initial DCF concentrations (20 mg L−1) were prepared using water from Milli-Q equipment.2.2 Experimental procedure
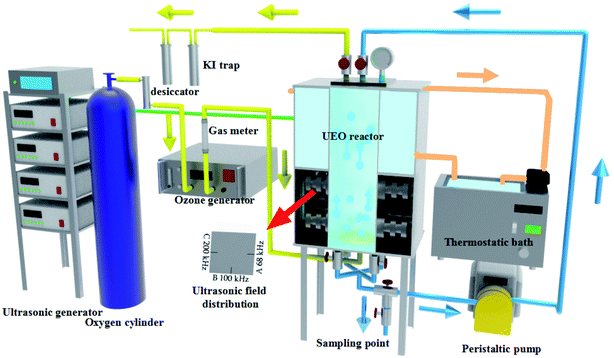
As shown in Fig. 1, the degradation of DCF was performed in an ultrasonic plate reactor, which was composed of stainless steel with width × height × depth of 12.0 × 24 × 12 cm. Three sides of the lower half of the reactor were installed with three series of piezoelectric transducers and were arranged in sequences at 68, 100, and 200 kHz, respectively. Three frequency generators and a power supply were in the emitting system. The maximum ultrasonic power inputs of the three fields were 200 W (68 and 100 kHz) and 180 W (200 kHz). Cold water from a cooling system was kept outside the top half of the reactor and was circulated to control the reaction temperature at about 25 °C.Ozone was produced from O2 (99.999%) through a CH-ZTW3G ozone generator (Guangzhou Chuanghuan Ozone Electric Appliance Co. Ltd., China) using the electric discharge method at 100 W. Subsequently, the ozone was fed into the reactor system with water samples through a Φ10.0 cm arc porous titanium plate (pore diameter: 0.22–100 μm, porosity: 35–50%, and bubble diameter: 0.1–2 mm) at the bottom of the reactor. In this experiment, the flow speed of ozone was 0.3 L min−1, and the ozone concentration was controlled at 32.0 mg L−1. In order to eliminate any possible side effects, the reactor should be pre-ozonated for 2 min and washed three times with distilled water. Following this, the DCF solution (3 L) was pumped into the reactor and then circulated at a rate of 0.1 L min−1. Samples were taken from the reactor at different reaction times to evaluate the multiple parameters in solution. The degradation experiments were carried out directly at an initial pH of ca. 6.8. All the experiments were performed in triplicate.
2.3 Analytical methods
DCF concentrations were determined by HPLC using a Shimadzu LC-20AT equipment, which was attached to a diode array detector and an Eclipse XDB-C18 column (4.6 mm × 150 mm, 5 μm) under isocratic elution. The mobile phase was composed of 25% of the glacial acetic acid buffer solution with 75% methanol with a flow rate of 1 mL min−1. Oxalic and oxamic acid were evaluated by Thermo TSQ Quantum Access MAX using a Waters HSS T3 column (10 cm × 2.1 mm, 1.8 μm) operating under isocratic elution of the mobile phase at a rate of 0.5 mL min−1. The mobile phase contained water and acetonitrile (volume ratio 1![[thin space (1/6-em)]](https://www.rsc.org/images/entities/char_2009.gif) :
:![[thin space (1/6-em)]](https://www.rsc.org/images/entities/char_2009.gif) 3).
3).
The solution pH was measured using a pH electrode (Thermo Orion model 420 A+) connected to a digital pH meter. A TOC analyzer (Vario TOC, Elementar, Germany) was used for TOC determination. The TOC detection limit was 0.03 ppm and the minimum detection concentration of TOC was 0.1 ppm. The gaseous ozone concentration was measured using the iodometric titration method. To measure the transient concentration of hydroxyl radicals produced by the decomposition of ozone, 5.0 g L−1 tert-butanol was added to the DCF solution. tert-Butanol can scavenge hydroxyl radical and produce stoichiometric formaldehyde. The concentration of formaldehyde was determined by the Hantzsch method.19,20 The sample was mixed with the Hantzsch reagent and heated for 30 min at 323 K in the dark. The concentration was determined using absorbance at 412 nm (ε = 7530 (M cm)−1).
Equipped with a Dionex Ionpac CS12A column, the Dionex ICS-90 ion chromatograph was used to determine the ammonium concentration. Isocratic elution was done with H2SO4 (11 mM) at a flow rate of 1.2 mL min−1. The suppressor current was set to 90 mA. Anion concentrations were measured with a Dionex DX-600 ion chromatograph on a Dionex Ionpac AS14 column at a flow rate of 1.5 mL min−1. Elution was done with 3.5 mM Na2CO3/1.0 mM NaHCO3 gradient programs. The suppressor current was set at 49 mA.
3. Results and discussion
3.1 Degradation and mineralization of DCF by ozonation and UEO
Generally, after the degradation of DCF, it is broken into other substances, while after its mineralization, it is converted to inorganic compounds, such as H2O, CO2, and NO3−. Experiments were performed to investigate the degradation efficiency of DCF under different processes, including single ozonation and UEO (68, 100, and 200 kHz). The results are presented in Fig. 2. As shown in Fig. 2a, for all the experiments, DCF molecules were quickly degraded in less than 8 min. The introduction of ultrasound could enhance degradation slightly when compared to single ozonation. This enhancement may be due to a decrease in the liquid film thickness and an increase in the mass transfer coefficient caused by ultrasound.21 Although DCF pollutants can be easily degraded by ozonation, it is difficult to mineralize DCF completely. For example, Moreira2 reported that DCF (0.1 mM) was completely degraded in 5 min of ozonation, but the extent of mineralization was only 40% after 3 h. Vogna22 studied DCF (1 mM) degradation by ozonation and observed complete degradation after 8 min, but the extent of mineralization was only 32% after 1.5 h.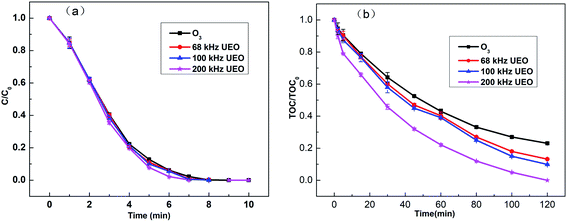 | ||
| Fig. 2 (a) Normalized concentration (C/C0) and (b) normalized TOC content (TOC/TOC0) of DCF in aqueous solution (C0: 20 mg L−1) as a function of time. | ||
UEO was introduced to investigate the improvement in the mineralization efficiency. In Fig. 2b, the normalized TOC (TOC/TOC0) as a function of time is shown for DCF (TOC0 = 10.6 mg L−1). The single ozonation mineralization rate reached 77% after 120 min. All ultrasound frequencies can enhance DCF mineralization, and 200 kHz UEO can lead to complete mineralization after 120 min. Hydroxyl radicals are more powerful oxidants with an electrochemical oxidation potential of 2.80 V in comparison to 2.07 V for ozone. Consequently, ozone can open aromatic compounds though its reaction with the intermediates (carboxylic acid and carbonyl compounds) is slow. Thus, these intermediates cannot be completely oxidized by molecular ozone and due to their accumulation, they become the major components of TOC residues.2,23 Therefore, in this study, single ozonation was considered as a useful process for eliminating the parent compound but not the intermediates. The higher mineralization of DCF by UEO may be due to the generation of more ˙OH radicals, which are less selective and stronger oxidants than ozone. Moreover, ˙OH can react with the intermediates, such as small-chain organic acids. These results indicate that UEO and ozonation have different oxidation mechanisms, which need further investigation.
The first-order kinetic expression is generally used to investigate reaction kinetics due to its accuracy and simplicity.24 Therefore, the following first-order kinetic expression was used to describe the DCF degradation reaction rate:
| r = dC/dt = kKC/(1 + kC) | (1) |
| ln(C0/C) = kt | (2) |
The synergy index is a quantitative way to evaluate enhanced processes4,24,25 and can be defined as follows:
 | (3) |
Based on the above-mentioned equations, the results of the degradation kinetics and synergy indices are summarized in Table 1. The rate constants kU and kUEO increased with the increase in ultrasound frequency. The synergy indices of different frequencies were between 1.17 and 1.84, and 200 kHz-UEO had the best synergistic effect (1.84), suggesting a clear synergistic effect of the UEO process.
| Ultrasound frequency (kHz) | kO (min−1) | kU (min−1) | kUEO (min−1) | f |
|---|---|---|---|---|
| 68 | 0.0135 | 3.76 × 10⁻⁴ | 0.0163 | 1.17 |
| 100 | 3.43 × 10⁻⁴ | 0.0175 | 1.26 | |
| 200 | 4.46 × 10⁻⁴ | 0.0256 | 1.84 |
3.2 Enhanced UEO mechanism
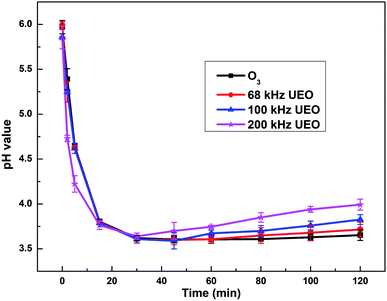
For all the processes, a sharp decrease in pH in the first 30 min indicated the generation of hydrogen ions and electrolysis of carboxylic acid derivatives, which was also reported by Hartmann for the degradation of diclofenac by sonolysis in the presence of catalysts.27 The pH later increased because some of the carboxylic acids were mineralized to CO2 and eliminated from the saturated carbonate solution. The pH for 200 kHz UEO decreased more sharply and increased to a greater extent in comparison with that for ozonation, which indicated the stronger mineralization capacity of 200 kHz UEO. Single ozonation did not lead to a significant increase in pH at the end, which might indicate that the intermediate derivatives, such as carboxylic acid, are hardly mineralized by single ozonation due to lower ˙OH generation at a low pH.
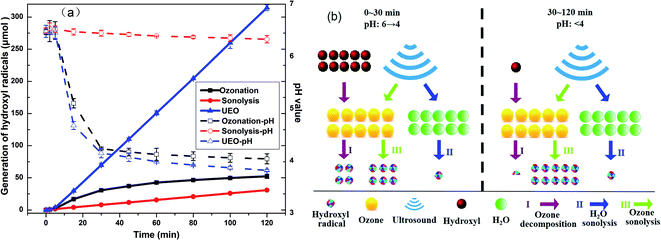 | ||
| Fig. 4 (a) Generation of hydroxyl radicals and evolution of pH and (b) comparison of ˙OH generation rate in three ways by UEO at different times and pH. | ||
From the above-mentioned discussion, we can infer that ˙OH might be generated in three ways by UEO, as shown in Fig. 4b.
(I) Ozone decomposition:7,11,16,31 ozone reacts with hydroxyl groups (pH > 3) in the same manner as that in single ozonation (eqn (4)–(8)).
| O3 + H2O → 2˙OH + O2 | (4) |
 | (5) |
 | (6) |
 | (7) |
 | (8) |
(II) H2O sonolysis:7,11,31 this way is weaker than the other two ways (eqn (9)–(12)).
| H2O + ))) → ˙OH + ˙H | (9) |
| ˙OH + ˙H → H2O | (10) |
| 2˙OH → H2O2 | (11) |
| 2˙OH → H2O + O | (12) |
(III) Ozone sonolysis:7,11,31,32 this way can generate radicals constantly (eqn (13)–(15)).
| O3 + ))) → O2 + O (atomic) | (13) |
| O (atomic) + H2O → 2˙OH | (14) |
| O3 + H2O + ))) → O2 + 2˙OH | (15) |
These results strongly indicate the crucial role of ultrasound, which can sonolyze H2O and ozone to increase the generation of ˙OH even at a low pH.
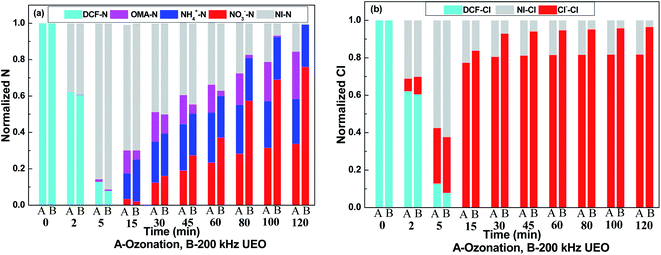
To check the evolution of nitrogen and chlorine, the normalized balance of nitrogen and chlorine is shown in Fig. 6. Nitrites were below the detection limit in all of the experiments (not shown). It was expected that nitrites (if formed) were readily transformed into nitrates in the strongly oxidizing environment. From Fig. 6a, we can infer that there is barely any generation of inorganic nitrogen in the first 5 min; then, the concentrations of nitrates and ammonium increase over the following experiment. The faster increase in the concentration of nitrates indicated the strong oxidizing capacity of UEO. Hofmann37 found that ammonium was formed in stoichiometric concentrations and nitric acid and nitrous acid could not be detected via heterogeneous catalytic oxidation with H2O2 to degrade DCF. The formation of ammonium was assumed to be a radical substitution process. ˙OH reacted with DCF to form intermediates, such as phenol derivatives and ˙NH2. Then, ˙NH2 reacted with H2O to form ammonium. Aniline derivatives were the common intermediates of DCF degradation. Then, ammonium and nitrate ions were detected in aniline derivative degradation by UEO.38 Ammonium and benzoquinone were assumed to be the products of aniline degradation. As a product of aniline oxidation, nitrobenzene released nitrate during its further degradation to benzoquinone. From the above-mentioned discussion, the evolution of nitrogen in the reaction could be proposed as follows: (1) DCF was degraded to aniline derivatives; (2) aniline derivatives were degraded to benzoquinone, and ammonium was released; (3) aniline derivatives were degraded to nitrobenzene and further degradation released nitrate; (4) aniline derivatives underwent ring-opening to form nitrogen-containing acids, such as OXA, which could be further degraded to nitrate by ˙OH.
As shown in Fig. 6b, the concentration of chlorine increases during the experiment and barely increases after 30 min. Also, 80% of dechlorination by ozonation indicated the formation of ozone-persistent chloride, which could be degraded by the ˙OH radicals generated by UEO. Strong dechlorination by ˙OH and ozone was also observed by Vogna22 who used UV/H2O2 and ozone to oxidize DCF.
3.3 Mineralization energy efficiency and control indicator of the self-sequential reaction
 | (16) |
The MEE values of ozonation, single UEO and sequential UEO are summarized in Table 2. The results showed that ozonation had the highest MEE (173 mg (kW h)−1) without complete mineralization. Only 200 kHz sequential UEO could be used for complete mineralization. Three of the sequential UEOs led to complete mineralization, while 1 h O3 followed by 1 h UEO had the best MEE (113 mg (kW h)−1), which was 37% higher than that of single 200 kHz UEO (82 mg (kW h)−1). The results show that sequential UEO is an effective treatment to save energy for complete mineralization.
| Process | ΔTOC (mg L−1) | E (kW h) | MEE (mg (kW h)−1) | Complete mineralization | |
|---|---|---|---|---|---|
| Ozonation | 8.13 | 0.141 | 173 | No | |
| Single UEO | 68 kHz UEO | 9.17 | 0.409 | 72 | No |
| 100 kHz UEO | 9.36 | 0.414 | 73 | No | |
| 200 kHz UEO | 10.57 | 0.418 | 82 | Yes | |
| Sequential UEO | 0.5 h O3 + 1.5 h UEO | 10.57 | 0.349 | 91 | Yes |
| 0.75 h O3 + 1.25 h UEO | 10.57 | 0.314 | 101 | Yes | |
| 1 h O3 + 1 h UEO | 10.57 | 0.279 | 113 | Yes | |
| 1.33 h O3 + 0.67 h UEO | 9.83 | 0.234 | 126 | No | |
| 1.67 h O3 + 0.33 h UEO | 8.98 | 0.187 | 144 | No | |
 | (17) |
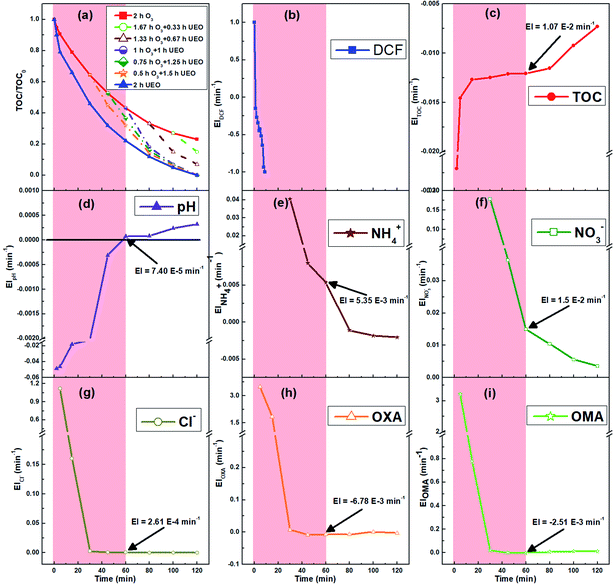
To intuitively compare the time points of ultrasound irradiation in different sequential UEOs and the break point of the candidate judgment indices, all results are shown in Fig. 7. From Fig. 7a, we can infer that the introduction of ultrasound before 60 min can lead to complete mineralization, and 60 min is the best time point for ultrasound irradiation. Eight candidate judgment indices were studied, as shown in Fig. 7b–i; EIDCF ends before 8 min. EICl−, EIOXA and EIOMA barely change after 30 min. The break points of these four judgment indices are earlier than the best time point. EITOC has a later break point, which cannot lead to complete mineralization. EINO3− has no significant break point during the reaction. EINH4+ changes from positive to negative at the time point ca. 80 min, which cannot lead to complete mineralization. EIpH changes from negative to positive at the time point ca. 58 min, coinciding with the best time point (60 min) for ultrasound irradiation. Furthermore, pH can be quickly measured using automatic monitoring equipment in engineering applications. Thus, pH is chosen as the best judgment index of the self-sequential UEO process for indicating the time point of ultrasound irradiation.
4. Conclusions
In conclusion, ultrasound efficiently enhanced ozonation for the mineralization of DCF, and 200 kHz UEO was demonstrated to be the most efficient treatment for the rapid degradation and complete mineralization of DCF pollutants. UEO generated ˙OH through ozone decomposition, H2O sonolysis, and ozone sonolysis. Moreover, these continuously formed ˙OH radicals from UEO could react with ozone-resistant compounds such as OXA and OXM, resulting in complete mineralization. By reducing the ultrasound irradiation time, self-sequential UEO was demonstrated to be an energy-efficient solution for the complete mineralization of DCF. At the base of complete mineralization, the best sequential UEO (1 h O3 + 1 h UEO) promoted 37% energy efficiency when compared to single UEO. Finally, based on the analysis of EI, pH was chosen as the judgment index for judging the time point of ultrasound irradiation in self-sequential UEO, which saves the irradiation time during practical applications. The present investigation provides more insights into the development of energy-saving UEO for the mineralization of organic contaminants in wastewater for practical applications.Conflicts of interest
There are no conflicts to declare.Acknowledgements
The financial support of Guangdong Province Science and Technology plan project public welfare fund and ability construction project of China (No. 2016A020221019), the National Nature Science Fund of China (No. 51878290) are greatly appreciated. This work was also supported by Special Fund Project for Science and Technology Innovation Strategy of Guangdong Province (No. 2019B121205004).Notes and references
- M. O. Barbosa, N. F. F. Moreira, A. R. Ribeiro, M. F. R. Pereira and A. M. T. Silva, Water Res., 2016, 94, 257–279 CrossRef CAS PubMed.
- N. F. F. Moreira, C. A. Orge, A. R. Ribeiro, J. L. Faria, O. C. Nunes, M. F. R. Pereira and A. M. T. Silva, Water Res., 2015, 87, 87–96 CrossRef CAS PubMed.
- J. Schwaiger, H. Ferling, U. Mallow, H. Wintermayr and R. D. Negele, Aquat. Toxicol., 2004, 68, 141–150 CrossRef CAS PubMed.
- P. Finkbeiner, M. Franke, F. Anschuetz, A. Ignaszak, M. Stelter and P. Braeutigam, Chem. Eng. J., 2015, 273, 214–222 CrossRef CAS.
- H. Yu, E. Nie, J. Xu, S. Yan, W. J. Cooper and W. Song, Water Res., 2013, 47, 1909–1918 CrossRef CAS PubMed.
- L. Rizzo, S. Meric, D. Kassinos, M. Guida, F. Russo and V. Belgiorno, Water Res., 2009, 43, 979–988 CrossRef CAS PubMed.
- J. L. Wang and L. J. Xu, Crit. Rev. Environ. Sci. Technol., 2012, 42, 251–325 CrossRef CAS.
- M. M. Huber, S. Canonica, G. Park and U. von Gunten, Environ. Sci. Technol., 2003, 37, 1016–1024 CrossRef CAS PubMed.
- M. I. Maldonado, S. Malato, L. A. Pérez-Estrada, W. Gernjak, I. Oller, X. Doménech and J. Peral, J. Hazard. Mater., 2006, 138, 363–369 CrossRef CAS PubMed.
- A. Aguinaco, F. J. Beltrán, J. J. P. Sagasti and O. Gimeno, Chem. Eng. J., 2014, 235, 46–51 CrossRef CAS.
- R. Kıdak and Ş. Doğan, Ultrason. Sonochem., 2018, 40, 131–139 CrossRef PubMed.
- L. Bilińska, M. Gmurek and S. Ledakowicz, Chem. Eng. J., 2016, 306, 550–559 CrossRef.
- S. Zhou, L. Bu, Z. Shi, C. Bi and Q. Yi, Chem. Eng. J., 2016, 306, 719–725 CrossRef CAS.
- O. Hamdaoui and E. Naffrechoux, Ultrason. Sonochem., 2008, 15, 981–987 CrossRef CAS PubMed.
- G. Ji, B. Zhang and Y. Wu, J. Hazard. Mater., 2012, 225–226, 1–7 CrossRef CAS PubMed.
- R. Poblete, I. Oller, M. I. Maldonado, Y. Luna and E. Cortes, J. Environ. Chem. Eng., 2017, 5, 114–121 CrossRef CAS.
- O. Gimeno, J. F. García-Araya, F. J. Beltrán, F. J. Rivas and A. Espejo, Chem. Eng. J., 2016, 290, 12–20 CrossRef CAS.
- P. Puspita, F. Roddick and N. Porter, Chem. Eng. J., 2015, 268, 337–347 CrossRef CAS.
- R. Flyunt, A. Leitzke, G. Mark, E. Mvula, E. Reisz, R. Schick and C. von Sonntag, J. Phys. Chem. B, 2003, 107, 7242–7253 CrossRef CAS.
- F. Zhang, C. Wei, Y. Hu and H. Wu, Sep. Purif. Technol., 2015, 156, 625–635 CrossRef CAS.
- H. Zhang, L. Duan and D. Zhang, J. Hazard. Mater., 2006, 138, 53–59 CrossRef CAS PubMed.
- D. Vogna, R. Marotta, A. Napolitano, R. Andreozzi and M. D Ischia, Water Res., 2004, 38, 414–422 CrossRef CAS PubMed.
- T. E. Agustina, H. M. Ang and V. K. Vareek, J. Photochem. Photobiol., C, 2005, 6, 264–273 CrossRef CAS.
- S. F. Xiong, Z. L. Yin, Z. F. Yuan, W. B. Yan, W. Y. Yang, J. J. Liu and F. Zhang, Ultrason. Sonochem., 2012, 19, 756–761 CrossRef CAS PubMed.
- J. Madhavan, P. S. S. Kumar, S. Anandan, M. Zhou, F. Grieser and M. Ashokkumar, Chemosphere, 2010, 80, 747–752 CrossRef CAS PubMed.
- S. Wang, F. Shiraishi and K. Nakano, Chem. Eng. J., 2002, 87, 261–271 CrossRef CAS.
- J. Hartmann, P. Bartels, U. Mau, M. Witter, W. V. Tümpling, J. Hofmann and E. Nietzschmann, Chemosphere, 2008, 70, 453–461 CrossRef CAS PubMed.
- A. Ziylan and N. H. Ince, Chem. Eng. J., 2013, 220, 151–160 CrossRef CAS.
- H. Zhang, Y. Lv, F. Liu and D. Zhang, Chem. Eng. J., 2008, 138, 231–238 CrossRef CAS.
- T. M. Olson and P. F. Barbier, Water Res., 1994, 28, 1383–1391 CrossRef CAS.
- M. Gągol, A. Przyjazny and G. Boczkaj, Chem. Eng. J., 2018, 338, 599–627 CrossRef.
- L. K. Weavers and M. R. Hoffmann, Environ. Sci. Technol., 1998, 32, 3941–3947 CrossRef CAS.
- S. Garcia-Segura and E. Brillas, Water Res., 2011, 45, 2975–2984 CrossRef CAS PubMed.
- C. A. Orge, M. F. R. Pereira and J. L. Faria, Chem. Eng. J., 2017, 318, 247–253 CrossRef CAS.
- O. Rozas, C. Baeza, K. Núñez, A. Rossner, R. Urrutia and H. D. Mansilla, Sci. Total Environ., 2017, 590, 430–439 CrossRef PubMed.
- P. C. C. Faria, J. J. M. Órfão and M. F. R. Pereira, Appl. Catal., B, 2008, 79, 237–243 CrossRef CAS.
- J. Hofmann, U. Freier, M. Wecks and S. Hohmann, Appl. Catal., B, 2007, 70, 447–451 CrossRef CAS.
- S. Song, Z. He and J. Chen, Ultrason. Sonochem., 2007, 14, 84–88 CrossRef CAS PubMed.
- H. Olvera-Vargas, N. Oturan, D. Buisson and M. A. Oturan, Chemosphere, 2016, 155, 606–613 CrossRef CAS PubMed.
- P. Frangos, H. Wang, W. Shen, Y. Gang, S. Deng, J. Huang, B. Wang and Y. Wang, Chem. Eng. J., 2015, 286, 239–248 CrossRef.
| This journal is © The Royal Society of Chemistry 2020 |

