 Open Access Article
A molecular simulation approach towards the development of universal nanocarriers by studying the pH- and electrostatic-driven changes in the dynamic structure of albumin†
Amit Kumar Srivastava,
Sanjeev K. Gupta *b and
Umesh Kumar
 *a
*a
aSchool of Nano Sciences, Central University of Gujarat, Gandhinagar, 382030, India. E-mail: umesh.kumar@cug.ac.in
bComputational Materials and Nanoscience Group, Department of Physics, St. Xavier's College, Ahmedabad 380009, India. E-mail: sanjeev.gupta@sxca.edu.in
First published on 2nd April 2020
Abstract
To explore the intramolecular interactions of protein, and its folding and unfolding mechanisms, we performed a simulation-based comparative study on albumin at different ionic strengths and pH. In this study, we performed molecular dynamics (MD) simulation for bovine serum albumin (BSA) at five different concentrations of NaCl (10, 20, 30, 40 and 50 mM), and five different pH values (2.0, 3.5, 4.3, 7.4, and 9.0). Herein, our aim was to unravel the effects of both pH and ionic strength on the conformations of the serum albumin structure. Our results indicate the effects of physicochemical factors in promoting conformational changes in the albumin structure, unlocking the hydrophobic sequences for hydrophobic drug binding. The BSA structure showed similarity to its native state in the pH range of 4.5 to 7.4 and at various ionic concentrations of NaCl. In the pH range of 3.5 to 4.5, the BSA structure showed denaturation in a controlled manner, which caused significant conformational changes in the molecular position of its hydrophobic amino acid residues. The resultant 3D structure gives insight into the amino acid trajectories. High denaturation and unstable behavior in the structural and conformational changes of the protein structure were observed at pH 2.0 and pH 9.0. We believe that these results and conditions will be helpful in the development of protein-based universal nanocarriers for the encapsulation of both hydrophilic and hydrophobic drugs.
1. Introduction
Computational chemistry and computational biochemistry are frequently used to comprehend the kinetics of the folding and unfolding of proteins and peptides, and to predict the conformational changes exclusively from amino acid sequence statistics by molecular simulations. The compact folded and unfolded structure of protein are two types of structural protein conformations observed under different experimental conditions, such as pH, ionic strength, solvents and temperature.1–3 In molecular simulation depicting the intramolecular interactions between different amino acids through various force fields, the principle of the folding and unfolding motion of protein can be solved and explained theoretically on a fundamental level, and can also be explained numerically for every molecule in a protein.1,4 Hence, in simulation, one can simulate and analyze the protein trajectory in time (most preferably in nanoseconds) by molecular dynamics (MD) simulation and analyze the conformational changes in the protein structure due to folding and unfolding.5,6 The study of the mechanism of the folding and unfolding of the protein structure is beneficial for new research and innovation in the field of biochemistry.7 Generally, the protein gets denatured at highly acidic or low pH, resulting in pH-dependent, protein misfolding associated biological imbalances such as the formation of amyloid fibrils in the case of Alzheimer's disease and type-2 diabetes.4,8–10The conformational changes in the protein structure causes subtle changes in its potential energy, which is reflected by the unfolding or folding of the protein. In most cases, the intermediate conformational states are unstable but give insight into the protein structure.10 However, the analysis and characterization of these protein intermediate conformational structures are very challenging and difficult.3,11 By analyzing the protein intermediates, we can instantaneously generate an idea of the protein structure based on the resultant of conformation transformation coordinates.12–15
BSA (bovine serum albumin) is the most common and extensively utilized protein in the field of computational and wet lab research, and has been subjected to vigorous research for application in pharmaceuticals. Various models have been proposed for pH-driven conformational changes in the BSA structure. According to a previous study, BSA immersed in aqueous solution is transformed from N (normal) model → to F (fast) model → to E (expanded) model, depending on the different physico-chemical factors, primarily pH. These inter-model transitions are isomeric transitions of the native BSA structure with a decrease in pH ranging from 8.0 to 2.7 at different pH intervals.16–18 Moreover in an alkaline environment, the other conformational and structural isomers of BSA such as the B (basic) and A (aged) forms are found at pH 8.0 and 10.0 or higher, respectively.12 Different characterization techniques such as electron microscopy, circular dichroism, fluorescence spectroscopy, and small-angle scattering are commonly used to explore the mechanism behind the inter-model transitions of the protein (BSA) conformational structure.13,19–21 Despite the continuous efforts and research on the protein structure in the field of biochemistry and pharmaceuticals, the factors responsible for the self-assembly, agglomeration, folding, and unfolding of the core hydrophobic residues in the protein structure are still the major focus of many theoretical and experimental studies. The effect of pH, ionic strength and temperature is studied and analyzed individually for the conformational changes in the protein structure (prominently in the secondary and tertiary structure of protein), but no studies have been performed on the combined effect of pH, ionic strength and temperature on the conformational changes of protein and the inter-model protein transitions.22–24 Very few studies have been reported on the inter-model transitions at the molecular level for the conformational changes in the protein structure, which are dependent on both the ionic strength and pH.1,25,26
The tertiary structural motifs of protein refer to its three-dimensional structure. The motif conformations depend on many factors, i.e. the subtle interaction between stabilizing forces such as electrostatic charges, the ionic interaction between the attractive and repulsive charged binding sites, hydrogen bonding between atoms, and salt bridge interaction, which can result in significant changes in the structural confirmation of the protein structure.27,28 By modifying the ionic concentration and electrostatic charges on protein molecules, we can expose the core hydrophobic regions in the original protein structure.29 These structural transitions can theoretically unlock new assemblies of protein structure, which can support the idea of developing universal nanocarriers for the delivery of both hydrophilic and hydrophobic drugs.8,19,30
Thus, to address these issues, we performed a series of MD simulations for bovine serum albumin (PDB 4F5S) to analyze the effect of ionic strength and pH on the conformational structure of protein. We performed molecular simulation to build a model of the protein structure at five different pH, ranging from 2 to 9, at five different ionic strengths of NaCl ranging from 10 mM to 50 mM with a step size of 10 mM. We analyzed the results to investigate the intramolecular interaction and conformational changes in the protein structure. The resultant output trajectory file was further used to visualize the atomic coordinates of the protein structure to study the structural changes in the protein conformations. GROMACS v5.1 was used for the simulation study and the (OPLS/AA) force field (all-atom optimized potential for liquid simulations) environment was used to study the interactions among the different atoms of the protein.
2. Methods
2.1 MD simulation protocol
25 MD simulations of 25 ns each were carried out using the GROMACS v5.1 software and OPLS/AA force field parameters.31,32 The first simulation process included simulation studies on the conformational changes in BSA due to the effect of pH and ionic strength. The second phase involved finding and predicting the inter-model transitions in the core hydrophobic sequences based on the analysis of the trajectory files. The protein structure file (pdb) for BSA (PDB ID 4F5S) in the desired pH range was prepared using the pKa scale and visualized in VMD 1.9.3. Initially, the BSA protein structure containing 9338 atoms was neutralized with the desired number of Na+ and Cl− atoms according to the required ionic concentration of NaCl ranging from 10 mM to 50 mM. The BSA was immersed in a TIP3P water box containing 491084 water molecules with box dimensions of 17 × 7 × 7 nm3 using the GROMACS software. Each of the water boxes was energy minimized for 5000 steps using the conjugate gradient method at a temperature of 300 K, and then the simulation was continued in the NPT and NVT ensemble setting the Langevin piston pressure control at 1.0 bar and 300 K with the Nose–Hoover temperature coupling method for 1 ns without any condition. The Langevin damping coefficient was set at 5 ps−1 and piston decay was set at 50 fs.1,4,27,33 Periodic boundary conditions and the particle-mesh Ewald method were applied for a complete electrostatic calculation. In each simulation, the temperature was maintained at 300 K. A 10 Å cutoff was applied for the calculation of non-bonded interactions in the protein structure simulation with a switching function at 8 Å.16,26,34In the GROMACS molecular simulation process, the simulation was carried out with an integration time step of 2 fs using the SETTLE algorithm. The trajectory of the protein atom coordinates was stored every 2 ps and further investigated with the VMD software together with the topology and trajectory script of the protein denatured state to calculate the root mean square deviations (RMSD), and the radius of gyration, potential energy, Ramachandran plot, and 3D analysis of the protein structure. A detailed description of the simulation protocol is shown in the flow chart in Fig. S1 (see ESI†) and Table 1 presents the detailed information for the MD simulation.
| System | Ionic strength | Total no. of ions | No. of ions (neutralized condition) |
|---|---|---|---|
| BSA in water | 10 mM | 30Na+, 30Cl− | 16Na+, 0Cl− |
| BSA in water | 20 mM | 60Na+, 60Cl− | 32Na+, 0Cl− |
| BSA in water | 30 mM | 89Na+, 89Cl− | 48Na+, 0Cl− |
| BSA in water | 40 mM | 119Na+, 119Cl− | 64Na+, 0Cl− |
| BSA in water | 50 mM | 149Na+, 149Cl− | 80Na+, 0Cl− |
2.2 pKa calculations
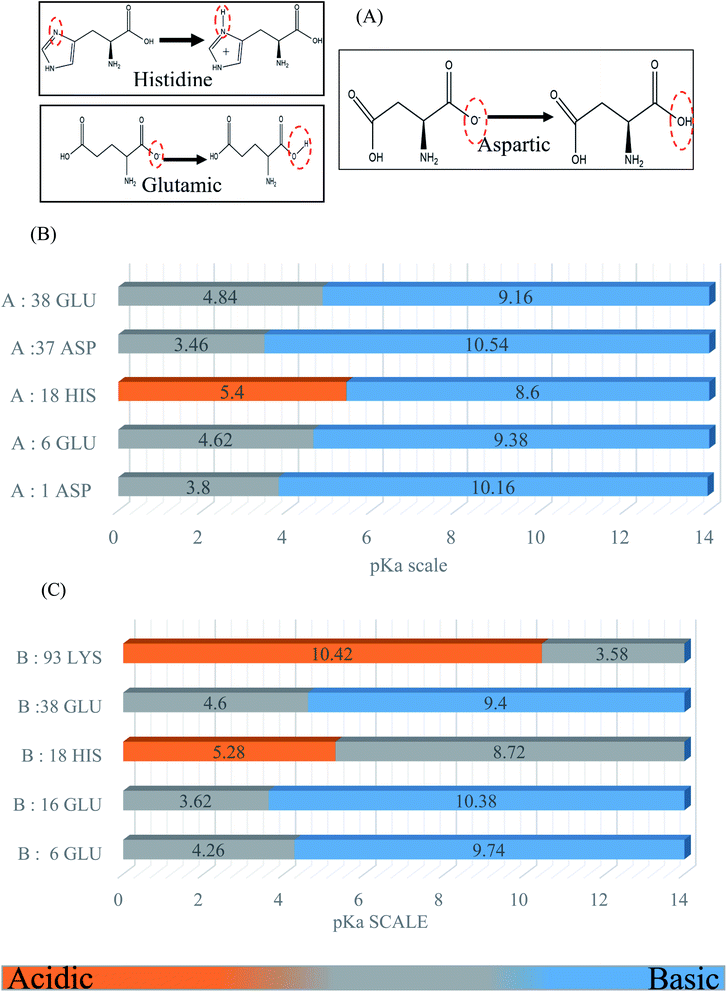
BSA possesses a large number of ionizable residues, which are responsible for the protonation in the protein diagram. There are 36 aspartic acid, 62 glutamic acid and 24 arginine with 59 lysine, which show a total negative charge of −16e in aqueous solution at a pH close to 7.4.33,35,36 Also, besides these acidic and basic amino acid residues in the primary sequences, there are many other residues such as histidine, cysteine and tyrosine, which can exist in either the positively and negatively charged or neutral phases. For the molecular dynamics simulation, we calculated the pKa to select the desired protonation state for each simulated model using the Propka software. The following diagram and graph show the protonation states of the different amino acid residues at pH 4.3. The energies of the protonation states were calculated (Fig. 1) using the Poisson–Boltzmann continuum electrostatic method.37,383. Results and discussion
3.1 Simulated BSA models at various pH and ionic concentrations
The results of the simulated BSA coordinates were obtained and compared from the PDB 4F5S structure, crystallized at pH 7.5 and resolved at 2.30 Å. For this, the BSA protein structure was immersed in a 17 × 7 × 7 nm3 box of TI3P water molecules for the expansion of the protein structure in the long axis of the rectangular box or simulation box. The 1![[thin space (1/6-em)]](https://www.rsc.org/images/entities/char_2009.gif) :
:![[thin space (1/6-em)]](https://www.rsc.org/images/entities/char_2009.gif) 1 salt effect was included to neutralize the solution by the addition of NaCl molecules. The protonation states of the protein structure were kept constant in the simulated model for each pH. Using the steepest descent algorithm, the protonation model for each protein structure was energetically stabilized.4,8,16,17,27,39,40 The equilibration process was performed for each protein structure for at least 1 ns in water at 300 K and 1 atm bar for the NVT and NPT ensembles. The molecular dynamics simulation was run for 25 ns at a constant temperature of 300 K. The Nose–Hoover temperature coupling method was applied for pH ranging from 2.0 to 9.0 (2.0, 3.5, 4.3, 7.4, and 9.0) at various ionic concentrations (10 mM to 50 mM) with a step size of 10 mM each.
1 salt effect was included to neutralize the solution by the addition of NaCl molecules. The protonation states of the protein structure were kept constant in the simulated model for each pH. Using the steepest descent algorithm, the protonation model for each protein structure was energetically stabilized.4,8,16,17,27,39,40 The equilibration process was performed for each protein structure for at least 1 ns in water at 300 K and 1 atm bar for the NVT and NPT ensembles. The molecular dynamics simulation was run for 25 ns at a constant temperature of 300 K. The Nose–Hoover temperature coupling method was applied for pH ranging from 2.0 to 9.0 (2.0, 3.5, 4.3, 7.4, and 9.0) at various ionic concentrations (10 mM to 50 mM) with a step size of 10 mM each.
3.2 Structural analysis of the MD trajectories
The trajectory files for 25 ns of each 25 simulated model were converted to the pdb structure through the GROMACS software and visualized through the VMD program. For analysis of the coordinates of the protein molecule, the simulation was carried out with the integration time stamp of 2 ps. Most of the analysis was done through the VMD and GROMACS software in the OPLS/AA force field. The leapfrog integration was used for the Verlet function method to generate the topology and trajectory files for the changes in the conformational structure of the protein.
 | (1) |
The RMSD and Rg values were calculated through the MD trajectories using the best fit coordinates of the backbone atoms of the simulated protein models in different ionic and pH environments.4,33,36 The 3D structural analysis was performed with two types of representation for a better understanding of the 3D structure. The first 3D representation is based on the ‘new ribbon method’. Fig. 2(A) and (B) show the 3D structure of the original BSA and simulated BSA protein at 4.3 pH and 10 mM ionic concentration, respectively. The amino acid residue color used is the default color representation in the color scale of VMD. BSA possesses some hydrophobic residues, which are ALA (blue), GLY (white), ILE (green), LEU (pink), MET (yellow), PHE (purple), PRO (ochre), TRP (silver), TYR (green), and VAL (tan). According to the analysis of the 3D structure, we can easily observe the conformational changes in the simulated BSA protein. In the pH range of 3.5 to 4.3, the core hydrophobic amino acids are unlocked, providing an easy target for hydrophobic drug binding.
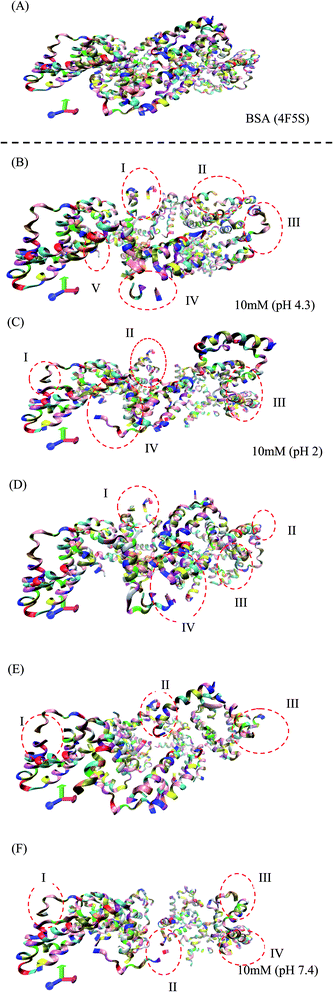 | ||
| Fig. 2 (A) 3D structure of the original BSA structure (4F5S). (B–F) Simulated BSA protein at pH 4.3, 2.0, 3.5, 7.4, and 9.0, respectively, and 10 mM ionic concentration. | ||
In Fig. 2(B–F), I, II, III, IV, and V are the regions/motifs showing the conformational changes in the amino acid residues. The different colors represent the different amino acid residues in the simulated protein structure. Most of the residues are hydrophobic. Also, the changes in the position of the different hydrophobic residues such as ALA, GLY, ILE, LEU, MET, PRO, PHE, VAL, TYR and TRP can be obviously seen. Additionally, the compactness together with the conformational changes in the protein structure can be seen. In some places, either the protein structure is in the folded/unfolded state or it shows the denatured state of protein structure due to the environmental effect of different pH and ionic strength. The detailed 3D structure and changes in the conformations of all the simulated conditions can be seen in the ESI (Fig. S2–S27).†
3.3 Electrostatic calculations
The ionic concentration or electrostatic charges in the BSA transition models were analyzed in the MD simulation process. Each model has specific net charges irrespective of its ionic concentration. The net charges are dependent on the pH value of the protein models. The best crystallization conditions, where the net charge on the BSA structure is neutral is in the pH range of 4.3 to 7.4.41 The higher the pH value, the greater the net negative charge on the protein model, whereas the opposite is true for lower pH values.33,39,42 The electrostatic calculation was performed based on the following equation:
 | (2) |
| pH | Charge (Q) |
|---|---|
| 2.0 | +105e |
| 3.5 | +96e |
| 4.3 | +10e |
| 7.4 | −16e |
| 9.0 | −20e |
3.4 RMSD (root mean square deviation)
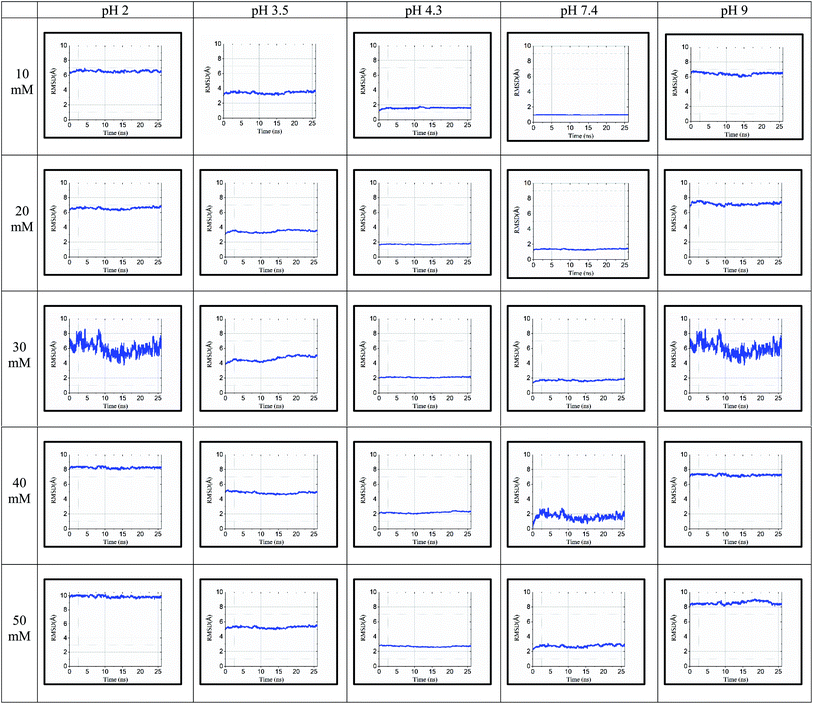
We calculated the RMSD values using the backbone atoms of the simulated trajectories. Fig. 3 shows the RMSD graph for 25 simulated conditions, with each having an ionic strength ranging from 10 mM to 50 mM and pH ranging from 2.0–9.0.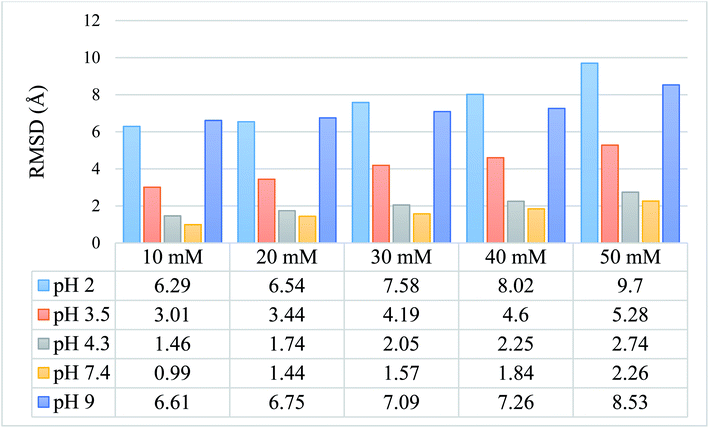 | ||
| Fig. 3 Graphical and tabulated representation of the RMSD values for 25 simulated protein models for pH 2.0, 3.5, 4.3, 7.4, and 9.0 and ionic strength of 10 mM, 20 mM, 30 mM, 40 mM, and 50 mM. | ||
The RMSD values shown in tabulated form in Fig. 3 are described graphically in Fig. 4. Denaturation of the protein structure was found to occur mostly at pH 2.0 and pH 9.0, which showed high RMSD values with an increase in ionic strength. The pH of 7.4 was shown to result in the most stable structure and less fluctuation in the RMSD value since the isoelectric point is around pH 7.4.41 Further, as the ionic strength increased, the RMSD values also increased at pH 7.4. Although the relationship between ionic strength and RMSD was directly proportional at all pH, the magnitude of the RMSD was drastically different at pH = 2 and 9. The calculated RMSD results show that BSA maintained its native state in the pH range of 4.3 to 7.4. In the pH range of 3.5 to 4.3, the BSA structure showed RMSD values ranging from 1.46 to 5.28 Å. This pH range is the most preferable range for the study of the unlocking of the hydrophobic region of the BSA structure. The potential energy curve also shows the stable energy minimization at a higher ionic concentration in this pH range. In the pH range of 3.5 to 4.3, the RMSD value did not increase significantly, even after increasing the ionic strength, which showed a similar structure to the native protein structure. Thus, the RMSD calculation results show that ionic strength has a direct influence on the RMSD values, and an increase in the ionic strength will increase the RMSD value regardless of the pH range.
 | ||
| Fig. 4 RMSD for 25 simulated conditions at pH 2.0, 3.5, 4.3, 7.4, and 9.0 and different ionic strengths of 10 mM, 20 mM, 30 mM, 40 mM and 50 mM. | ||
3.5 Radius of gyration (Rg)
The ‘gmx gyrate’ function was used to compute the radius of gyration of the simulated protein structure and the radii of gyration about the x, y, z axes as a function of time. We used Rg as a parameter to describe the equilibrium conformation of the total system. It is a sign of the protein structure compactness or folding and unfolding states in term of simulated timescale. The radius of gyration of the simulated system predicts the secondary structure conformations, which are compactly packed or loosely unfolded in the three-dimensional structure of the protein.In Fig. 5, the continuous timescale in the gyration graph depicts the folded state, while the unstable or fluctuated timescale indicates the unfolded state of the protein structure at that particular timescale (nano second frame). For instance, at 10 mM and pH of 3.5, the protein is in the folding or stable state up to 5 ns of simulation. After 5 ns, the peaks fluctuated, which started showing the unstable or unfolding state of the protein structure.
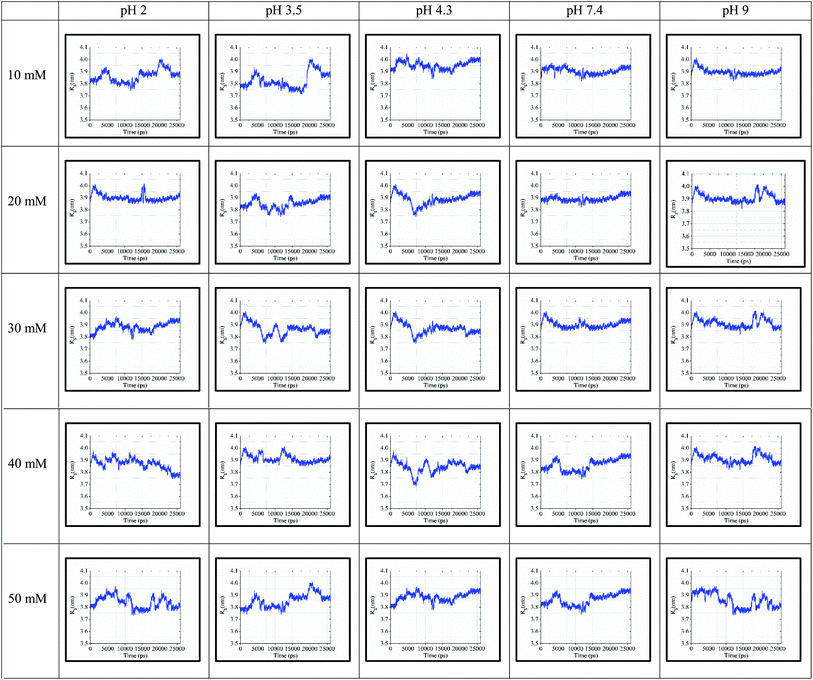 | ||
| Fig. 5 Rg values for 25 simulated conditions with pH of 2.0, 3.5, 4.3, 7.4, and 9.0 and different ionic strengths ranging from 10–50 mM. | ||
3.6 Ramachandran plot
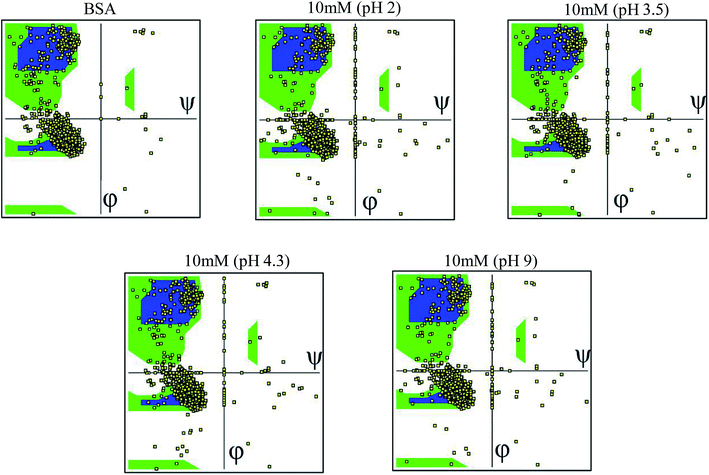
The Ramachandran plot was plotted in 2D to analyze the changes in the coordinates of the beta sheets, right-handed alpha helix and the left-handed alpha helix through the VMD program for each 25 simulated condition. The Ramachandran plot was used to visualize the energetically activated coordinate regions for the backbone dihedral angles ψ against φ of the amino acid residues in the simulated protein structure. We analyzed and confirmed the changes in the conformational structure of the protein structure together with the changes in the coordinates of the amino acid present in the protein and close contacts between the different atoms or molecules. The comparative images shown in Fig. 6 explore the differences in the residues coordinated in each simulated condition. The difference in the coordinates increased with an increase in ionic concentration at both extremes of the pH range, i.e. at very high pH and very low pH. Each Ramachandran plot represents the change in the position of the amino acid residue coordinates due to the effect of different pH and ionic strength. At pH 9.0 and pH 2 (at different ionic concentrations ranging from 10 mM to 50 mM), the amino acid residues show significant structural changes in their β sheets together with the drastic transition of right-handed α helix to left-handed alpha helix. This behavior explains the high denaturation of the protein structure or most significant conformational changes at pH 9.0 and pH 2.0. For the simulation at pH 3.5 and 4.3, the amino acid residues showed a shift in their atomic position prominently in the same coordinates, which explains the unfolding and folding behavior of the protein structure in a controlled manner. This will be helpful to unlock the core hydrophobic region in the protein structure for drug loading without disrupting its function. The other Ramachandran plots are shown in the ESI, Fig. S28–S52.†4. Conclusions
Our study showed some new insight into the important factors responsible for the folding, unfolding and assembly of the protein structure. Ionic strength and pH both play an important role in the conformational changes in the protein structure. When the protein structure is highly charged due to a low pH and high ionic strength, the strong intramolecular electrostatic repulsions induce denaturation of the protein structure. Similar outcomes were found in the case of high pH and high ionic strength, where the RMSD values indicate the highly denatured state. Interestingly, in the pH range of 3.5 to 4.3, denaturation occurred in a controlled manner, which unlocks the core hydrophobic residues of the protein structure. We analyzed the potential energy of each condition to determine the stability of the protein structure for further aggregation or denaturation. Further, decreasing the environmental pH to 7.4 and simulating the bovine serum albumin structure provided the least interactive or most stable model in a way that is driven by electrostatic changes, resulting in the introduction of a core hydrophobic region. Thus, studying the electrostatic potential and ionic strength together with the counter ions of the protein structure may be a very helpful approach for protein and drug binding, especially for hydrophobic drug binding studies.In this molecular simulation work, the structural conformation of BSA molecules at different ionic strength and pH was simulated, visualized and investigated from the perspective of a bio-computational approach. Our findings show that specific physico-chemical conditions trigger the unfolding of the core hydrophobic residues due to the protonation state and electrostatic charges on the protein structure.
The molecular simulations in this work unlock the computational biochemistry area, which can serve as a platform for predicting the beginning of aggregation before unfolding of the core hydrophobic region in proteins. These results significantly shed light on the fundamental understanding and behavior of the folding, unfolding and assembly of amino acids and the intramolecular conformational changes within the protein structure. They are also helpful in understanding the role of protein folding and unfolding in various medical conditions, such as amyloid formation in Alzheimer's disease.
Future studies will emphasize whether these conformational changes in the protein structure can provide binding sites for drugs in various albumin isoforms towards the development of a new concept of universal nanocarriers for the delivery both hydrophobic and hydrophilic molecules for targeted drug delivery.
Conflicts of interest
There are no conflicts to declare.Acknowledgements
Amit Kumar Srivastav would like to thank University Grant Commission (UGC) for providing non-net fellowship.References
- S. H. Lin, W. Cui, G. L. Wang, S. Meng, Y. C. Liu, H. W. Jin, L. R. Zhang and Y. Xie, Drug Des., Dev. Ther., 2016, 10, 2973–2987 CrossRef PubMed
.
- P. J. Stansfeld, Curr. Opin. Struct. Biol., 2017, 45, 133–141 CrossRef PubMed
.
- H. Xu, Z. Tang, Y. Zuo, F. Xiong, K. Chen, H. Jiang, C. Luo and H. Zhang, J. Biomol. Struct. Dyn., 2019, 1–10, DOI:10.1080/07391102.2019.1591303
.
- S. OŁdziej, C. Czaplewski, A. Liwo, J. A. Vila and H. A. Scheraga, in Comprehensive Biophysics, 2012, pp. 494–513, DOI:10.1016/b978-0-12-374920-8.00126-0
.
- S. Páll and B. Hess, Comput. Phys. Commun., 2013, 184, 2641–2650 CrossRef
.
- X. Dong, D. Klimov and E. Blaisten-Barojas, Mol. Simul., 2007, 33, 577–582 CrossRef
.
- G. Ciccotti and L. Delle Site, Soft Matter, 2019, 15, 2114–2124 RSC
.
- E. Shakhnovich, Chem. Rev., 2006, 106, 1559–1588 CrossRef PubMed
.
- M. V. Khan, S. M. Zakariya and R. H. Khan, Int. J. Biol. Macromol., 2018, 112, 217–229 CrossRef PubMed
.
- A. Sharma, K. R. Meena and S. S. Kanwar, Int. J. Biol. Macromol., 2018, 107, 2131–2140 CrossRef PubMed
.
- A. B. Rubenstein, K. Blacklock, H. Nguyen, D. A. Case and S. D. Khare, J. Chem. Theory Comput., 2018, 14, 6015–6025 CrossRef PubMed
.
- R. Srivastava and M. S. Alam, Int. J. Biol. Macromol., 2018, 107, 1519–1527 CrossRef
.
- T. Chatterjee, A. Pal, S. Dey, B. K. Chatterjee and P. Chakrabarti, PLoS One, 2012, 7, e37468 CrossRef
.
- N. Nahida Islam, A. Sharma, G. Gyawali, R. Kumar and S. Rick, J. Chem. Theory Comput., 2019, 15, 4623–4631 CrossRef
.
- J. Lee, P. L. Freddolino and Y. Zhang, in From Protein Structure to Function with Bioinformatics, 2017, ch. 1, pp. 3–35, DOI:10.1007/978-94-024-1069-3_1
.
- K. Baler, O. A. Martin, M. A. Carignano, G. A. Ameer, J. A. Vila and I. Szleifer, J. Phys. Chem. B, 2014, 118, 921–930 CrossRef
.
- S. Donnini, F. Tegeler, G. Groenhof and H. Grubmuller, J. Chem. Theory Comput., 2011, 7, 1962–1978 CrossRef
.
- L. Gou, J. Lee, J. M. Yang, Y. D. Park, H. M. Zhou, Y. Zhan and Z. R. Lu, Int. J. Biol. Macromol., 2017, 105, 1654–1662 CrossRef
.
- A. Michnik, K. Michalik and Z. Drzazga, J. Therm. Anal. Calorim., 2005, 80, 399–406 CrossRef
.
- L. R. Barbosa, M. G. Ortore, F. Spinozzi, P. Mariani, S. Bernstorff and R. Itri, Biophys. J., 2010, 98, 147–157 CrossRef
.
- V. Ferrario and J. Pleiss, J. Biomol. Struct. Dyn., 2019, 37, 1534–1544 CrossRef
.
- M. M. El-Sayed, S. R. Brown, K. Mupparapu and L. Tolosa, Int. J. Biol. Macromol., 2016, 86, 282–287 CrossRef
.
- T. J. Narwani, P. Craveur, N. K. Shinada, A. Floch, H. Santuz, A. M. Vattekatte, N. Srinivasan, J. Rebehmed, J.-C. Gelly, C. Etchebest and A. G. de Brevern, J. Biomol. Struct. Dyn., 2019, 1–15, DOI:10.1080/07391102.2019.1650112
.
- I. Streeter and N. H. de Leeuw, Soft Matter, 2011, 7, 3373–3382 RSC
.
- D. Molodenskiy, E. Shirshin, T. Tikhonova, A. Gruzinov, G. Peters and F. Spinozzi, Phys. Chem. Chem. Phys., 2017, 19, 17143–17155 RSC
.
- U. H. Hansmann and Y. Okamotot, Curr. Opin. Struct. Biol., 1999, 9, 177–183 CrossRef
.
- C. Mucksch and H. M. Urbassek, Langmuir, 2011, 27, 12938–12943 CrossRef CAS
.
- S. He, M. Huang, W. Ye, D. Chen, S. He, L. Ding, Y. Yao, L. Wan, J. Xu and S. Miao, J. Phys. Chem. B, 2014, 118, 12207–12214 CrossRef CAS
.
- G. Rabbani, M. H. Baig, A. T. Jan, E. Ju Lee, M. V. Khan, M. Zaman, A. E. Farouk, R. H. Khan and I. Choi, Int. J. Biol. Macromol., 2017, 105, 1572–1580 CrossRef CAS
.
- S. Haldar, F. Comitani, G. Saladino, C. Woods, M. W. van der Kamp, A. J. Mulholland and F. L. Gervasio, J. Chem. Theory Comput., 2018, 14, 6093–6101 CrossRef CAS
.
- B. Hess, C. Kutzner, D. van der Spoel and E. Lindahl, J. Chem. Theory Comput., 2008, 4, 435–447 CrossRef CAS
.
- S. Páll, M. J. Abraham, C. Kutzner, B. Hess and E. Lindahl, Tackling Exascale Software Challenges in Molecular Dynamics Simulations with GROMACS, Solving Software Challenges for Exascale, International Conference on Exascale Applications and Software, EASC 2014, Lecture Notes in Computer Science, ed. M. Stefano, L. Erwin, Springer, Cham, 2015, pp. 3–27 Search PubMed
.
- N. Diaz and D. Suarez, J. Chem. Theory Comput., 2016, 12, 1972–1988 CrossRef CAS
.
- T. Garel and H. Orlan, Europhys. Lett., 1988, 6, 307–310 CrossRef CAS
.
- G. Navarra, C. Peres, M. Contardi, P. Picone, P. L. San Biagio, M. Di Carlo, D. Giacomazza and V. Militello, Arch. Biochem. Biophys., 2016, 606, 134–142 CrossRef CAS
.
- R. Li, Z. Wu, Y. Wangb, L. Ding and Y. Wang, Biotechnology Reports, 2016, 9, 46–52 CrossRef
.
- Y. N. Vorobjev, J. A. Vila and H. A. Scheraga, J. Phys. Chem. B, 2008, 112, 11122–11136 CrossRef CAS
.
- K. S. Billings, R. B. Best, T. J. Rutherford and J. Clarke, J. Mol. Biol., 2008, 375, 560–571 CrossRef CAS PubMed
.
- G. Paris, C. Ramseyer and M. Enescu, Biopolymers, 2014, 101, 561–572 CrossRef CAS
.
- A. G. Garro, D. M. Beltramo, R. V. Alasino, V. Leonhard, V. Heredia and I. D. Bianco, Int. J. Nanomed., 2011, 6, 1193–1200 CAS
.
- A. Bujacz, Acta Crystallogr., Sect. D: Biol. Crystallogr., 2012, 68, 1278–1289 CrossRef CAS
.
- N. Hagag, E. R. Birnbaum and D. W. Darnall, Biochemistry, 1983, 22, 2420–2427 CrossRef CAS
.
Footnote |
| † Electronic supplementary information (ESI) available. See DOI: 10.1039/d0ra00803f |
| This journal is © The Royal Society of Chemistry 2020 |

