DOI:
10.1039/D0RA01628D
(Paper)
RSC Adv., 2020,
10, 13442-13450
Absorption, fluorescence, Raman spectroscopic and density functional theoretical studies on the singlet and triplet excited state decay of 3-amino-5-mercapto-1,2,4-triazole†
Received
20th February 2020
, Accepted 11th March 2020
First published on 5th April 2020
Abstract
The excited state decay process of N-heterocyclic compounds is attracting increasing attention due to their fundamental applications in pharmaceutical and biological sciences. In this study, 3-amino-5-mercapto-1,2,4-triazole (AMT) was investigated in solid, protic, and aprotic solvents using vibrational and electronic spectroscopies combined with density functional theory (DFT) and time-dependent density functional theory (TDDFT) calculations. The steady absorption and resonance Raman spectra indicated that the AMT structure was quite sensitive to the polarity and proton of the solvent, and the pH environments. The intermolecular hydrogen bonding may contribute significantly to the decay channels of the singlet excited S2(ππ*) state process. Moreover, ns-transient absorption spectroscopy detected the short-time triplet species with ∼200 ns lifetime in solvents. The DFT and TDDFT calculations interpreted the photophysical and photochemical process from the excited S2(ππ*) state, including the singlet and triplet decay mechanisms.
Introduction
1,2,4-Triazole and its derivatives are widely used most notably as antifungals, pharmaceuticals and organic electroluminescent devices.1–3 Furthermore, 1,2,4-triazoles containing nitrogen atoms are easily coordinated with metals. Thus, apart from the biological significance,4 1,2,4-triazoles are also applied to the protection of metals and alloys, such as corrosion inhibition.5–7 Important structured features, such as the planarity (π) and lone pair of electrons on the hetero-atom, are attributed to their strong coordination on the metal surface.8–13 In particular, 3-amino-5-mercapto-1,2,4-triazole (AMT) can be considered as one pull–push electronic structure due to both electron donor (–NH2) and acceptor (–S![[double bond, length as m-dash]](https://www.rsc.org/images/entities/char_e001.gif) C or –SH) groups bridged by one aromatic 1,2,4-triazole ring. Due to the donor–π–acceptor (D–π–A) structure, AMT demonstrates distinguished physical and chemical behaviour besides the above-mentioned characteristics. Moreover, AMT contains both donor and acceptor of hydrogen, which provides the prerequisite to the proton transfer reaction. Proton transfer has long been an issue of fundamental importance. In particular, the excited state proton transfer induces a unique large fluorescence Stokes shift emission due to the dramatic alteration of the structure. The shifts usually can reach as large shift as 6000–1200 cm−1.14 Albinsson et al. reported that the adenosine derivative N6,N6-dimethyladenosine (DMA) had a double fluorescence band located at 330 and 500 nm corresponding to the normal and isomer structures, respectively, in a series of different polar solvents.15 Similarly, 7-azaindole was reported to have double fluorescent bands in water. Shen and Wu16 elaborated that the fluorescence band of the isomer was red-shifted as the pH increased.17 Generally, popular hydrogen bonds (H-bonds) involve a combination of an O–H or an N–H proton donor and an N or an O proton acceptor, which demonstrates the double fluorescent phenomenon and large Stokes shift. However, there are only a few reports on H-bonds that involve a sulfur atom as either the proton donor (–SH) or acceptor (S). The concept of “sulfur participating in an H-bond” appeared in early reports despite the relatively low electronegativity (2.58) for sulfur on the Pauling scale.18–21 Recent quantum chemical calculations in conjunction with high-resolution spectroscopic evidence have revealed that a sulfur-containing H-bond can be as strong as conventional H-bonds.22–24 In biological systems, methionine-containing dipeptides have been reported to form amide–N–H⋯S intermolecular H-bonds that are stronger than amide–N–H⋯ O–C H-bonds.25 Additionally, the strengths of the intermolecular H-bonds in thiobase pairs are reported to be of the same magnitude with the canonical nucleobase pairs.26 As a result, the intermolecular sulfur H-bonds play an important role in artificial DNA or RNA research, and have been applied to RNAi resistant genes27 and proteins. Recently, Chou et al. reported an important 7-hydroxy-2,2-dimethyl-2,3-dihydro-1H-indene-1-thione (DM-7HIT) molecule with O–H⋯S H-bond formation and its excited-state intramolecular H-bond on/off reaction by room-temperature phosphorescence (RTP). The results concluded that DM-7HIT possessed a strong polar (hydroxy)-dispersive (thione)-type H-bond, which opened a new chapter in the chemistry of hydrogen bonds, especially the generality of the sulfur H-bond on/off switching mechanism. Moreover, the tautomerism between 2-thiopyridone (2TP) and 2-mercaptopyridine (2MP) concluded that the excited state proton transfer (ESPT) reaction of 2TP in solvents led to the formation of 2MP transients by nanosecond time-resolved resonance Raman spectroscopy.28 In early 2006, Fu et al. reported the tautomerization of 2-pyridinethione in water, and found that water promoted the proton transfer in the ground state via a bridged hydrogen bonding.29 Recently, we also reported several solvent-dependent hydrogen bonding molecules, i.e., 5-(methylthio)-1,3,4-thiadiazole-2(3H)-thione (MTTN), 3-amino-1,2,4-triazole (3AT), 4,6-dimethyl-2-mercaptopyrimidine (DMMP), and 2-mercaptobenzothiazole by Raman spectroscopy and density functional theory calculations.30–34 These results revealed that solvent hydrogen bonding can stabilize the thione isomers and the thione ↔ thiol tautomerization may occur in a higher excited state, which was greatly controlled by the solvent character and UV light wavelength.
C or –SH) groups bridged by one aromatic 1,2,4-triazole ring. Due to the donor–π–acceptor (D–π–A) structure, AMT demonstrates distinguished physical and chemical behaviour besides the above-mentioned characteristics. Moreover, AMT contains both donor and acceptor of hydrogen, which provides the prerequisite to the proton transfer reaction. Proton transfer has long been an issue of fundamental importance. In particular, the excited state proton transfer induces a unique large fluorescence Stokes shift emission due to the dramatic alteration of the structure. The shifts usually can reach as large shift as 6000–1200 cm−1.14 Albinsson et al. reported that the adenosine derivative N6,N6-dimethyladenosine (DMA) had a double fluorescence band located at 330 and 500 nm corresponding to the normal and isomer structures, respectively, in a series of different polar solvents.15 Similarly, 7-azaindole was reported to have double fluorescent bands in water. Shen and Wu16 elaborated that the fluorescence band of the isomer was red-shifted as the pH increased.17 Generally, popular hydrogen bonds (H-bonds) involve a combination of an O–H or an N–H proton donor and an N or an O proton acceptor, which demonstrates the double fluorescent phenomenon and large Stokes shift. However, there are only a few reports on H-bonds that involve a sulfur atom as either the proton donor (–SH) or acceptor (S). The concept of “sulfur participating in an H-bond” appeared in early reports despite the relatively low electronegativity (2.58) for sulfur on the Pauling scale.18–21 Recent quantum chemical calculations in conjunction with high-resolution spectroscopic evidence have revealed that a sulfur-containing H-bond can be as strong as conventional H-bonds.22–24 In biological systems, methionine-containing dipeptides have been reported to form amide–N–H⋯S intermolecular H-bonds that are stronger than amide–N–H⋯ O–C H-bonds.25 Additionally, the strengths of the intermolecular H-bonds in thiobase pairs are reported to be of the same magnitude with the canonical nucleobase pairs.26 As a result, the intermolecular sulfur H-bonds play an important role in artificial DNA or RNA research, and have been applied to RNAi resistant genes27 and proteins. Recently, Chou et al. reported an important 7-hydroxy-2,2-dimethyl-2,3-dihydro-1H-indene-1-thione (DM-7HIT) molecule with O–H⋯S H-bond formation and its excited-state intramolecular H-bond on/off reaction by room-temperature phosphorescence (RTP). The results concluded that DM-7HIT possessed a strong polar (hydroxy)-dispersive (thione)-type H-bond, which opened a new chapter in the chemistry of hydrogen bonds, especially the generality of the sulfur H-bond on/off switching mechanism. Moreover, the tautomerism between 2-thiopyridone (2TP) and 2-mercaptopyridine (2MP) concluded that the excited state proton transfer (ESPT) reaction of 2TP in solvents led to the formation of 2MP transients by nanosecond time-resolved resonance Raman spectroscopy.28 In early 2006, Fu et al. reported the tautomerization of 2-pyridinethione in water, and found that water promoted the proton transfer in the ground state via a bridged hydrogen bonding.29 Recently, we also reported several solvent-dependent hydrogen bonding molecules, i.e., 5-(methylthio)-1,3,4-thiadiazole-2(3H)-thione (MTTN), 3-amino-1,2,4-triazole (3AT), 4,6-dimethyl-2-mercaptopyrimidine (DMMP), and 2-mercaptobenzothiazole by Raman spectroscopy and density functional theory calculations.30–34 These results revealed that solvent hydrogen bonding can stabilize the thione isomers and the thione ↔ thiol tautomerization may occur in a higher excited state, which was greatly controlled by the solvent character and UV light wavelength.
In this paper, we reported the ground structure and excited state decay dynamics of AMT in different environments using resonance Raman spectra, steady and nanosecond transient absorption spectroscopies combined with theoretical calculation. The decay channels of the singlet excited S2(ππ*) state were investigated by the DFT and TD-DFT calculations.
Experimental and computational methods
3-Amino-5-mercapto-1,2,4-triazole (AMT, solid, purity, 99%) was purchased from J&K Scientific Ltd., China and employed without further purification. UV absorption spectra in water, methanol, and acetonitrile were measured using an ultraviolet/visible spectrometer at a concentration of ∼10−5 mol L−1. The Fourier transform (FT) Raman and FT-IR spectra were obtained using a Thermo Nicolet FT-Raman 960 spectrometer and a PerkinElmer 1 FT-IR spectrometer with 2 cm−1 resolution. For the resonance Raman experiments, the harmonics of a nanosecond Nd:YAG laser and their hydrogen Raman-shifted laser lines were utilized to generate the 239, 245, 252, 266, and 273 nm excitation wavelengths, which have been described previously.28,35,36 The excitation laser beam used a ∼100 μJ pulse energy loosely focused to a 0.5–1.0 mm diameter spot size onto a flowing and circulating liquid stream of sample. Solution-phase samples were used at a concentration of ∼10−3 mol L−1 AMT (99% purity) in water and methanol (≥99.5% purity). The Raman signal was recorded for about 100 s before being read out to an interfaced PC computer; 80–100 of these readouts were combined to obtain a resonance Raman spectrum with a 2 cm−1 resolution. The Raman shifts were calibrated using the known vibrational frequencies of the solvents (i.e., methanol and water).
The complete geometry optimization and vibration analysis were carried out at the B3LYP-D3(BJ)/6-311++G(d,p) level, and the normal-mode analysis of AMT was carried out using the VEDA program.37 The vertical electronic transition energies were performed at the B3LYP(TD)-D3(BJ)/6-311++G(d,p) level. The vertical S0 → Sn transition energy and the Sn minimum were estimated at the B3LYP-TD-D3(BJ)/6-31G* level by employing a self-consistent reaction field (SCRF) and the polarized continuum (overlapping spheres) model (PCM). The ground state and vertical transition computations were obtained using the Gaussian 09 program.38 The minimum energies and optimized geometric structures for S0, S1, S2, and the conical intersection points were calculated using the single-component artificial force-induced reaction (SC-AFIR) method as implemented in the global reaction route mapping (GRRM) program,39 which runs in combination with Gaussian 09. Moreover, to avoid the erroneous description of weak interactions, DFT including long-range dispersion effects (DFT-D3) by Grimme40–42 are involved in all optimized geometries.
Results and discussion
Vibrational spectra
The crystalline AMT structure was initially confirmed by FT-IR and FT-Raman spectra, as shown in Fig. 1(a) and (c). To further assign the experimental spectra, the possible tautomers were calculated at the B3LYP-D3(BJ)/6-311++G(d, P) level. As shown in Fig. S1,† eight monomeric isomers were found and structure (a) is the lowest one in energy. Five possible thiol structures were also obtained, which were lower than thiones (b) and (c) in energy except for structure (a). The vibrational frequencies were further analysed for the optimized structures at the same level. However, only the calculated Raman activity spectra of the most stable monomer are compared in Fig. 1.
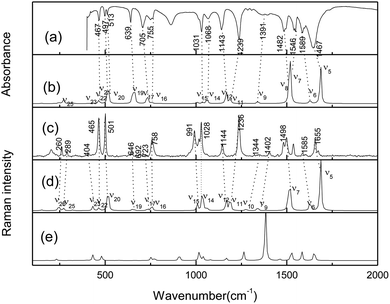 |
| | Fig. 1 (a) FTIR spectrum of the molecule of neat powder in KBr pellet. (b) Calculated IR spectrum of gas thione–AMT monomer (1,4-H-AMT in Fig. S1†). (c) FT-Raman spectrum. (d) Calculated Raman spectrum of gas thione–AMT monomer (1,4-H-AMT in Fig. S1†) and (e) thiol (structure A in Fig. S2†) at the B3LYP-D3(BJ)/6-311++G(d, p) level. | |
As shown in Fig. 1(c), two strong bands were observed at 465 and 501 cm−1 in the 100–920 cm−1 spectral region, which correlate reasonably well to the calculated (scaled) modes at 467 cm−1 (ν22) and 518/513 cm−1 (ν20/ν21). Based on the calculated results, both bands corresponded to the CS stretching vibration, which indicates that AMT existed as a thione structure in the crystal state. The bands with medium intensities observed at 260, 289 and 758 cm−1 correlate reasonably well to 244 (ν26), 271 (ν25), and 757 cm−1 (ν16) calculated at the B3LYP level. Three weak bands observed at 404, 646 and 723 cm−1 correlate reasonably well to the calculated modes at 432 (ν23), 649 (ν19), and 732 cm−1 (ν17). In the 920–1700 cm−1 region, the FT-Raman spectra display three strong bands at 991, 1028, and 1236 cm−1, in good agreement with the calculated modes ν15 at 1008 cm−1, ν14 at 1035 cm−1 and ν11 at 1188 cm−1. Other observed bands at 1144, 1344, 1402, 1498, 1585 and 1655 cm−1 should correspond to the calculated 1166 (ν12), 1275 (ν10), 1340 (ν9), 1517 (ν7), 1628 (ν6), and 1686 (ν5) cm−1, corresponding to the thione monomer in Fig. 1(d). Thus, solid-state AMT can be attributed to exist as a thione monomer in the solid form. Complete assignments are given for the computed and experimental bands in Table S1.†
Resonance Raman experiments were also carried out in different solvents with selected excitation wavelengths. The excitation wavelength was determined according to the ultraviolet absorption band, and the low solubility of AMT in acetonitrile did not meet the requirements of resonance Raman detection, so we did not obtain any spectra in acetonitrile. Fig. 2 displays the 266 nm resonance Raman spectra in water and methanol. Compared to the FT-Raman spectra, the intensities of some Raman bands were greatly altered. In addition, some bands became very broad and could not be resolved due to the effects of the solvents. Fig. 2 compares the 266 nm resonance Raman spectra of AMT in water and methanol (figure shows only the main vibration modes). Calculated vibrational frequencies at the B3LYP-D3(BJ)/6-311++G(d, p) level using the H2O PCM model and assignments of thione AMT in solvents are shown in Table S2.† In methanol and water, the obvious Raman shifts were observed between corresponding peaks. In particular, strong bands at 1004 (ν15), 1219 (ν11), 1493 (ν8), and 1528 (ν7) cm−1 dominated the Raman spectra in water. Conversely, in methanol, strong bands were observed at 989 (ν15), 1212 (ν11), 1494 (ν8), and 1524 (ν7) cm−1. The intense bands were observed at 1319 (ν10) and 1383 (ν9) cm−1 in water, while 1309 (ν10) and 1376 (ν9) cm−1 were the weak bands in methanol. The Raman shifts of these modes were caused by the hydrogen bond between the solvent and AMT molecules. Furthermore, we observed a big difference in water and methanol for ν8, which was assigned to the N2C3/N4C3 stretching combined with H11N4C3/H8N7C3 in-plane bending. Therefore, we confirmed that the hydrogen bond between the solvent and the AMT molecule should be mainly located on both –N4H11O and H9N7H8O groups. In our recent reports, methanol was shown to form stronger hydrogen bonds with solute molecules than water.31,32 Thus, the weakness of ν8 in methanol may be the result of stronger solute–solvent hydrogen bonding. This suggests that structural dynamics are solvent and hydrogen-bonding dependent along the reaction coordinates in the Franck–Condon region.
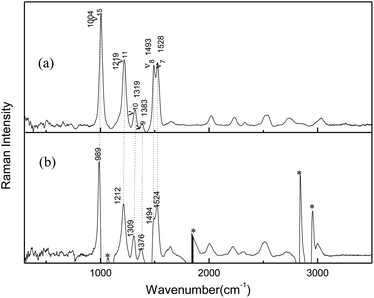 |
| | Fig. 2 266 nm resonance Raman spectra in (a) H2O, (b) CH3OH (asterisks mark regions where solvent subtraction artifacts are present). | |
Fig. 3 presents an expanded view of the 252 nm resonance Raman spectra with the tentative vibrational assignments indicted above the spectra. Most of the 252 nm resonance Raman spectra can be assigned to the fundamentals, overtones, and combination bands of about nine Franck–Condon active vibrational modes: the H6N1N2C3 tors/C3N4C5N1 tors/S10N1N4C5 out ν18, the N2C3N4C5 tors/N7N4N2C3 out ν17, N4C3 stretch/N2C3N4 bend ν15, the N1C5 stretch/S10C5 stretch/H11N4C3 bend/N4C5N1 bend ν11, the N1C5 stretch/H6N1N2 bend ν10, the N4C5 stretch/H6N1N2 bend/H11N4C3 bend ν9, the N2C3 stretch/N4C3 stretch/H11N4C3 bend/H8N7C3 bend ν8, the N1C5 stretch/H6N1N2 bend ν7, and the N2C3 stretch/N7C3 stretch/H9N7H8 bend ν5, as shown in Table S2.†
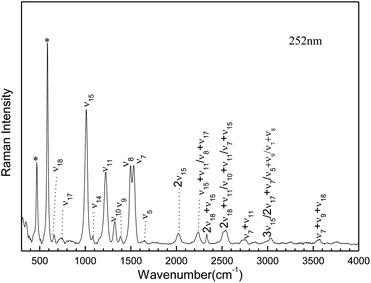 |
| | Fig. 3 Expanded view of 252 nm resonance Raman spectra of AMT in water with the tentative vibrational assignments indicated above the spectrum. | |
Steady absorption spectra
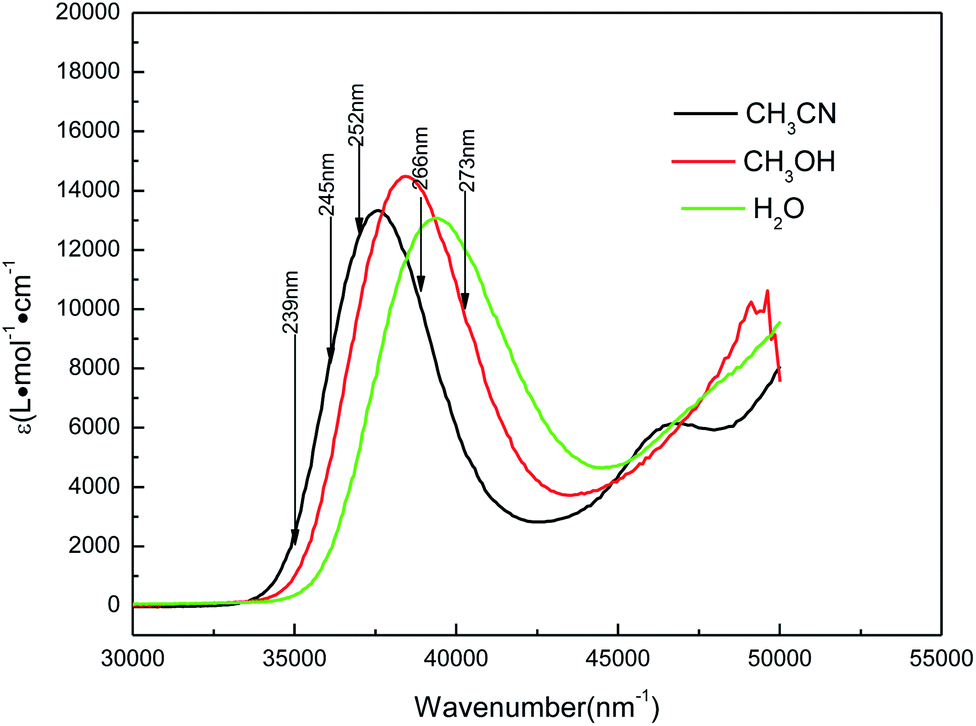
Fig. 4 shows the UV absorption spectra of AMT in acetonitrile, water and methanol solvents. In acetonitrile, the experimental UV spectrum for AMT exhibits one strong absorption band with the maxima at approximately 266 nm (f = 0.1626, ε = 0.985 × 10⁴ L mol−1 cm−1). In methanol, the band absorption appears at 260 nm (f = 0.2953, ε = 1.4472 × 10⁴ L mol−1 cm−1), and it is blue-shifted 6 nm relative to that observed in acetonitrile. In water, the maximum band absorption was blue-shifted to 254 nm (f = 0.3312, ε = 1.1876 × 10⁴ L mol−1 cm−1) relative to that in acetonitrile. The blue-shifts of this band indicated that there was an intermolecular hydrogen bond between the protic solvent molecules and AMT, in addition to the solvent polarity. To simulate the solvent effects on the UV spectra of AMT in solvents, the B3LYP(TD)-D3(BJ)/6-311++G(d, p) calculations employed explicit and implicit solvent polarizable continuum models (PCM).
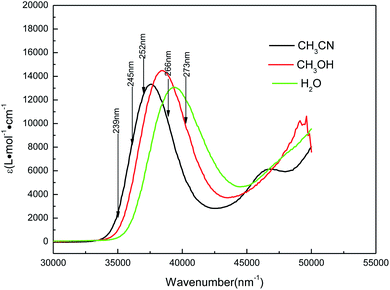 |
| | Fig. 4 UV absorption spectra of AMT in water (green line), methanol (red line), and acetonitrile (black line) with the excitation wavelengths labeled for the resonance Raman spectra. | |
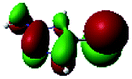
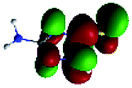
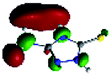
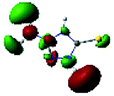
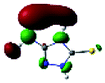
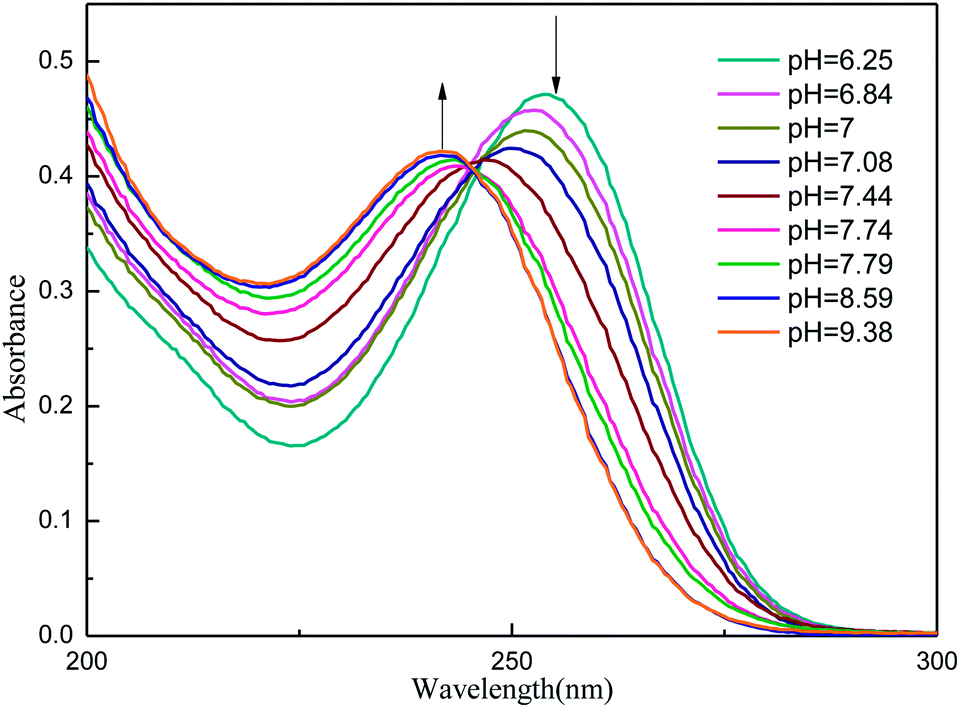
Table 1 lists the computed electronic transition energies, oscillator strengths and their corresponding orbitals of AMT with the PCM model. The calculated S2 electronic transition bands at 252.91 nm (f = 0.3534) in acetonitrile, 252.77 nm (f = 0.3353) in methanol and 252.68 nm (f = 0.3650) in water, respectively, all of which were assigned to π → π* electronic transitions, were in good agreement with the bands observed experimentally. Next, we discussed the change of the absorption spectra at different pH environments in methanol and water. Fig. 5 and S3† show the absorption spectra of AMT in H2O and CH3OH with different volumes of [(Bu)4N]+OH−. At pH = 6.25 in H2O without [(Bu)4N]+OH−, AMT exhibited a strong band at around 254 nm, which represents the normal species. As the pH increased from 6.25 to 7.44, the band at 254 nm was gradually weakened and even disappeared, while the band at 242 nm gradually increased, and no change occurred when pH > 8.59. Wrzosek and Bukowska proved that the single nitrogen atom in the triazole ring of AMT remained protonated even in pH = 12 solution.43–45 Therefore, we speculated that the band at 242 nm may be attributed to the single detached proton, and only the other kept on the triazole ring, which led to the red-shifts of the absorption band. So, we concluded that the AMT is deprotonized in basic solution to form anion monomers.
Table 1 Experimental and calculated singlet electronic transition energies, corresponding orbitals and oscillator strengths with the electronic transition character for the optimized ground AMT at B3LYP(TD)-D3(BJ)/6-311++G(d, p) level
| States |
Orbitals (coefficient) |
Electronic transition |
Transition energy (nm) |
Oscillator strength (f) |
| Calc. |
Expt |
Calc. |
Expt |
| AMT in CH3CN |
| T1 |
30 → 31 (0.68938) |
π → π* |
337.62 |
|
|
|
| T2 |
29 → 31 (0.70333) |
n → π* |
280.57 |
|
|
|
| S1 |
29 → 31 (0.70488) |
n → π* |
269.69 |
|
0.0002 |
|
| T3 |
30 → 34 (0.56829) |
π → π* |
269.59 |
|
|
|
| T4 |
30 → 32 (0.67340) |
π → Ryd1 |
254.49 |
|
|
|
| S2 |
30 → 31 (0.66706) |
π → π* |
252.91 |
266.0 |
0.3534 |
0.1626 |
| 30 → 32 (−0.15659) |
π → Ryd1 |
| 30 → 34 (0.10341) |
π → π* |
| S3 |
30 → 31 (0.14705) |
π → π* |
251.90 |
|
0.0294 |
|
| 30 → 32 (0.66903) |
π → Ryd1 |
| 30 → 33 (0.15603) |
π → Ryd2 |
| S4 |
29 → 32 (0.11813) |
n → Ryd1 |
231.36 |
|
0.0250 |
|
| 30 → 32 (−0.14267) |
π → Ryd1 |
| 30 → 33 (0.66957) |
π → Ryd2 |
 |
 |
 |
 |
 |
 |
|
![[thin space (1/6-em)]](https://www.rsc.org/images/entities/char_2009.gif) |
| AMT in H2O |
| T1 |
30 → 31 (0.68932) |
π → π* |
337.41 |
|
|
|
| T2 |
29 → 31 (0.70340) |
n → π* |
279.92 |
|
|
|
| T3 |
30 → 34 (0.56828) |
n → π* |
269.16 |
|
|
|
| S1 |
29 → 31 (0.70496) |
n → π* |
269.15 |
|
0.0002 |
|
| T4 |
30 → 32 (0.67497) |
π → Ryd1 |
253.94 |
|
|
|
| S2 |
30 → 31 (0.67880) |
π → π* |
252.68 |
254.0 |
0.3650 |
0.3312 |
| 30 → 34 (0.10503) |
π → π* |
| S3 |
30 → 32 (0.68195) |
π → Ryd1 |
251.28 |
|
0.0172 |
|
| 30 → 33 (0.15238) |
π → Ryd2 |
| S4 |
29 → 32 (0.11076) |
n → Ryd1 |
230.80 |
|
0.0249 |
|
| 30 → 32 (−0.14095) |
π → Ryd1 |
| 30 → 33 (0.67140) |
π → Ryd2 |
 |
 |
 |
 |
 |
 |
|
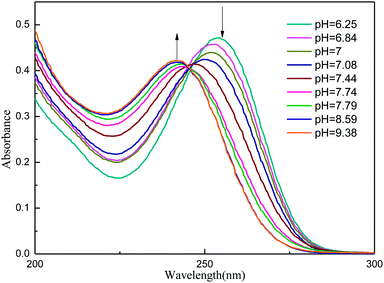 |
| | Fig. 5 UV for AMT (3.95 × 10⁻⁵ mol L−1) in H2O with different volumes of [(Bu)4N]+OH− (1.53 × 10⁻² mol L−1). | |
Transient absorption spectra
Fig. 6 shows the transient absorption spectra obtained at 266 nm excitation wavelength in CH3CN, CH3OH and H2O. Two absorption bands at about 330 and 600 nm appeared in all three solvents. As shown in Fig. 6, the absorption band at ∼600 nm became broad as the polarity of the solvent increased. According to the TD-DFT calculation, two absorption bands corresponded to the lowest triplet 3ππ* transition, as shown in Table S3.† Fig. S4† shows the kinetics of AMT measured at 550 and 600 nm in CH3CN, CH3OH and H2O. The decay time for AMT in acetonitrile was 274 ns, 140 ns in methanol and 153 ns in water. AMT has a ∼120 ns longer lifetime in acetonitrile than in water and methanol. Therefore, in protic solvents, besides the intersystem jumping back to the ground state, there should be other main decay pathways.
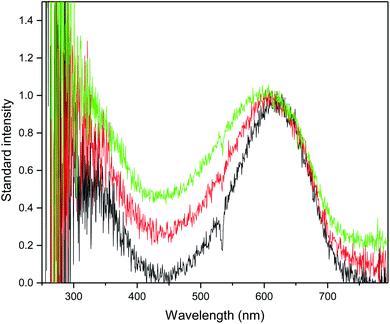 |
| | Fig. 6 Nanosecond transient absorption at 266 nm excitation of AMT in CH3CN (in green), CH3OH (in red) and H2O (in black). | |
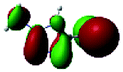
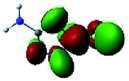
Table 2 lists the computed electronic transition energies, oscillator strengths and their corresponding orbitals of AMT with the PCM model. The calculated electronic transition-allowed band occurred at 565.44 nm (f = 0.1494) in acetonitrile, and the calculated electronic transition-allowed band occurred at 564.82 nm (f = 0.1489) in water, which corresponds to the triplet state transition. This is basically consistent with the experimentally observed absorption of ∼600 nm in solvents.
Table 2 Experimental and calculated triplet electronic transition energies, corresponding orbitals and oscillator strengths with the electronic transition character for the optimized T1 min at the B3LYP(TD)-D3(BJ)/6-31G* level
| States |
Orbitals (coefficient) |
Electronic transition |
Transition energy (nm) |
Oscillator strength (f) |
| Cal. |
Exp. |
Cal. |
| AMT in CH3CN |
| T1 |
29 → 30 (0.99635) |
π → π* |
1125.57 |
|
0.0000 |
| T2 |
28 → 30 (0.97857) |
π → π* |
565.44 |
613 |
0.1494 |
 |
|
| AMT in H2O |
| T1 |
29 → 30 (0.99632) |
π → π* |
1112.52 |
|
0.0000 |
| T2 |
28 → 30 (0.97863) |
π → π* |
564.82 |
600 |
0.1489 |
 |
Excited S2(ππ*) state decay mechanism
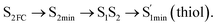
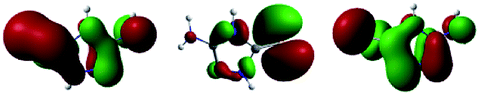
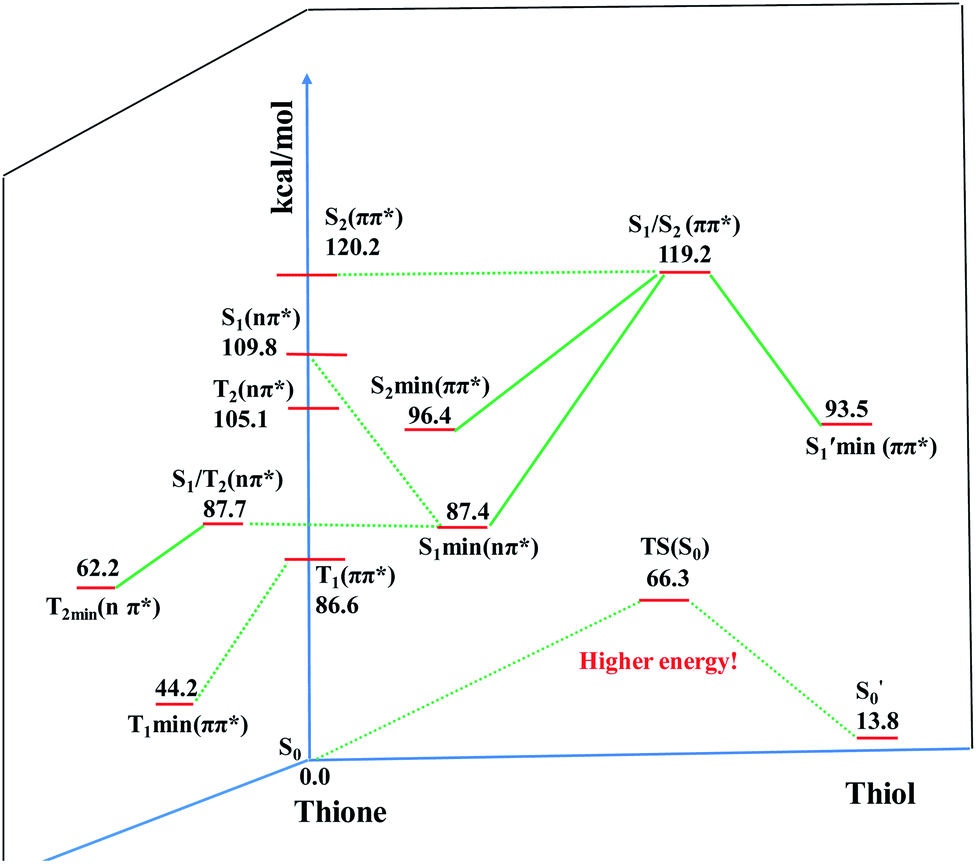
To elaborate the experimental results, ground state structures were initially calculated at the B3LYP-D3(BJ)/6-31G* level. At this level, the ground-state AMT–thiol tautomer is 13.8 kcal mol−1 higher in energy than the AMT–thione tautomer, which is connected via transition state with a barrier of 66.3 kcal mol−1. Therefore, the ground-state proton transfer reaction between AMT–thione and AMT–thiol was inhibited as a result of the high barrier, which is similar to those previously reported for DMMP.32 According to the UV absorption spectrum, the ground AMT molecule was excited to the excited S2(ππ*) state in the Franck–Condon region. Subsequently, it evolved to the lower excited state via internal conversion (IC) or illumination. To further compare the experimental results, excited state decay potential surface profiles on the excited state were calculated, including the excited singlet triplet states as shown in Fig. 7. AMT in the S2(ππ*) state of the Franck–Condon region with an energy of 120.2 kcal mol−1 vibrationally reached S2 min(nπ*/ππ*) with 96.4 kcal mol−1 or  via CI S1/S2(1ππ*/1πRyd) with 119.2 kcal mol−1. This is only 1.0 kcal mol−1 energy difference between them, as shown in Fig. 7. Fig. S5† showed the calculated energies of S0 and 1(ππ*) excited states on the selected ground state IRC points at the B3LYP(TD)-D3(BJ)/6-31G* level. The results show the higher barrier on the 1(ππ*) potential energy surface profile from thione to thiol, which indicated that the thione → thiol isomerization occurred on the CI (S1/S2) point. Table S4† lists the orbitals and transition nature of the 11 structures along the IRC path in detail.
 |
| | Fig. 7 Possible decay pathways of excited state AMT calculated at TD-B3LYP-D3(BJ)/6-31G* level using the H2O PCM model. | |
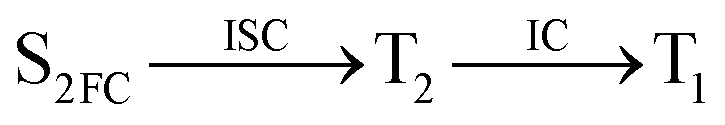
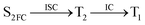
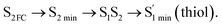
Moreover, the spin–orbit coupling (SOC) constants were calculated between the higher singlet and lower triplet states using the single-particle BP operator with an effective charge approximation in PySOC.46 The calculated SOC value results are shown in Table 3. For ground S0, there is an obvious intersystem crossing (ISC) character due to large SOC constants for S0/T2, S1/T1 and S2/T2. Even for S1 min and S2 min, the ISC process became much easier than ground state. Based on the above-mentioned results, the decay path on the triplet state was calculated to elaborate the decay process on the decay mechanism of the higher excited state S2(ππ*), according to the electronic spectroscopic results. As shown in Fig. 7, AMT was initially excited to S2(ππ*) and then ISC to T2(nπ*) or vibrational relaxation to the dark S1(nπ*) via a fast internal conversion in Franck–Condon region. Then, both T2(nπ*) and S1(nπ*) decayed to the T1(ππ*) state. The calculated spin–orbit coupling constant SOC of S1/T1(1nπ*/3nπ*) was 118 cm−1, which also confirmed that intersystem crossings are quite favorable on the ground state. Another possibility was that the decay occurred from S1(nπ*) to T2(nπ*) states passing through the S1/T2(1nπ*/3nπ*) intersection. Then, the T2(nπ*) vibrationally relaxed to T1(ππ*). However, on the T1 potential energy surface profile shown in Fig. 7, the energy of the thiol  was 38 kcal mol−1 higher than the energy of the thione T1 min(ππ*), so we believe the photophysical process occurred easily from T1 to the ground state. The second path was that after AMT reaches the S2(ππ*) state, an intersystem crossing to the T2(nπ*) state occurred immediately due to the 133 cm−1 SOC constants for S2/T2(1ππ*/3nπ*) calculated at S0. Then, T2(nπ*) vibrationally relaxed to T1(ππ*). The third path was for the excited state proton transfer on the S2 state, where a photochemical reaction might have occurred. In summary, three possible decay channels on S2 are proposed as:
| |
 | (1) |
| |
 | (2) |
| |
 | (3) |
Table 3 Calculated spin-orbital constants (SOC, cm−1) of optimized S0, S1 min and S2 min structures
| |
S0 |
S1 min |
S2 min |
| S0/T1 |
1 |
119 |
117 |
| S0/T2 |
93 |
148 |
143 |
| S1/T2 |
4 |
134 |
110 |
| S1/T1 |
118 |
78 |
72 |
| S2/T2 |
133 |
82 |
75 |
| S2/T1 |
4 |
115 |
121 |
However, these possible pathways require further experimental support, such as transient fluorescence.
Conclusion
In conclusion, resonance Raman spectroscopy was employed to assign the vibrational spectra of 3-amino-5-mercapto-1,2,4-triazole (AMT) in methanol and water by a combination of FT-IR, FT-Raman, UV-vis spectroscopy, and density functional theoretical (DFT) calculations. The FT-Raman spectra confirmed that AMT formed a monomer in its neat solid form. In methanol and water, we speculated that the hydrogen bond between the solvent and the AMT molecule might be at –N4H11O and H9N7H8O, and the Franck–Condon region structural dynamics along various reaction coordinates are solvent dependent. After AMT is excited, we propose three decay channels on the S2 state.| |
 | (1) |
| |
 | (2) |
| |
 | (3) |
The triplet reaction channel may be applied to photodynamic therapy in disease diagnosis and treatment.
Conflicts of interest
There are no conflicts to declare.
Acknowledgements
We gratefully acknowledge financial support from the National Natural Science Foundation of China (Grant No. 21473162). Y. Zhao is grateful for the Project Grants 521 Talents Cultivation of Zhejiang Sci-Tech University. We are also grateful for support from Zhejiang Provincial Top Key Academic Discipline of Chemical Engineering and Technology of Zhejiang Sci-Tech University.
References
- Y. A. Al-Soud, M. N. Al-Dweri and N. A. Al-Masoudi, Synthesis, Antitumor and Antiviral Properties of Some 1,2,4-triazole Derivatives, Rev. Bras. Farmacogn., 2004, 59(10), 775–783 CAS.
- F. Gao, T. Wang and J. Xiao, et al., Antibacterial Activity Study of 1,2,4-triazole Derivatives, Eur. J. Med. Chem., 2019, 173, 274–281 CrossRef CAS PubMed.
- M. Sengar and A. K. Narula, Luminescent lanthanide complexes based on pyridine-2,6-dicarboxamide and 1,2,4-triazole-3-carboxylic acid ligands as F− anion sensor, Sens. Actuators, B, 2017, 241, 567–576 CrossRef CAS.
- W. G. Heim, D. Appleman and H. T. Pyfrom, Production of Catalase Changes in Animals With 3-amino-1,2,4-triazole, Science, 1955, 122(3172), 693–694 CrossRef CAS PubMed.
- B. Kaproń, J. J. Łuszczki and A. Płazińska, et al., Development of the 1,2,4-triazole-based Anticonvulsant Drug Candidates Acting on the Voltage-gated Sodium Channels. Insights From In-vivo, In-vitro, and In-silico Studies, Eur. J. Pharm. Sci., 2019, 129, 42–57 CrossRef PubMed.
- A. Pachuta-Stec, A. Biernasiuk and A. Malm, et al., Synthesis and Antimicrobial Evaluation of Novel Derivatives of Semicarbazide and 1,2,4-triazole, J. Heterocycl. Chem., 2017, 54(5), 2867–2873 CrossRef CAS.
- A. Y. Hassan, M. T. Sarg and A. H. Bayoumi, et al., Synthesis and Anticancer Evaluation of Some Novel 5-amino[1,2,4]triazole Derivatives, J. Heterocycl. Chem., 2018, 55(6), 1450–1478 CrossRef CAS.
- J. G. Haasnoot, Mononuclear Oligonuclear and Polynuclear Metal Coordination Compounds with 1,2,4-triazole Derivatives as Ligands, Coord. Chem. Rev., 2000, 200, 131–185 CrossRef.
- J. Sarkar, J. Chowdhury and G. B. Talapatra, Adsorption of 4-Methyl-4H-1,2,4-triazole-3-thiol Molecules on Silver Nanocolloids: FT-IR, Raman, and Surface-Enhanced Raman Scattering Study Aided by Density Functional Theory, J. Phys. Chem. C, 2007, 111(27), 10049–10061 CrossRef CAS.
- M. A. Quraishi and H. K. Sharma, 4-Amino-3-butyl-5-mercapto-1,2,4-triazole: A New Corrosion Inhibitor for Mild Steel in Sulphuric Acid, Mater. Chem. Phys., 2003, 78(1), 18–21 CrossRef.
- C. Wang, R. Yuan and Y. Chai, et al., Au-nanoclusters Incorporated 3-amino-5-mercapto-1,2,4-triazole Film Modified Electrode for the Simultaneous Determination of Ascorbic Acid, Dopamine, Uric Acid and Nitrite, Biosens. Bioelectron., 2011, 30(1), 315–319 CrossRef CAS PubMed.
- G. Rajkumar and M. G. Sethuraman, A Novel Hybrid Composite Coating of Poly-3-amino-5-mercapto-1,2,4-triazole/TiO2 on Copper for Corrosion Protection, Iran. Polym. J., 2016, 25(2), 119–128 CrossRef CAS.
- P. Piotrowski, B. Wrzosek and K. Agata, et al., A SERS-based pH Sensor Utilizing 3-amino-5-mercapto-1,2,4-triazole Functionalized Ag Nanoparticles, Analyst, 2014, 139(5), 1101–1111 RSC.
- J. Cheng, D. Liu and W. Li, et al., Comprehensive Studies on Excited-State Proton Transfer of a Series of 2-(2′-Hydroxyphenyl)benzothiazole Derivatives: Synthesis, Optical Properties, and Theoretical Calculations, J. Phys. Chem. C, 2015, 119(8), 4242–4251 CrossRef CAS.
- B. Albinsson, Dual Fluorescence From N6,N6-dimethyladenosine, J. Am. Chem. Soc., 1997, 119(27), 6369–6375 CrossRef CAS.
- J. Y. Shen, W. C. Chao and C. Liu, et al., Probing Water Micro-solvation in Proteins by Water Catalysed Proton-transfer Tautomerism, Nat. Commun., 2013, 4(1), 1–7 Search PubMed.
- M. J. Copley, C. S. Marvel and E. Ginsberg, Hydrogen Bonding by S-H. Vll. Aryl Mercaptans, J. Am. Chem. Soc., 1939, 61(11), 3161–3162 CrossRef CAS.
- W. Gordy and S. C. Stanford, Spectroscopic Evidence for Hydrogen Bonds SH, NH and NH Compounds, J. Am. Chem. Soc., 1940, 62, 497–505 CrossRef CAS.
- T. G. Heafield, G. Hopkins and L. Hunter, Hydrogen Bonds Involving the Sulphur Atom, Nature, 1942, 149, 218 CrossRef CAS.
- L. González, O. Mó and M. Yáñez, High-level ab initio Calculations on the Intramolecular Hydrogen Bond in Thiomalonaldehyde, J. Phys. Chem. A, 1997, 101, 9710–9719 CrossRef.
- M. Jabłoński, A. Kaczmarek and A. J. Sadlej, Estimates of the Energy of Intramolecular Hydrogen Bonds, J. Phys. Chem. A, 2006, 110, 10890–10898 CrossRef PubMed.
- A. Nowroozi, H. Roohi, H. Hajiabadi, H. Raissi, E. Khalilinia and M. N. Birgan, O-H···S Intramolecular Hydrogen Bond in Thiomalonaldehyde Derivatives; A Quantum Chemical Study, Comput. Theor. Chem., 2011, 963, 517–524 CrossRef CAS.
- Y. Posokhov, A. Gorski, J. Spanget-Larsen, F. Duus, P. E. Hansen and J. Waluk, The Structure of the Phototransformation Product of Monothiodibenzoylmethane, Chem. Phys. Lett., 2001, 350, 502–508 CrossRef CAS.
- H. S. Biswal and S. Wategaonkar, Nature of the N-H···S Hydrogen Bond, J. Phys. Chem. A, 2009, 113, 12763–12773 CrossRef CAS PubMed.
- J. Šponer, P. Jurečka and P. Hobza, Accurate Interaction Energies of Hydrogen-bonded Nucleic Acid Base Pairs, J. Am. Chem. Soc., 2004, 126, 10142–10151 CrossRef PubMed.
- A. Villalobos, J. E. Ness, C. Gustafsson, J. Minshull and S. Govindarajan, Gene Designer: A Synthetic Biology Tool for Constructing Artificial DNA Segments, BMC Bioinf., 2006, 7, 285 CrossRef PubMed.
- D. Kumar, C. Gustafsson and D. F. Klessig, Validation of RNAi Silencing Specificity Using Synthetic Genes: Salicylic Acid-binding Protein 2 is Required for Innate Immunity in Plants, Plant J., 2006, 45, 863–868 CrossRef CAS PubMed.
- R. Du, C. Liu and Y. Zhao, et al., Resonance Raman Spectroscopic and Theoretical Investigation of the Excited State Proton Transfer Reaction Dynamics of 2-Thiopyridone, J. Phys. Chem. B, 2011, 115(25), 8266–8277 CrossRef CAS PubMed.
- F. U. Aiping, L. I. Hongliang and D. U. Dongmei, Thiol-thione Tautomerism in 2-pyridinethione: Effect of Hydration, J. Mol. Struct., 2006, 767(1), 51–60 Search PubMed.
- X. Liu, X. Wei and H. Zhou, et al., UV and Resonance Raman Spectroscopic and Theoretical Studies on the Solvent-Dependent Ground and Excited-State Thione → Thiol Tautomerization of 4,6-Dimethyl-2-mercaptopyrimidine (DMMP), J. Phys. Chem. A, 2018, 122(26), 5710–5720 CrossRef CAS PubMed.
- S. Meng, A. Duan and J. Xue, et al., UV-Vis, Fluorescence, and Resonance Raman Spectroscopic and Density Functional Theoretical Studies on 3-Amino-1,2,4-Triazole: Microsolvation and Solvent-Dependent Nonadiabatic Excited State Decay in Solution, J. Phys. Chem. A, 2018, 122(43), 8530–8538 CrossRef CAS PubMed.
- S. Meng, Y. Zhao and J. Xue, et al., Environment-dependent Conformation Investigation of 3-amino-1,2,4-triazole (3-AT): Raman Spectroscopy and Density Functional Theory, Spectrochim. Acta, Part A, 2018, 190, 478–485 CrossRef CAS PubMed.
- S. Pang, Y. Zhao and L. Xin, et al., Solvent-dependent dynamics of hydrogen bonding structure 5-(methylthio)-1,3,4-thiadiazole-2(3H)-thione as determined by Raman spectroscopy and theoretical calculation, Spectrochim. Acta, Part A, 2017, 171, 470–477 CrossRef CAS PubMed.
- X. Wei, A. Duan and Y. Deng, et al., Excited-state proton transfer via higher excited state in 2-mercaptobenzothiazole: absorption, fluorescence, Raman spectroscopic study, and theoretical calculation, J. Raman Spectrosc., 2019, 2–7 Search PubMed.
- X. M. Zhu, S. Q. Zhang and X. Zheng, et al., Resonance Raman study of short-time photodissociation dynamics of the charge-transfer band absorption of nitrobenzene in cyclohexane solution, J. Phys. Chem. A, 2005, 109(13), 3086–3093 CrossRef CAS PubMed.
- X. Zheng and D. L. Phillips, Photoisomerization reaction of CH2 BrI following A-band and B-band photoexcitation in the solution phase: transient resonance Raman observation of the iso-CH2 I–Br photoproduct, J. Chem. Phys., 2000, 113(8), 3194–3203 CrossRef CAS.
- M. H. Jamróz, Vibrational Energy Distribution Analysis (VEDA): Scopes and Limitations, Spectrochim. Acta, Part A, 2013, 114, 220–230 CrossRef PubMed.
- M. J. Frisch, G. W. Trucks, H. B. Schlegel, G. E. Scuseria, M. A. Robb, J. R. Cheeseman, G. Scalmani, V. Barone, B. Mennucci and G. A. Petersson, et al., Gaussian 09, Revision D.01, Gaussian, Inc., Wallingford, CT, 2009 Search PubMed.
- S. Maeda, K. Ohno and K. Morokuma, Systematic Exploration of the Mechanism of Chemical Reactions: the Global Reaction Route Mapping (GRRM) Strategy using the ADDF and AFIR Methods, Phys. Chem. Chem. Phys., 2013, 15, 3683–3701 RSC.
- S. Grimme, Semiempirical GGA-type Density Functional Constructed with a Long-range Dispersion Correction, J. Comput. Chem., 2006, 27, 1787–1799 CrossRef CAS PubMed.
- S. Grimme, J. Antony and S. Ehrlich, et al., A Consistent and Accurate ab initio Parametrization of Density Functional Dispersion Correction (DFT-D) for the 94 Elements H-Pu, J. Chem. Phys., 2010, 132, 154104 CrossRef PubMed.
- L. Goerigk, A. Hansen, C. Bauer, S. Ehrlich, A. Najibi and S. Grimme, A Look at the Density Functional Theory Zoo with the Advanced GMTKN55 Database for General Main Group Thermochemistry, Kinetics and Noncovalent Interactions, Phys. Chem. Chem. Phys., 2017, 19, 32184–32215 RSC.
- R. J. Xavier and E. F. T.-I. R. Gobinath, FT-Raman, ab initio and DFT Studies, HOMO–LUMO and NBO Analysis of 3-amino-5-mercapto-1,2,4-triazole, Spectrochim. Acta, Part A, 2012, 86, 242–251 CrossRef CAS PubMed.
- B. Wrzosek, J. Cukras and M. A. Dobrowolski, et al., Real Chemical States of the 3-Sulfur Derivative of 1,2,4-Triazole in Different Conditions: Complex Experimental and Theoretical Studies, J. Phys. Chem. C, 2017, 121(17), 9282–9295 CrossRef CAS.
- B. Wrzosek and J. Bukowska, Molecular Structure of 3-Amino-5-mercapto-1,2,4-triazole Self-Assembled Monolayers on Ag and Au Surfaces, J. Phys. Chem. C, 2007, 111(46), 17397–17403 CrossRef CAS.
- X. Gao, S. Bai, D. Fazzi, T. Niehaus, M. Barbatti and W. Thiel, Evaluation of Spin-Orbit Couplings with Linear-Response Time-Dependent Density Functional Methods, J. Chem. Theory Comput., 2017, 13(2), 515–524 CrossRef CAS PubMed.
Footnote |
| † Electronic supplementary information (ESI) available. See DOI: 10.1039/d0ra01628d |
|
| This journal is © The Royal Society of Chemistry 2020 |
Click here to see how this site uses Cookies. View our privacy policy here. 
 Open Access Article
 This Open Access Article is licensed under a Creative Commons Attribution-Non Commercial 3.0 Unported Licence
 *
*


 via CI S1/S2(1ππ*/1πRyd) with 119.2 kcal mol−1. This is only 1.0 kcal mol−1 energy difference between them, as shown in Fig. 7. Fig. S5† showed the calculated energies of S0 and 1(ππ*) excited states on the selected ground state IRC points at the B3LYP(TD)-D3(BJ)/6-31G* level. The results show the higher barrier on the 1(ππ*) potential energy surface profile from thione to thiol, which indicated that the thione → thiol isomerization occurred on the CI (S1/S2) point. Table S4† lists the orbitals and transition nature of the 11 structures along the IRC path in detail.
 was 38 kcal mol−1 higher than the energy of the thione T1 min(ππ*), so we believe the photophysical process occurred easily from T1 to the ground state. The second path was that after AMT reaches the S2(ππ*) state, an intersystem crossing to the T2(nπ*) state occurred immediately due to the 133 cm−1 SOC constants for S2/T2(1ππ*/3nπ*) calculated at S0. Then, T2(nπ*) vibrationally relaxed to T1(ππ*). The third path was for the excited state proton transfer on the S2 state, where a photochemical reaction might have occurred. In summary, three possible decay channels on S2 are proposed as: