 Open Access Article
Amphiphilic irinotecan–melampomagnolide B conjugate nanoparticles for cancer chemotherapy†
Wenhao Qu‡
a,
Quanjun Yang‡c,
Guanchun Wang‡a,
Zhaohong Wanga,
Ping Huang*ab,
Wei Huang *a,
Rong Zhang*b and
Deyue Yan
 a
a
aSchool of Chemistry and Chemical Engineering, State Key Laboratory of Metal Matrix Composites, Shanghai Jiao Tong University, 800 Dongchuan Road, Shanghai 200240, China. E-mail: hw66@sjtu.edu.cn; hp158@sjtu.edu.cn
bDepartment of Obstetrics and Gynecology, Fengxian Hospital, Southern Medical University, Shanghai 201499, China. E-mail: rongzhang@163.com
cDepartment of Pharmacy, Shanghai Jiao Tong University Affiliated Sixth People's Hospital, 600 Yishan Road, Shanghai 200233, China
First published on 2nd March 2020
Abstract
Melampomagnolide B (MMB) is a natural sesquiterpene lactone product structurally related to parthenolide (PTL). Although MMB has been widely used to treat various types of cancers, such as glioma, leukemia and colon cancer, the effective delivery of MMB to cancer cells remains a challenge. An amphiphilic drug–drug conjugate (ADDC) strategy has been proposed and developed as a promising drug self-delivery system for cancer therapy because of its simple preparation, carrier-free nature, and high therapeutic activity. Herein, we present a new ADDC, which is synthesized by linking the hydrophilic anticancer drug irinotecan (Ir) and the hydrophobic anticancer drug MMB through a carbonate bond. The obtained amphiphilic irinotecan–melampomagnolide B conjugate (Ir–C–MMB) can self-assemble in water into stable nanoparticles with an average diameter of around 122.1 nm. After cellular uptake, the carbonate bond between the hydrophilic drug and hydrophobic drug can be cleaved to release free Ir and MMB under acidic conditions, which exhibit a synergistic effect in tumor cells. MTT results reveal that the Ir–C–MMB nanoparticles can effectively inhibit proliferation of cancer cells. The apoptosis data indicate that the apoptosis rate of cells treated with Ir–C–MMB nanoparticles is about 50% within 24 h, which is much higher than that of free Ir or MMB. Our results suggest that this ADDC strategy could be used as a drug delivery platform for MMB and its derivatives, and that it offers effective synergistic therapeutic efficacy.
Introduction
Currently, cancer remains a primary cause of mortality around the world.1 Among various cancer treatments, chemotherapy is still an efficient approach due to its systemic therapeutic efficacy. Over many decades, a significant number of natural products and their derivatives have been successfully developed as clinically effective cancer chemotherapeutic agents,2,3 such as the taxanes, the camptothecins, the bis-indole alkaloids and the sesquiterpene lactones. Recently, the sesquiterpenes lactones including parthenolide (PTL),4 helenalin5 and constunolide6 have been extracted from various medicinal plants and reported as anticancer agents. PTL, originally isolated from the medicinal herb Feverfew (Tanacetum parthenium), is a typical member of the sesquiterpene lactones, having noteworthy antiproliferative activity against many types of human cancers, such as breast,7,8 liver,9,10 lung,11 brain,12 prostate,13 pancreas,14 and bone.15 The anticancer activity of PTL is believed to be primarily associated with its ability to inhibit the transcription factor NF-κB,16,17 which controls multiple tumor-related processes (e.g. inflammation, angiogenesis, proliferation, and metastasis)18 and increases reactive oxygen species (ROS) through inhibition of the glutathione pathway.19,20An analog of PTL, melampomagnolide B (MMB), is isolated from Magnolia grandiflora and can also be synthesized from PTL via selenium oxide oxidation of the C10 methyl group of PTL.21 It has been shown to possess similar anticancer properties to PTL.22 However, MMB is a more intriguing molecule than PTL because of the presence of a primary 14-hydroxyl group, which can be conveniently structurally modified without loss of the anticancer activity to overcome the poor water-solubility and bioavailability of MMB.23 Crooks et al.24 reported a series of novel carbamate derivatives of MMB synthesized by using heteroaromatic amines, which generally showed improved water-solubility compared to MMB. Meanwhile, most of these derivatives exhibited notable growth inhibition properties against a number of human cancer cell lines. However, like other traditional small molecule anticancer drugs, MMB and its derivatives have various drawbacks, such as rapid blood/renal clearance, adverse side effects, nonspecific selectivity, and poor accumulation in tumors. To resolve these issues, many nanoscale vehicles, e.g., polymeric nanoparticles,25–28 liposomes,29,30 vesicles,31,32 and inorganic materials33 can be used as drug carriers to achieve a better therapeutic efficacy and lower side-effects compared with free drugs. However, these nanocarriers have no therapeutic activity by themselves and may cause some side-effects in normal organs in the course of degradation, metabolism, and excretion. Recently, our group reported a new amphiphilic drug–drug conjugate (ADDC) concept and developed a series of drug self-delivery systems for cancer therapy, in which anticancer drugs could be delivered by themselves without any carriers.34–41 Thus, it should be facile, effective and promising to construct an MMB drug self-delivery system for cancer therapy by using the ADDC strategy.
To achieve the above goal, we designed and synthesized a new ADDC, irinotecan–melampomagnolide B conjugate (Ir–C–MMB), by linking the hydrophilic anticancer drug irinotecan (Ir) and the hydrophobic anticancer drug MMB through a carbonate bond. Ir–C–MMB could self-assemble into nanoparticles in water (Scheme 1). Ir is a potent DNA topoisomerase I inhibitor which induces the death of cancer cells through DNA damage and transcription,34,35 while MMB kills cancer cells by inhibiting the transcription factor NF-κB.22 When the nanoparticles entered cancer cells, the carbonate bond could be cleaved through hydrolysis to release Ir and MMB to kill the cancer cells (Scheme 1). Through the formation of the nanoparticles, some drawbacks of the free drugs, such as poor water-solubility, short half-life, and low selectivity toward tumor tissues, could be overcome efficiently.
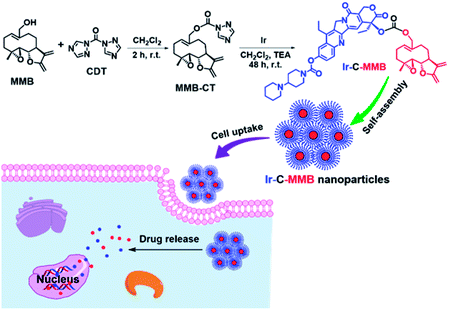 | ||
| Scheme 1 The synthetic route for Ir–C–MMB and the schematic process of its self-assembly into nanoparticles for cancer chemotherapy. | ||
Experimental
Materials
Ir was obtained from Shanghai Knowshine Pharmachemical Inc. MMB was supplied by Shanghai Sixth People's Hospital. N,N′-Carbonyl-di-(1,2,3-triazole) (CDT) was purchased from Aladdin. McCoy's 5A medium, 0.25% pancreatin, fetal bovine serum (FBS), penicillin-streptomycin liquid (100×), 3-(4,5-dimethyl-2-thiazolyl)-2,5-diphenyl-2H-tetrazolium bromide (MTT), and phosphate-buffered saline (PBS) were purchased from Sigma-Aldrich (St. Louis, MO, USA). The Annexin V-FITC apoptosis assay kit and RNase were provided by Beyotime Institute of Biotechnology. Dialysis tubes (MWCO = 2000 Da) were purchased from Lvniao Tech. Polystyrene plates (6- and 96-well) were provided by Chinese Sangon Biotech. Dimethyl sulfoxide (DMSO) was dried by calcium hydride for 24 h before use. Other reagents and solvents were used without any purification.Measurements
1H and 13C NMR spectra were recorded on a Bruker HD 400 MHz spectrometer with deuterium chloroform (CDCl3) as a solvent. Liquid chromatography-mass spectrometry (LC-MS) was performed on a Water ACQUITY UPLC system, which contained a binary solvent delivery manager and a sample manager, and a Waters Q-TOF Premier Mass Spectrometer equipped with an electrospray interface. Fluorescence spectra were measured on a QC-4-CW spectrometer, produced by Photon Technology International, Inc. (USA/CAN). The excitation wavelength was set at 360 nm according to the maximum intensity obtained in the excitation spectra. The step increment was set at 2 nm in the range of 365–710 nm, and the scan speed was set at 480 nm min−1. Ultraviolet-visible (UV-Vis) absorption spectra were recorded on a PerkinElmer Lambda 20 spectrometer at a scan speed of 480 nm min−1. The Fourier transform infrared (FTIR) spectra were recorded on a PerkinElmer Paragon 1000 spectrophotometer using the tableting method at room temperature, over a scan range of 4000 to 400 cm−1. Dynamic light scattering (DLS) measurements were obtained on a Malvern Zetasizer Nano ZS90 apparatus at room temperature, which was equipped with a 125 mW laser light. All samples were irradiated at λ = 633 nm and measured at a scattering angle of 90°. Transmission electron microscopy (TEM) studies were carried out on a JEOL JEM-100CX-II instrument at the testing voltage of 200 kV. The samples were prepared by spraying a little sample solution (0.5 mg mL−1) onto the carbon-coated copper grid, and then drying in air overnight.Synthesis of MMB–CT intermediate
In brief, MMB (0.352 g, 1.33 mmol) and CDT (0.436 g, 2.66 mmol) were dissolved in dried CH2Cl2, and the mixture was stirred at room temperature for 8 h. Then 10 mL of deionized water was added and the aqueous mixture was extracted using CH2Cl2 (50 mL) to remove the unreacted CDT. The organic layer was washed using deionized water (3 × 10 mL) and dried over anhydrous Na2SO4. Then the solution was filtered and the filtrate was concentrated under vacuum to give the white target product (386 mg, yield: 80.7%). 1H NMR (400 MHz, CDCl3) δ (ppm): δ 8.83 (s, 1H), 8.05 (s, 1H), 6.24 (d, J = 3.3 Hz, 1H), 5.90 (t, J = 8.3 Hz, 1H), 5.55 (d, J = 2.9 Hz, 1H), 5.07–4.95 (dd, J = 21.9, 10.9 Hz, 2H), 3.86 (t, J = 9.3 Hz, 1H), 2.98–2.74 (m, 2H), 2.61–2.10 (m, 7H), 1.86–1.64 (m, 1H), 1.55 (s, 3H), 1.35–0.99 (m, 2H). 13C NMR (100 MHz, CDCl3) δ (ppm): δ 169.15, 153.83, 147.80, 145.71, 138.50, 134.20, 133.23, 120.44, 80.81, 71.38, 63.19, 59.80, 42.65, 36.38, 25.56, 24.23, 23.99, 17.98. ESI-MS m/z (M + H+) calcd 360.1559, found 360.16 (M + H+).Synthesis of Ir–C–MMB
MMB–CT (152 mg, 0.42 mmol), Ir (770 mg, 1.313 mmol) and 10 mL of dried CH2Cl2 were placed into a 100 mL round-bottom flask and 140 μL of TEA was subsequently added. The reaction mixture was stirred at room temperature for 48 h. Water was added and the solution was extracted using CH2Cl2 (50 mL). The organic layer was collected and washed with water (3 × 10 mL), followed by saturation NaCl (1 × 10 mL). Then the organic layer was dried over anhydrous Na2SO4 and distilled under vacuum. The crude product was purified by column chromatography using CH2Cl2/CH3OH (40![[thin space (1/6-em)]](https://www.rsc.org/images/entities/char_2009.gif) :
:![[thin space (1/6-em)]](https://www.rsc.org/images/entities/char_2009.gif) 1, v/v) as the eluent. The yellow solid product was collected by rotary evaporation (210 mg, 63%). 1H NMR (400 MHz, CDCl3) δ 8.16 (d, J = 9.0 Hz, 1H), 7.86 (s, 1H), 7.57 (d, J = 9.1 Hz, 1H), 6.08 (s, 1H), 5.70 (dd, J = 16.6, 8.3 Hz, 2H), 5.54 (d, J = 10.4 Hz, 1H), 5.41 (m, 1H), 5.25 (s, 2H), 4.65–4.44 (m, 2H), 3.81 (t, J = 9.2 Hz, 1H), 3.54 (s, 2H), 3.17–3.07 (m, 4H), 2.90–2.81 (m, 2H), 2.38 (dd, J = 14.0, 11.2 Hz, 4H), 2.21 (dd, J = 12.7, 8.5 Hz, 3H), 1.94 (d, J = 17.1 Hz, 3H), 1.68–1.57 (m, 1H), 0.98 (t, J = 7.3 Hz, 3H), 0.88–0.71 (m, 3H). 13C NMR (100 MHz, CDCl3) δ 176.35, 169.22, 167.05, 156.99, 151.26, 149.83, 148.28, 145.76, 145.45, 138.20, 133.47, 130.42, 125.57, 119.92, 114.57, 95.32, 80.74, 71.21, 66.71, 63.15, 59.69, 49.22, 45.59, 43.31, 41.15, 35.92, 17.74, 13.81. ESI-MS m/z (M + H+): calcd 877.4024, found 877.4020 (M + H+).
1, v/v) as the eluent. The yellow solid product was collected by rotary evaporation (210 mg, 63%). 1H NMR (400 MHz, CDCl3) δ 8.16 (d, J = 9.0 Hz, 1H), 7.86 (s, 1H), 7.57 (d, J = 9.1 Hz, 1H), 6.08 (s, 1H), 5.70 (dd, J = 16.6, 8.3 Hz, 2H), 5.54 (d, J = 10.4 Hz, 1H), 5.41 (m, 1H), 5.25 (s, 2H), 4.65–4.44 (m, 2H), 3.81 (t, J = 9.2 Hz, 1H), 3.54 (s, 2H), 3.17–3.07 (m, 4H), 2.90–2.81 (m, 2H), 2.38 (dd, J = 14.0, 11.2 Hz, 4H), 2.21 (dd, J = 12.7, 8.5 Hz, 3H), 1.94 (d, J = 17.1 Hz, 3H), 1.68–1.57 (m, 1H), 0.98 (t, J = 7.3 Hz, 3H), 0.88–0.71 (m, 3H). 13C NMR (100 MHz, CDCl3) δ 176.35, 169.22, 167.05, 156.99, 151.26, 149.83, 148.28, 145.76, 145.45, 138.20, 133.47, 130.42, 125.57, 119.92, 114.57, 95.32, 80.74, 71.21, 66.71, 63.15, 59.69, 49.22, 45.59, 43.31, 41.15, 35.92, 17.74, 13.81. ESI-MS m/z (M + H+): calcd 877.4024, found 877.4020 (M + H+).
Preparation of Ir–C–MMB nanoparticles
At room temperature, Ir–C–MMB (5 mg) was dissolved in DMSO (2 mL) and stirred for 5 min. Subsequently, the solution was added dropwise into deionized water (4 mL) and stirred gently for 2 h. Then, the solution was transferred into a dialysis bag and dialyzed against deionized water for 24 h (MWCO = 1000 g mol−1), during which the water was renewed every 2 h. The volume of the solution was increased to 10 mL to give a concentration 0.5 mg mL−1. The solution of self-assembled nanoparticles was stored away from light at 4 °C in the refrigerator for further experiments.Measurements of critical aggregation concentration (CAC)
The CAC of Ir–C–MMB was determined by UV measurements using rod-shaped 1,6-diphenyl-1,3,5-hexatriene (DPH) as a UV probe.42 A DPH solution in acetone (6 × 10⁻⁵ M) was mixed with Ir–C–MMB nanoparticle suspensions, which ranged in concentration from 0.001 to 200 μg mL−1, to give a final DPH concentration in each sample of 6.0 × 10⁻⁷ M. The solutions were placed in the dark to equilibrate for at least 3 h before the measurements. The absorption spectra of the samples were recorded at 310 nm using a Thermo EV300 UV-vis spectrometer.In vitro drug release from Ir–C–MMB nanoparticles
The release of Ir from the Ir–C–MMB nanoparticles was evaluated by dialysis. The release experiments were performed in PBS at two different pH values (7.4 and 5.0) with or without esterase. Briefly, 2 mL of the Ir–C–MMB nanoparticle solution was added into a dialysis tube (MWCO = 3500), which was immersed in 60 mL of buffer solution at 37 °C and gently shaken in a shaker at 120 rpm in the dark. At a predetermined time, 2 mL of the external buffer was extracted and 2 mL fresh buffer solution was added. The concentration of released Ir was calculated by measuring the intensity of the fluorescence in the extracted sample (QC-4-CW spectrometer, excitation at 360 nm). All of the drug release experiments were carried out in triplicate, and the results show averaged data.Cell culture
The human colon carcinoma cell line HCT-116 was purchased from the American Type Culture Collection (ATCC). HCT-116 cells were cultured in McCoy's 5A medium in a humidified atmosphere containing 5% CO2 at 37 °C. The culture medium contained 10% fetal bovine serum (FBS), penicillin (50 units mL−1), and streptomycin (50 units mL−1).In vitro degradation experiment of Ir–C–MMB nanoparticles
The HCT-116 cells were seeded in a 6-well plate at a density of 5.0 × 10⁵ cells per well in 1.5 mL of complete McCoy's 5A medium and allowed to culture for 24 h. Then 35 μM Ir–C–MMB nanoparticles were added to each well for 6 h at 37 °C. Subsequently, the medium was removed and the cells were rinsed three times with cold PBS. Trypsin was added to the plates and the cells were transferred into centrifuge tubes and centrifuged twice at 1000 rpm for 5 min at room temperature. The supernatant was removed from each well, the cells were re-suspended in 2 mL of methanol, and sonicated for 5 min using an ultrasonic cell disrupter (Vibra cell 750). After sonication, the cell suspensions were centrifuged twice at 4 °C and 1500 rpm for 10 min. Then, the supernatants were acquired and analyzed by LC-MS.Cellular uptake of Ir–C–MMB nanoparticles in HCT-116 cells
Flow cytometry and confocal laser scanning microscopy (CLSM) were used to evaluate the cellular uptake of Ir–C–MMB nanoparticles in HCT-116 cells. For flow cytometry analysis, HCT-116 cells were seeded in 6-well plates at a density of 5.0 × 10⁵ cells per well in 1.5 mL of complete McCoy's 5A medium for 12 h. A solution of Ir–C–MMB nanoparticles (40 μM) was added to each well for the predetermined time interval (0.5 h, 1 h, 2 h, 4 h, or 6 h). Thereafter, the culture medium was removed and the cells were washed with cold PBS three times and treated with trypsin. After the cells were collected using flow tubes, the data for 1.0 × 10⁴ gated events were collected and analysis was performed using a BD LSRFortessa flow cytometer.For the CLSM assay, the HCT-116 cells were seeded in 6-well plates at a density of 5.0 × 10⁵ cells per well. After being cultured for 24 h, the culture medium was replaced by 2 mL fresh McCoy's 5A, and Ir–C–MMB nanoparticles were added to each well at prearranged times. After removal of the McCoy's 5A culture medium, each well was washed three times using cold PBS. Subsequently, the HCT-116 cells were fixed with 4% formaldehyde for 20 min at room temperature and the slides were rinsed three times with PBS. Then the cells were gently treated with 0.1% Triton X-100 solution. RNase (0.1 mg mL−1) was added and the cells were incubated at 37 °C for 20 min. Finally, the HCT-116 cells were incubated with 100 μL propidium iodide (PI; 2 μg mL−1) for nuclei staining for 15 min and the slides were then washed three times with PBS. The resulting slides were mounted and observed with a LEICA TCS SP8 fluorescence microscope.
Cytotoxicity measurements of Ir–C–MMB nanoparticles
The methyl tetrazolium (MTT) assay was used to evaluate the anticancer activity of the Ir–C–MMB nanoparticles in HCT-116 cells. The free drugs Ir and MMB, and an Ir/MMB mixture were used as controls. HCT-116 cells were seeded into 96-well plates at a density of 8 × 10³ cells per well and incubated in 100 μL of McCoy's 5A culture medium for 24 h at 37 °C. After the removal of the medium, serial dilutions from 0.1 μM to 100 μM of Ir–C–MMB nanoparticles, Ir, MMB and the Ir/MMB mixture were added. Untreated cells were used as a control. The cells were cultured for 3 days. Then, 20 μL of 5 mg mL−1 MTT solution in PBS was added to each well. After incubation of the cells for 4 h, the medium containing unreacted MTT was carefully removed by pipette, and 200 μL DMSO was added per well to dissolve the blue formazan crystals. The plates were oscillated to fully dissolve the crystals, and the absorbance of each well was measured at 490 nm with a BIO-RAD Model 680 microplate reader. The cell viabilities (%) were calculated from the values obtained compared to those obtained for the untreated control cells.Apoptosis assays
HCT-116 cells were cultured in 6-well dishes at a density of 5.0 × 10⁵ cells per well in 1.5 mL McCoy's 5A medium for 24 h. Then cells were treated with Ir, MMB, the Ir/MMB mixture, or Ir–C–MMB nanoparticles at the same concentration of 30 μM. After incubation for 24 h, the HCT-116 cells were collected and rinsed three times with cold PBS. Then, they were stained with Alexa Fluor 488 annexin V and PI according to the instructions. Finally, a BD LSRFortessa flow cytometer was used to record and analyze the cell apoptosis of 1.0 × 10⁴ gated events.Results and discussion
Synthesis and characterization of Ir–C–MMB
The Ir–C–MMB was synthesized through a two-step reaction as shown in Scheme 1. Firstly, the –OH group of MMB was activated using CDT to obtain the MMB–CT intermediate. The 1H and 13C NMR spectra of MMB–CT are shown in ESI Fig. S1.† The 1H NMR spectra show that the proton signal at 4.10 ppm (j) ascribed to the methylene moiety (–CH2–OH) of MMB shifts to 4.98 ppm (j′) for MMB–CT. Moreover, two new peaks at 8.06 ppm and 8.87 ppm belonging to triazole protons appear in the 1H NMR spectrum of MMB–CT. In the 13C NMR spectra (ESI Fig. S1b†), the carbon signal at 65.41 ppm (o) corresponding to the –CH2–OH of MMB shifts to 71.42 ppm (o′) for MMB–CT. Meanwhile, a new carbon signal at 147.80 ppm (q′) associated with the –OC![[double bond, length as m-dash]](https://www.rsc.org/images/entities/char_e001.gif) OO– moiety appears in the 13C NMR spectrum of MMB–CT. The chemical structure of MMB–CT was characterized by LC-MS as shown in the ESI Fig. S2.† The reaction between MMB–CT and Ir was carried out at room temperature using trimethylamine as a catalyst. The chemical structure of Ir–C–MMB was confirmed by 1H NMR and 13C NMR. As shown in Fig. 1, the peak at 4.24 ppm (1) in the 1H NMR spectrum of Ir, attributed to the hydroxyl proton, disappears in the spectrum of Ir–C–MMB. Furthermore, the signal at 7.65 ppm (2) ascribed to the pyridone ring of Ir moves to 7.57 ppm (2′), and the proton signal at 3.12 ppm (3) belonging to the lactone ring shifts to 3.06 ppm (3′). The signal at 4.10 ppm (o) attributed to the –CH2–OH moiety of MMB shifts to 4.57 ppm (o') in the 1H NMR spectrum of Ir–C–MMB. In the 13C NMR spectrum of Ir–C–MMB (Fig. 1b), a new peak appears at 176 ppm (3′) corresponding to the –COO– group. Moreover, the carbon signal at 72.4 ppm (2) of Ir shifts to 71.1 ppm (2′) for Ir–C–MMB, while the carbon signal at 172 ppm (n) ascribed to the –C
OO– moiety appears in the 13C NMR spectrum of MMB–CT. The chemical structure of MMB–CT was characterized by LC-MS as shown in the ESI Fig. S2.† The reaction between MMB–CT and Ir was carried out at room temperature using trimethylamine as a catalyst. The chemical structure of Ir–C–MMB was confirmed by 1H NMR and 13C NMR. As shown in Fig. 1, the peak at 4.24 ppm (1) in the 1H NMR spectrum of Ir, attributed to the hydroxyl proton, disappears in the spectrum of Ir–C–MMB. Furthermore, the signal at 7.65 ppm (2) ascribed to the pyridone ring of Ir moves to 7.57 ppm (2′), and the proton signal at 3.12 ppm (3) belonging to the lactone ring shifts to 3.06 ppm (3′). The signal at 4.10 ppm (o) attributed to the –CH2–OH moiety of MMB shifts to 4.57 ppm (o') in the 1H NMR spectrum of Ir–C–MMB. In the 13C NMR spectrum of Ir–C–MMB (Fig. 1b), a new peak appears at 176 ppm (3′) corresponding to the –COO– group. Moreover, the carbon signal at 72.4 ppm (2) of Ir shifts to 71.1 ppm (2′) for Ir–C–MMB, while the carbon signal at 172 ppm (n) ascribed to the –C![[double bond, length as m-dash]](https://www.rsc.org/images/entities/char_e001.gif) O of MMB shifts to 169 ppm for Ir–C–MMB. Furthermore, the carbon signals corresponding to the C
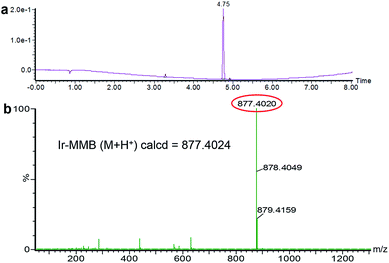
O of MMB shifts to 169 ppm for Ir–C–MMB. Furthermore, the carbon signals corresponding to the C![[double bond, length as m-dash]](https://www.rsc.org/images/entities/char_e001.gif) C double bonds of MMB (p and m) can also be found for Ir–C–MMB (p′ and m′). To verify the purity and molecular weight of Ir–C–MMB, LC-MS was performed using acetonitrile as the elution solvent. As shown in Fig. 2a, there was one retention peak at 4.75 min in the LC profile of Ir–C–MMB, suggesting the high purity of the nanoparticles. In addition, the MS result showed that the molecular weight of Ir–C–MMB (m/z, M + H+) is 877.4020, which is in accordance with the calculated value (m/z, M + H+, 877.4024) (Fig. 2b).
C double bonds of MMB (p and m) can also be found for Ir–C–MMB (p′ and m′). To verify the purity and molecular weight of Ir–C–MMB, LC-MS was performed using acetonitrile as the elution solvent. As shown in Fig. 2a, there was one retention peak at 4.75 min in the LC profile of Ir–C–MMB, suggesting the high purity of the nanoparticles. In addition, the MS result showed that the molecular weight of Ir–C–MMB (m/z, M + H+) is 877.4020, which is in accordance with the calculated value (m/z, M + H+, 877.4024) (Fig. 2b).
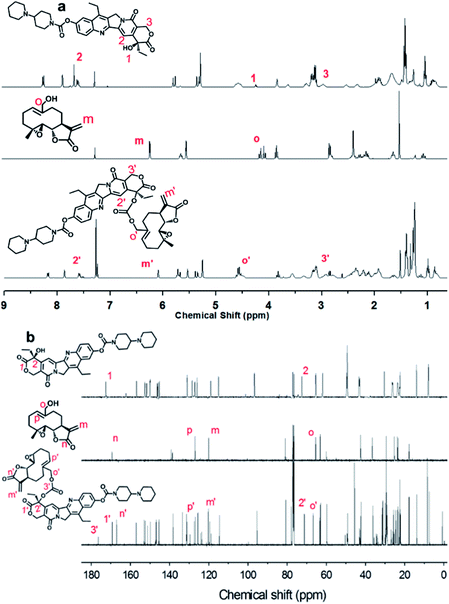 | ||
| Fig. 1 (a) 1H NMR and (b) 13C NMR spectra in CDCl3 of Ir (upper panels), MMB (middle panels) and Ir–C–MMB (lower panels). | ||
The Ir–C–MMB was also characterized by FTIR spectroscopy, UV-vis spectrophotometry and fluorescence spectroscopy, and the results are shown in ESI Fig. S3–S5,† respectively. As seen from the FTIR spectra, the hydroxyl stretching vibration of Ir at 3472 cm−1 disappears completely in the FTIR spectrum of Ir–C–MMB. In the FTIR spectrum of Ir–C–MMB, a strong C![[double bond, length as m-dash]](https://www.rsc.org/images/entities/char_e001.gif) O stretching absorption band at 1761 cm−1 appears because of the formation of the carbonate bond, and the two C
O stretching absorption band at 1761 cm−1 appears because of the formation of the carbonate bond, and the two C![[double bond, length as m-dash]](https://www.rsc.org/images/entities/char_e001.gif) O stretching absorption bands of Ir at 1715 cm−1 (pyridine ring) and 1658 cm−1 (lactone ring) move to 1718 cm−1 and 1663 cm−1, respectively. The UV-vis spectrum of Ir–C–MMB contains UV-vis absorptions of both Ir and MMB. Compared with the UV-vis absorption of Ir, there is a blue shift of about 7 nm in the UV-vis absorption of Ir–C–MMB. Ir displays strong fluorescence, and that of Ir–C–MMB is similar. As shown in ESI Fig. S5,† the maximum fluorescence emission peak of Ir is 419 nm, while the maximum emission of Ir–C–MMB blue-shifts to 416 nm because of the formation of the carbonate bond. All these results demonstrate that the Ir–C–MMB was synthesized successfully.
O stretching absorption bands of Ir at 1715 cm−1 (pyridine ring) and 1658 cm−1 (lactone ring) move to 1718 cm−1 and 1663 cm−1, respectively. The UV-vis spectrum of Ir–C–MMB contains UV-vis absorptions of both Ir and MMB. Compared with the UV-vis absorption of Ir, there is a blue shift of about 7 nm in the UV-vis absorption of Ir–C–MMB. Ir displays strong fluorescence, and that of Ir–C–MMB is similar. As shown in ESI Fig. S5,† the maximum fluorescence emission peak of Ir is 419 nm, while the maximum emission of Ir–C–MMB blue-shifts to 416 nm because of the formation of the carbonate bond. All these results demonstrate that the Ir–C–MMB was synthesized successfully.
Fabrication of Ir–C–MMB nanoparticles
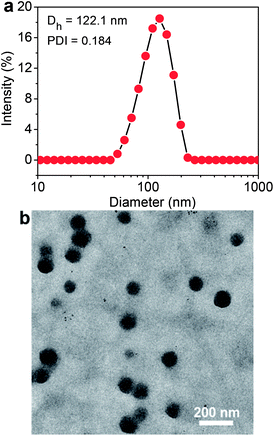
The Ir–C–MMB is composed of the hydrophobic MMB and the hydrophilic Ir linked via a carbonate bond to produce an amphiphilic structure, which causes Ir–C–MMB to self-assemble spontaneously into nanoparticles in water. To prepare the Ir–C–MMB nanoparticles, a DMSO solution of Ir–C–MMB was slowly added into deionized water, and then the solution was dialyzed against water to remove DMSO and obtain stable nanoparticles with an Ir–C–MMB concentration of 0.5 mg mL−1. The self-assembly behavior of Ir–C–MMB in water was investigated by measuring the CAC with UV-vis spectroscopy using DPH as a hydrophobic probe. The relationship showing the absorbance intensity of DPH against the Ir–C–MMB concentration is shown in Fig. 3. The absorption intensity increases slowly at a low Ir–C–MMB concentration. However, it increases markedly when the Ir–C–MMB concentration reaches a certain value, suggesting the formation of nanoparticles and the loading of DPH in a hydrophobic environment. According to the inflection of the curve, the CAC value of Ir–C–MMB is about 13 μg mL−1. The hydrodynamic size and morphology of the Ir–C–MMB nanoparticles were measured by DLS and TEM. Fig. 4a gives the DLS curve of an Ir–C–MMB solution, which indicates the formation of assembles with a unimodal size distribution and an average hydrodynamic diameter of about 122.1 nm. DLS was also used to measure the size of the nanoparticles at various time intervals, and the results confirmed that the nanoparticles were sufficiently stable in aqueous solution during storage for two weeks (ESI Fig. S6†). Furthermore, the morphology of the assembles was observed by TEM as shown in Fig. 4b. The image shows that the nanoparticles have spherical morphology with an average size of approximately 116.9 nm, which is consistent with the size given by DLS.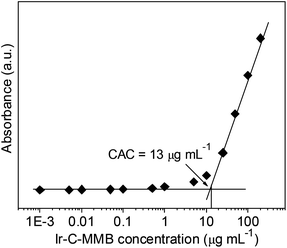 | ||
| Fig. 3 Relationship between absorbance and the concentration of Ir–C–MMB in aqueous solution (λ = 313 nm, 25 °C). The CAC value of Ir–C–MMB is about 13 μg mL−1. | ||
In vitro drug release
The in vitro release behavior of the Ir–C–MMB nanoparticles was evaluated by dialysis against PBS pH 7.4 and PBS pH 5.0 with and without esterase (30 U mL−1) at 37 °C. The cumulative release curves are shown in Fig. 5. The concentration of released Ir is low in PBS at pH 7.4, which reflects the good stability of the Ir–C–MMB nanoparticles under physiological conditions. However, under weakly acidic conditions (pH 5.0), the cleavage of the carbonate bond of Ir–C–MMB is accelerated to rapidly release free Ir and MMB, giving a drug release rate of about 40%. After the addition of esterase, the release rate increases to nearly 50% within 48 h, suggesting that esterase can promote the hydrolysis of the carbonate bond between Ir and MMB.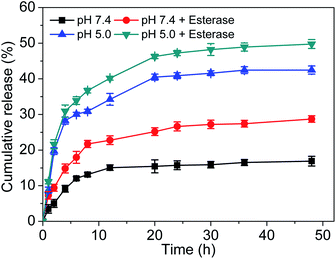 | ||
| Fig. 5 In vitro Ir release kinetics from Ir–C–MMB nanoparticles at different pH values (5.0 and 7.4) with and without esterase at 37 °C. | ||
To further verify whether the Ir–C–MMB can be converted to free Ir and MMB in cells through degradation, the intracellular degradation of Ir–C–MMB was evaluated. After incubation with Ir–C–MMB nanoparticles for 6 h, HCT-116 human colon cancer cells were disrupted, and extracts were characterized using LC-MS. The results indicated the existence of free Ir and MMB in the cellular extracts after they had been treated with Ir–C–MMB nanoparticles (ESI Fig. S7†). The intracellular degradation assay demonstrates that the carbonate bond between the hydrophilic and hydrophobic drugs can be hydrolyzed to release both free Ir and free MMB in cancer cells.
Cell internalization
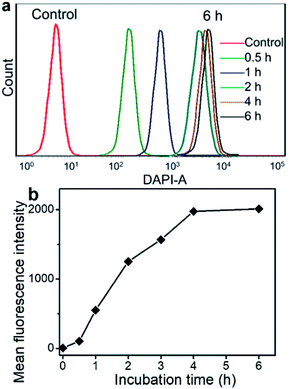
The fluorescence spectra show that Ir emits blue fluorescence at an excitation wavelength of 360 nm, and the self-assembled Ir–C–MMB nanoparticles also exhibit strong blue fluorescence in water (ESI Fig. S5†); they could be used as a probe for the cell internalization analysis. Flow cytometry was used to determine the cellular uptake of Ir–C–MMB nanoparticles. HCT-116 cells were incubated with Ir–C–MMB nanoparticles at a concentration of 40 μM for 0.5, 1, 2, 4, and 6 h. Untreated cells were used as a control. As shown in Fig. 6a, it is obvious that the fluorescence intensity increased rapidly as the incubation time increased. After incubation for 6 h with Ir–C–MMB nanoparticles, the relative geometrical mean fluorescence intensity of the treated cells is about 400-fold that of untreated cells (Fig. 6b). The fast enhancement of fluorescence intensity can be ascribed to the cellular uptake of the Ir–C–MMB nanoparticles by the HCT-116 cells. In addition, the cellular uptake of the Ir–C–MMB nanoparticles by HCT-116 cells was investigated by CLSM. After culture with the Ir–C–MMB nanoparticles for 4 h, the cells were fixed and the nuclei were stained with PI. The prepared samples were directly observed using a LEICA TCS SP8. As shown in Fig. 7, the blue fluorescence from the Ir–C–MMB nanoparticles can be observed both in the cytoplasm and in the nuclei according to the merged image. The results demonstrate that Ir–C–MMB nanoparticles can enter cancer cells and the cell nuclei effectively.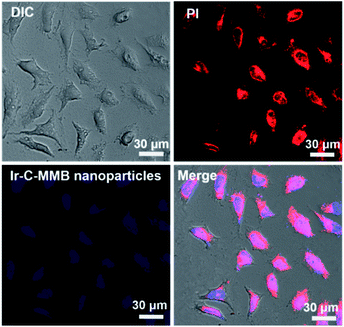 | ||
| Fig. 7 CLSM images of HCT-116 cells incubated with Ir–C–MMB nanoparticles for 4 h. Cell nuclei were stained with PI for 15 min. | ||
In vitro cytotoxicity of Ir–C–MMB nanoparticles
HCT-116 cancer cells were used to evaluate the therapeutic effect of the Ir–C–MMB nanoparticles by MTT assay. HCT-116 cells were incubated with a series of concentrations (0.1 to 50 μM) of free Ir, free MMB, the Ir/MMB mixture, or Ir–C–MMB nanoparticles for 72 h. Untreated cells were used as a control. As shown in Fig. 8, it is obvious that the cytotoxicity to HCT-116 cells of free Ir is lower than that of free MMB or the Ir/MMB mixture.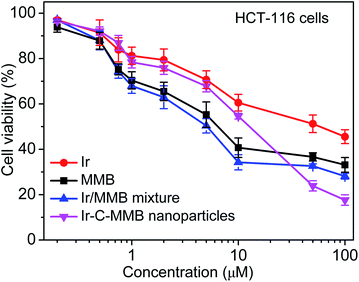 | ||
| Fig. 8 Cell viability of HCT-116 cells after incubation for 72 h with different concentrations of Ir, MMB, the Ir/MMB mixture or Ir–C–MMB nanoparticles. | ||
Both free MMB and the Ir/MMB mixture show better cytotoxicity than that of Ir–C–MMB until a threshold concentration is reached (the CAC), at which the cytotoxicity of Ir–C–MMB dramatically increases and becomes even better than that of free MMB and the Ir/MMB mixture. This can be explained by the effective internalization of the Ir–C–MMB nanoparticles by the tumor cells and possible synergistic action between the released free Ir and free MMB.
Apoptosis of HCT-116 cells induced by Ir–C–MMB nanoparticles
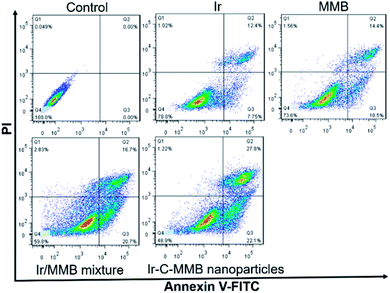
Generally, most small molecule chemotherapeutic agents can kill cancer cells through inducing cell apoptosis. Thus, the FITC-Annexin V/PI apoptosis detection kit was used to determine whether or not the death of cancer cells treated with the Ir–C–MMB nanoparticles resulted from cell apoptosis. Free Ir, free MMB, the Ir/MMB mixture, and Ir–C–MMB nanoparticles (all at 30 μM) were added into HCT-116 cells and incubated for 24 h. Untreated cells were used as a negative control. Subsequently, the cells were stained using FITC-Annexin V/PI. The flow cytometry analysis in Fig. 9 shows that the percentages of apoptotic cells (lower right + upper right panels) are 20.1%, 24.9%, 37.4% and 49.9% for Ir, MMB, the Ir/MMB mixture, and the Ir–C–MMB nanoparticles, respectively. These results demonstrate that the Ir–C–MMB nanoparticles can induce a higher level of apoptosis in HCT-116 cells compared with other drug formulations at the same dose.Conclusions
In summary, we prepared a new ADDC, Ir–C–MMB, and constructed a drug self-delivery system through the self-assembly of Ir–C–MMB to deliver hydrophobic MMB and hydrophilic Ir simultaneously for cancer combination therapy. Benefiting from their nanoscale characteristics, the obtained Ir–C–MMB nanoparticles can enter cancer cells effectively by internalization. After hydrolysis under acid condition in cells, the carbonate bond in Ir–C–MMB can be cleaved to release Ir and MMB synchronously to kill cancer cells. In vitro studies show that the Ir–C–MMB nanoparticles have higher cell cytotoxicity than free Ir or MMB and can more efficiently induce the apoptosis of HCT-166 cells. In conclusion, this small molecule drug self-delivery system constructed by the ADDC strategy offers a new way of delivering the hydrophobic anticancer agent PTL and its derivative MMB and could eventually be applied in the clinic.Conflicts of interest
There are no conflicts to declare.Acknowledgements
This work was supported by the National Key Research and Development Plan of China (No. 2016YFA0201500), the National Natural Science Foundation of China (21702097, 21504055, 91527304, 81672587), the Postdoctoral Science Foundation of China (2018T110389) and the Innovation Fund from the Joint Research Center for Precision Medicine set up by Shanghai Jiao Tong University & Affiliated Sixth People's Hospital South Campus (IFPM2017B003).References
- F. Bray, J. Ferlay, I. Soerjomataram, R. L. Siegel, L. A. Torre and A. Jemal, Ca-Cancer J. Clin., 2018, 68, 394–424 CrossRef PubMed.
- A. D. Kinghorn, N. R. Farnsworth, D. D. Soejarto, G. A. Cordell, J. M. Pezzuto, G. O. Udeani, M. C. Wani, M. E. Wall, H. A. Navarro, R. A. Kramer, A. T. Menendez, C. R. Fairchild, K. E. Lane, S. Forenza, D. M. Vyas, K. S. Lam and Y.-Z. Shu, Pure Appl. Chem., 1999, 71, 1611–1618 Search PubMed.
- G. M. Cragg, P. G. Grothaus and D. J. Newman, J. Nat. Prod., 2014, 77, 703–723 CrossRef CAS PubMed.
- D. W. Knight, Nat. Prod. Rep., 1995, 12, 271–276 RSC.
- I. H. Hall, A. A. Grippo, K. H. Lee, S. G. Chaney and D. J. Holbrook, Pharm. Res., 1987, 4, 509–514 CrossRef CAS PubMed.
- H. C. Chen, C. K. Chou, S. D. Lee, J. C. Wang and S. F. Yeh, Antiviral Res., 1995, 27, 99–109 CrossRef CAS.
- C. J. Sweeney, S. Mehrotra, M. R. Sadaria, S. Kumar, N. H. Shortle, Y. Roman, C. Sheridan, R. A. Campbell, D. J. Murry, S. Badve and H. Nakshatri, Mol. Cancer Ther., 2005, 4, 1004–1012 CrossRef.
- J. Zhou, H. Zhang, P. Gu, J. Bai, J. B. Margolick and Y. Zhang, Breast Cancer Res. Treat., 2008, 111, 419–427 CrossRef.
- J. Wen, K. R. You, S. Y. Lee, C. H. Song and D. G. Kim, J. Biol. Chem., 2002, 277, 38954–38964 CrossRef.
- J. H. Park, L. Liu, I. H. Kim, J. H. Kim, K. R. You and D. G. Kim, Cancer Res., 2005, 65, 2804–2814 CrossRef.
- D. Zhang, L. Qiu, X. Jin, Z. Guo and C. Guo, Mol. Cancer Res., 2009, 7, 1139–1149 CrossRef PubMed.
- A. Zanotto-Filho, E. Braganhol, R. Schroder, L. H. de Souza, R. J. Dalmolin, M. A. Pasquali, D. P. Gelain, A. M. Battastini and J. C. Moreira, Biochem. Pharmacol., 2011, 81, 412–424 CrossRef CAS PubMed.
- B. T. Kawasaki, E. M. Hurt, M. Kalathur, M. A. Duhagon, J. A. Milner, Y. S. Kim and W. L. Farrar, Prostate, 2009, 69, 827–837 CrossRef CAS PubMed.
- M. T. Yip-Schneider, H. Nakshatri, C. J. Sweeney, M. S. Marshall, E. A. Wiebke and C. M. Schmidt, Mol. Cancer Ther., 2005, 4, 587–594 CrossRef CAS.
- D. Zuch, A. H. Giang, Y. Shapovalov, E. Schwarz, R. Rosier, R. O' Keefe and R. A. Eliseev, J. Cell. Biochem., 2012, 113, 1282–1291 CrossRef CAS.
- A. J. Garcia-Pineres, V. Castro, G. Mora, T. J. Schmidt, E. Strunck, H. L. Pahl and I. Merfort, J. Biol. Chem., 2001, 276, 39713–39720 CrossRef CAS.
- S. P. Hehner, M. Heinrich, P. M. Bork, M. Vogt, F. Ratter, V. Lehmann, K. Schulze-Osthoff, W. Droge and M. L. Schmitz, J. Biol. Chem., 1998, 273, 1288–1297 CrossRef CAS.
- M. R. Kreuger, S. Grootjans, M. W. Biavatti, P. Vandenabeele and K. D' Herde, Anticancer Drugs, 2012, 23, 883–896 Search PubMed.
- J. Skalska, P. S. Brookes, S. M. Nadtochiy, S. P. Hilchey, C. T. Jordan, M. L. Guzman, S. B. Maggirwar, M. M. Briehl and S. H. Bernstein, PLoS One, 2009, 4, e8115 CrossRef.
- W. Wang, M. Adachi, R. Kawamura, H. Sakamoto, T. Hayashi, T. Ishida, K. Imai and Y. Shinomura, Apoptosis, 2006, 11, 2225–2235 CrossRef CAS.
- F. A. Macias, J. C. G. Galindo and M. M. Guillermo, Phytochemistry, 1992, 31, 1969–1977 CrossRef CAS.
- S. Nasim, S. Pei, F. K. Hagen, C. T. Jordan and P. A. Crooks, Bioorg. Med. Chem., 2011, 19, 1515–1519 CrossRef CAS PubMed.
- V. Janganati, J. Ponder, S. Thakkar, C. T. Jordan and P. A. Crooks, Bioorg. Med. Chem., 2017, 25, 3694–3705 CrossRef.
- V. Janganati, N. R. Penthala, N. R. Madadi, Z. Chen and P. A. Crooks, Bioorg. Med. Chem., 2014, 24, 3499–3502 CrossRef.
- Q. Zhou, S. Shao, J. Wang, C. Xu, J. Xiang, Y. Piao, Z. Zhou, Q. Yu, J. Tang, X. Liu, Z. Gan, R. Mo, Z. Gu and Y. Shen, Nat. Nanotechnol., 2019, 14, 799–809 CrossRef PubMed.
- N. Kamaly, B. Yameen, J. Wu and O. C. Farokhzad, Chem. Rev., 2016, 116, 2602–2663 CrossRef.
- M. Elsabahy, G. S. Heo, S.-M. Lim, G. Sun and K. L. Wooley, Chem. Rev., 2015, 115, 10967–11011 CrossRef.
- S. Lv, Y. Wu, K. Cai, H. He, Y. Li, M. Lan, X. Chen, J. Cheng and L. Yin, J. Am. Chem. Soc., 2018, 140, 1235–1238 CrossRef PubMed.
- S.-M. Lee, H. M. Chen, C. M. Dettmer, T. V. O' Halloran and S. T. Nguyen, J. Am. Chem. Soc., 2007, 129, 15096–15097 CrossRef CAS PubMed.
- D. V. Volodkin, A. G. Skirtach and H. Möhwald, Angew. Chem., Int. Ed., 2009, 48, 1807–1809 CrossRef CAS.
- M. M. Rahman, M. Ueda, T. Hirose and Y. Ito, J. Am. Chem. Soc., 2018, 140, 17956–17961 CrossRef CAS PubMed.
- J. Song, L. Lin, Z. Yang, R. Zhu, Z. Zhou, Z.-W. Li, F. Wang, J. Chen, H. Yang and X. Chen, J. Am. Chem. Soc., 2019, 141, 8158–8170 Search PubMed.
- B. Kim, G. Han, B. J. Toley, C.-K. Kim, V. M. Rotello and N. S. Forbes, Nat. Nanotechnol., 2010, 5, 465–472 CrossRef.
- P. Huang, D. Wang, Y. Su, W. Huang, Y. Zhou, D. Cui, X. Zhu and D. Yan, J. Am. Chem. Soc., 2014, 136, 11748–11756 CrossRef.
- P. Huang, G. Wang, Y. Su, Y. Zhou, W. Huang, R. Zhang and D. Yan, Theranostics, 2019, 9, 5755–5768 CrossRef PubMed.
- M. Hu, P. Huang, Y. Wang, Y. Su, L. Zhou, X. Zhu and D. Yan, Bioconjugate Chem., 2015, 26, 2497–2506 CrossRef.
- P. Huang, M. Hu, L. Zhou, Y. Wang, Y. Pang, G. Tong, W. Huang, Y. Su and X. Zhu, RSC Adv., 2015, 5, 86254–86264 RSC.
- Y. Wang, P. Huang, M. Hu, W. Huang, X. Zhu and D. Yan, Bioconjugate Chem., 2016, 27, 2722–2733 CrossRef CAS.
- T. Zhang, P. Huang, L. Shi, Y. Su, L. Zhou, X. Zhu and D. Yan, Mol. Pharmaceutics, 2015, 12, 2328–2336 CrossRef.
- P. Huang, J. Ao, L. Zhou, Y. Su, W. Huang, X. Zhu and D. Yan, Bioconjugate Chem., 2016, 27, 1564–1568 CrossRef.
- S. Xu, X. Zhu, W. Huang, Y. Zhou and D. Yan, J. Controlled Release, 2017, 266, 36–46 CrossRef.
- S. Kawato, K. Kinosita and A. Ikegami, Biochemistry, 1978, 17, 5026–5031 CrossRef.
Footnotes |
| † Electronic supplementary information (ESI) available. See DOI: 10.1039/d0ra00912a |
| ‡ These authors contributed equally to this work. |
| This journal is © The Royal Society of Chemistry 2020 |

