 Open Access Article
Self assembled monolayer of silica nanoparticles with improved order by drop casting†
Asma Qdemat *ab,
Emmanuel Kentzinger
 a,
Johan Buitenhuis
 c,
Ulrich Rücker
 a,
Marina Ganeva
 d and
Thomas Brückel
 ab
ab
aJülich Centre for Neutron Science, Peter Grünberg Institute, JARA-FIT, Forschungszentrum Jülich GmbH, 52425 Jülich, Germany
bRWTH Aachen, Lehrstuhl für Experimentalphysik IVc, Jülich-Aachen Research Alliance (JARA-FIT), 52074 Aachen, Germany
cBiomacromolecular Systems and Processes, IBI-4, Forschungszentrum Jülich GmbH, 52425 Jülich, Germany
dForschungszentrum Jülich GmbH, Jülich Center for Neutron Science at MLZ, Lichtenberg Straße 1, 85748 Garching, Germany
First published on 13th May 2020
Abstract
This paper reports on the formation of large area, self assembled, highly ordered monolayers of stearyl alcohol grafted silica nanospheres of ≈50 nm diameter on a silicon substrate based on the drop-casting method. Our novel approach to achieve improved order uses stearyl alcohol as an assistant by adding it to the colloidal NanoParticle (NP) dispersion from which the monolayers are formed. Additionally, a heat treatment step is added, to melt the stearyl alcohol in the monolayer and thereby give the particles more time to further self-assemble, leading to additional improvement in the monolayer quality. The formation of the monolayers is significantly affected by the concentration of the NPs and the stearyl alcohol, the volume of the drop as well as the time of the heat treatment. A high surface coverage and uniform monolayer film of SiO2 NPs is achieved by appropriate control of the above-mentioned preparation parameters. Structural characterization of the obtained SiO2 NP monolayer was done locally by Scanning Electron Microscopy (SEM), and globally by X-ray reflectivity (XRR) and grazing incidence small-angle X-ray scattering (GISAXS), where the data was reproduced by simulation within the Distorted Wave Born Approximation (DWBA). In conclusion, our modified drop-casting method is a simple, inexpensive method, which provides highly ordered self-assembled monolayers of silica particles, if combined with a compatible additive and a heat treatment step. This method might be more general and also applicable to different particles after finding an appropriate additive.
Introduction
Assembly of NPs into large-area monolayers on a solid substrate is fundamentally interesting due to their unique optical and electronic properties. Furthermore, they have an impact on the creation of next-generation materials design1 and for new devices that require monolayers with ordered structure over large areas formed with a simple method at low cost to meet the growing industrial needs. But controlling the deposition on a substrate to obtain two-dimensional and three-dimensional nanoparticle arrays is a complex process, and it occurs under specific conditions.Several methods for fabricating highly ordered monolayers of NPs on solid substrates have been reported, such as electron beam lithography,2 dip coating,3 spin coating,4,5 Langmuir–Blodgett (LB) technique6 and capillary immersion force technique.7 Y. Wang demonstrated highly ordered and closely packed, self assembled monolayers of microsized SiO2 spheres on a silicon substrate and on a glass substrate by the dip coating method8 and Ogi et al.4 report the fabrication of a monolayer of SiO2 nanoparticles of size 550 and 300 nm on sapphire substrates by using the spin coating method.
The above methods typically result in small monolayer areas and non-uniformity of the resulting monolayer. Due to these disadvantages, these methods are not suitable for industrial processes. Drop-casting is a simple, cheap method and permits the formation of a monolayer over a large area. Due to these advantages, the drop-casting method has potential for industrial applications.
In this paper, we report on the fabrication of a large-area monolayer of SiO2 NPs (≈50 nm in diameter) with a high surface coverage on top of a silicon substrate using a drop-casting method. However, the monolayers formed in this way have a lot of cracks between small ordered domains. Therefore, we improve the quality of the monolayers by adding some stearyl alcohol to the NP dispersions, to try to fill all gaps between the NPs in the monolayers formed early in the drying stage, and thereby preventing crack formation. Finally, we further improve the monolayer quality by adding an additional heat treatment step. We find that high-quality monolayers can be obtained by using a suitable concentration of the NP and stearyl alcohol, proper drop volume and optimizing the heating time.
The silica nanoparticles used in the present study have two important advantages. First of all, they can be prepared with a narrow size distribution (<4%) which is essential for the self-assembly process. Second, the surface of the particles can be chemically modified resulting in particles, which, if dried carefully, do not immediately aggregate irreversibly, which might increase the time for self-assembly. In addition, the relatively low Hamaker constant of silica as compared to other inorganic materials, limits the van der Waals attraction between the cores of the particles, making them more free to move, thereby favoring self-assembly to high-quality monolayers. Generally, the possibilities for chemical modification of the surface of silica particles as well as within the particles, has led to their use in various fields such as medicine, biology, engineering and the development of customized materials.9
Experimental
N-type Si (100) wafers, 0.5 mm thick, cut into 10 × 10 mm2 pieces were used as a substrate for NP deposition, and were cleaned as follows before deposition. The Si substrates were alternately ultra-sonicated in acetone, ethanol, and deionized (DI) water for 5 min, respectively. After that, the wafers were stored in ethanol. Nitrogen gas was used to dry the Si substrates directly after taking them out of the ethanol, just before NPs deposition. This procedure was used to remove dust particles and contamination from the substrate surface. After the above treatment, the drop-casting method was used to deposit NPs on the substrates as explained in detail later.Monodisperse silica particles were prepared in two steps. First monodisperse core silica particles were synthesized in a reverse microemulsion system.10–12 After purification from the microemulsion, the particles were grafted with stearyl alcohol following van Helden.13 In this procedure, the stearyl alcohol forms covalent bonds to the silica surface, resulting in a quite dense stearyl alcohol layer13,14 of about 2 nm thickness, as demonstrated by carbon content analysis on several stearyl grafted silica particles of different sizes.13 In addition, this was also confirmed by a small angle neutron scattering contrast variation study14 for stearyl silica particles dispersed in toluene, which were very similar to the present ones, only the present ones are more monodisperse. This gives sterically stabilized colloidal silica nanoparticles, which can be dispersed in nonpolar solvents like cyclohexane, chloroform or toluene. Here particles with a diameter of about 50 nm were obtained, using toluene as a solvent. The statistical particle size and size distribution of the synthesized silica nanospheres have been determined by several methods (see ESI† for details). Concentrations are expressed as volume fractions, which are calculated using the densities of solvent, silica and stearyl alcohol and assuming additivity of volumes. For the stearyl alcohol silica particles an average density of 1.8 g mL−1 was used, which is also in agreement with a density measurement on former stearyl alcohol silica colloids of similar size. A colloidal dispersion with 5.4 vol% stearyl alcohol silica nanoparticles was prepared as stock. In addition, a stock solution of 5.4 vol% stearyl alcohol in toluene was made.
These two stock solutions were used to fabricate a large monolayer area of ordered nanoparticles on a silicon substrate by the drop-casting technique with and without the assistance of stearyl alcohol. The monolayer preparation methods were carried out as follows. Method 1: prior to the use of stearyl alcohol to assist monolayer formation, ≈5 μL of 5.4 vol% NPs stock dispersion was dropped onto a cleaned silicon substrate, followed after one minute by the addition of an extra ≈3 μL toluene to the film. While doing so, the sample was kept unmoved and the sample container was covered to reduce the evaporation rate. Method 2: in order to improve the NPs ordering over the whole sample area, stearyl alcohol was used as assistant. Firstly, in this method, a solution with 0.1 vol% stearyl alcohol silica and 0.1 vol% stearyl alcohol was prepared, by adding 20 μL of 5.4 vol% stearyl alcohol silica and 20 μL of 5.4 vol% stearyl alcohol to 0.96 mL of toluene. After that, 5 μL of this solution was taken by a micro-pipette and dropped onto the silicon substrate. Then the droplet quickly spreads over the substrate surface and the sample was left open for one day to let it dry. Method 3: a last optional step added in the monolayer fabrication is the heat treatment, which was used in order to reduce the number of cracks in the monolayer obtained in method 2.
Characterization of SiO2 NP monolayers has been done by scanning electron microscope (SEM, Hitachi SU8000) to image the ordering of the NPs locally in real space. In addition, XRR and GISAXS measurements were carried out at the diffractometer Gallium Anode Low-Angle X-ray Instrument GALAXI15 using a monochromatic X-ray beam with a wavelength of λ = 0.1314 nm and a beam of a cross-section at the sample of 0.7 × 0.7 mm2. XRR measurements were performed in order to obtain the depth resolved profile of the NPs in reciprocal space. GISAXS measurements were performed in order to investigate the in-plane ordering of the NPs. In GISAXS, the X-rays are incident on the sample at a grazing angle αi, and the scattering pattern is recorded by a Pilatus 1M 2D position-sensitive detector with 169 × 179 mm2 active area at a sample-detector distance of 3528 mm.
Formation of NP monolayers and local characterization by SEM
In the experiments, the influence of the volume of the droplet, the concentration of silica particles and the stearyl alcohol on the surface coverage and the uniformity of the monolayer on the wafer were investigated. Here, we considered a 5 μL droplet with 0.1 vol% NPs and 0.1 vol% stearyl alcohol to be the suitable parameters to improve the monolayer quality. When an excessively high concentration and large droplet volume is used, multilayers of silica particles are formed. While, at low concentration and small droplet volume, only separated islands are formed. More details about the preparation of the colloidal dispersion and its mixture with stearyl alcohol are given in Section 2.
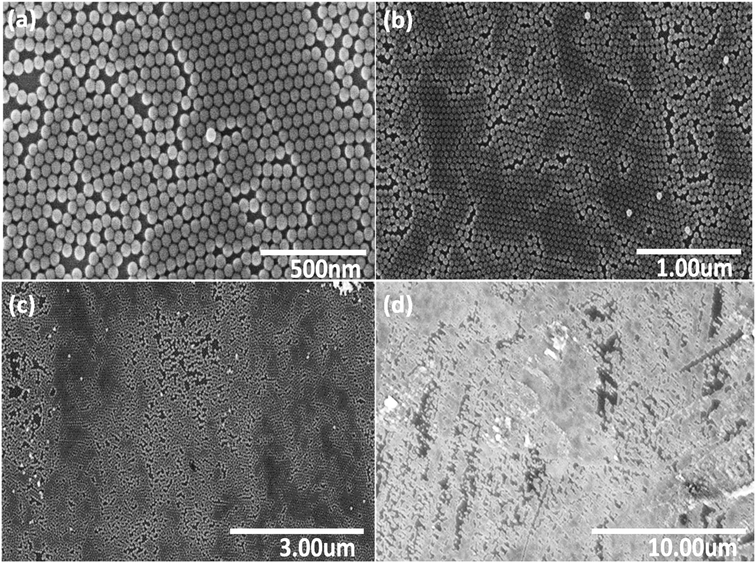
Fig. 2 shows a series of SEM images at different locations and under various magnifications of the NP monolayer obtained after using stearyl alcohol as assistant. As can be seen from the SEM images, less particles are observed in a second (or third) layer, i.e. less multi-layer formation is observed. However, still a lot of cracks appear in the resulting monolayers. So unfortunately, our idea to reduce crack formation by the sole addition of stearyl alcohol does not work. However, the monolayers formed are more long range ordered, i.e. many hexagonal domains which are separated by cracks, still have the same orientation. So the monolayers obtained by the addition of stearyl alcohol are significantly better compared to the monolayers obtained by the simple drop-casting method.
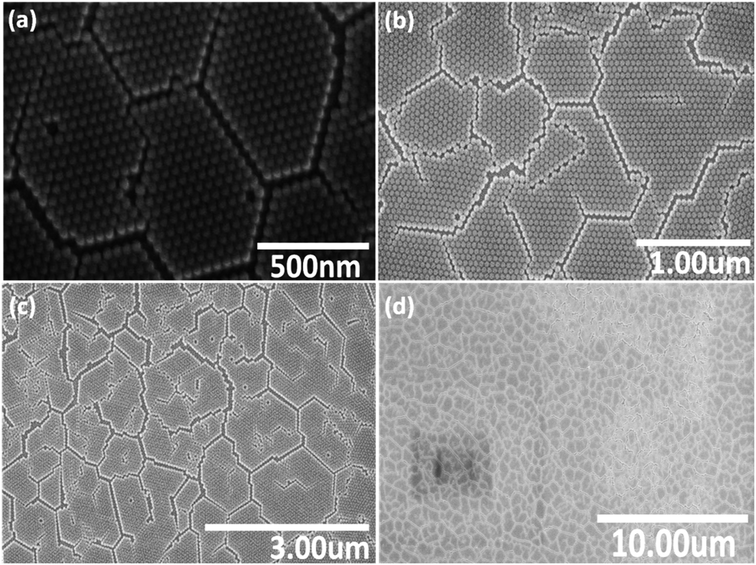 | ||
| Fig. 2 Series of SEM images (a)–(d) with various magnifications, taken at different positions of a monolayer of SiO2 NPs, assembled on a silicon wafer after using stearyl alcohol as assistant. | ||
The reason for the resulting large monolayer is not clear as the effect of the stearyl alcohol is complex. For instance, the precipitation of the stearyl alcohol on evaporation of the toluene, might first take place on the particles and/or on the surface of the wafer. Moreover, the continuous evaporation of the toluene and possible drying from the edge of the droplet, might also play a key role on the monolayer formation. However, this is very speculative and work on the mechanism of this monolayer formation is not easy17 and outside the scope of the present study.
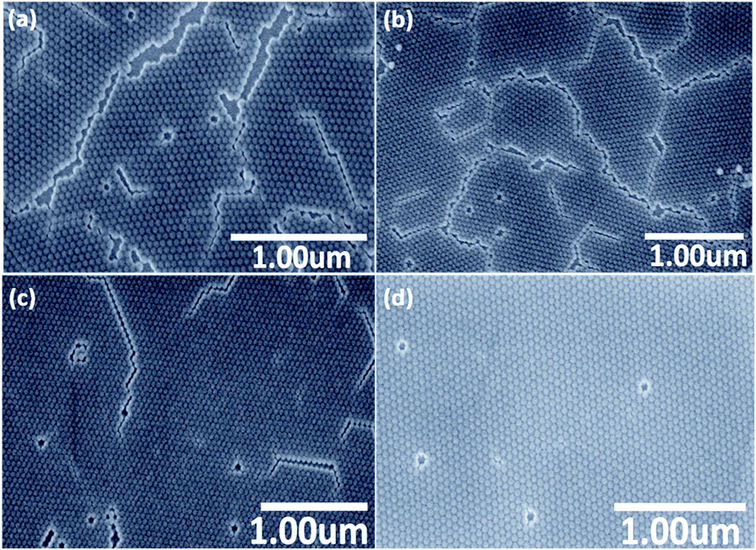
In order to test the idea from the previous section, the monolayer obtained in the previous section was treated at a temperature of about 70 °C, which is 10 degrees above the melting point of stearyl alcohol. The time of the heat treatment was varied in a broad range from 15 minutes up to 10 days. To prevent the slow evaporation of the small amount of stearyl alcohol in the monolayer, we put the sample in a small closed polystyrene box together with a small stearyl alcohol grain, to obtain a stearyl alcohol atmosphere. The optimal heat treatment time was found to be the longest time used of 10 days. However, maybe higher temperature can reduce this time significantly. Furthermore, for industrial requirements, lots of samples can be treated in one oven at the same time. SEM images taken after different duration in the oven at 70 °C are shown in Fig. 3. As can be seen from the SEM images, the degree of ordering improves with longer time in the oven.
Especially for the sample after 10 days a large, uniform, homogeneous monolayer of SiO2 NPs with very large correlation lengths is obtained, also with a good hexagonal order. The ordering between NPs over the whole sample area is evidently improved and the number of cracks is reduced, compared to the first simple drop-casting method without stearyl alcohol and also compared to the second method using stearyl alcohol, but without heat treatment.
Global and depth-resolved characterization by XRR and GISAXS
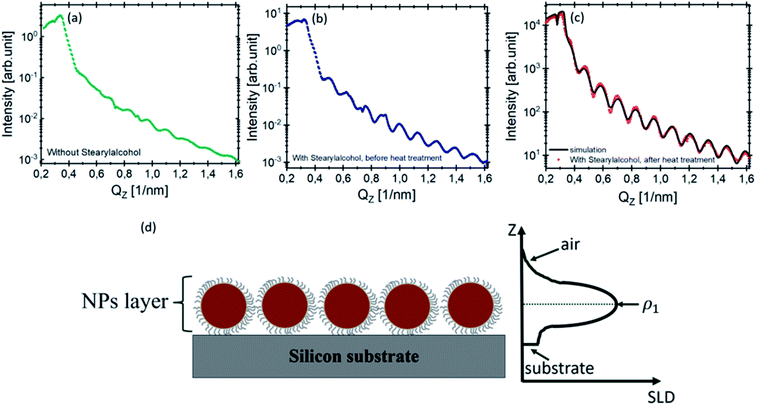
The XRR curve (red point) of the monolayers with stearyl alcohol after 10 days of heat treatment is shown in Fig. 4(c) along with the fit (black solid line). As explained in Section 3.1 of the ESI,† the measured reflectivity curve is well reproduced by assuming a parabolic scattering length density profile of the NP layer. A detailed description of the data treatment is given in the ESI.†
To fit the measured XRR curve of the monolayers obtained after 10 days of heat treatment, we assumed the layer model drawn in Fig. 4(d) consisting of the particle layer on top of the silicon substrate (dark gray). The left side shows the cross section of the model and the right side shows the scattering length density (SLD) variation along the perpendicular direction to the film as extracted from the fit.
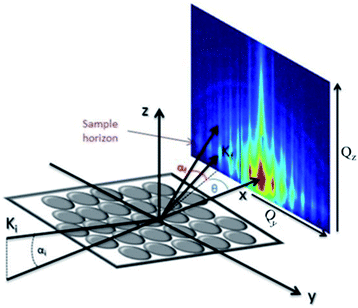
 is directed on a sample surface with a very small incident angle αi with respect to the surface close to the critical angle of total reflection, in order to maximize the amplitude of the X-ray wave function in sample. The X-ray is reflected off the substrate surface, scattered from the particles along
  in the direction (αf, θ) as illustrated in Fig. 5. More details about the geometry of GISAXS and the assignments of the axes are described in G. Renaud et al.18 The periodic order of the nanoparticles in the monolayer produce a diffraction pattern of Bragg rods, which can be indexed to determine the crystal structure, the lattice constant and symmetry of the monolayer.19,20
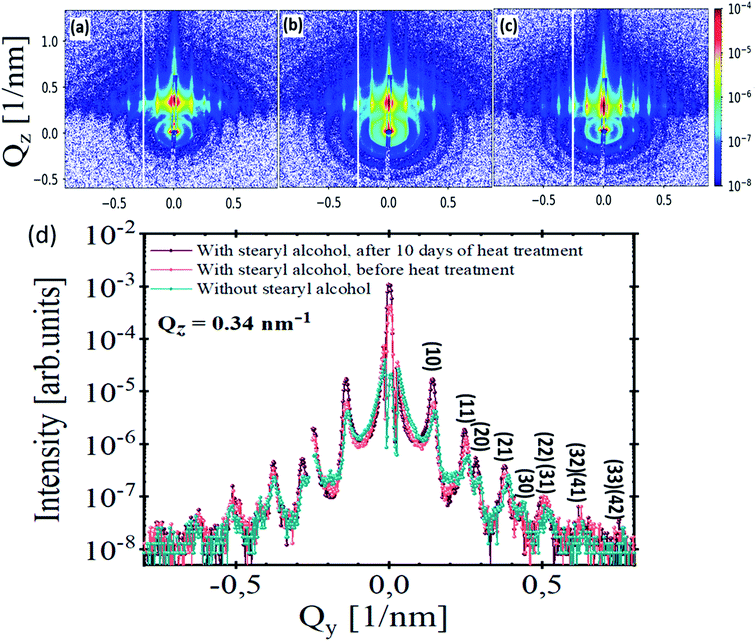
Fig. 6(a)–(c) show GISAXS scattering patterns of stearyl alcohol silica monolayers on silicon substrates. The corresponding SEM images were shown previously as SEM images in Fig. 1, 2 and in 3(d), respectively. The GISAXS measurements were carried out at an incident angle of αi ≈ 0.25°. Distinct vertical Bragg rods visible in all GISAXS patterns along the Qy direction indicate long-range periodic order of the NPs. Furthermore, the rods are sharp in Qz direction, due to the monolayer nature of the NPs. Moreover, rings of diffuse scattering can also be observed in the GISAXS patterns, which are related to the square of the Fourier transform of the particle shape, i.e. the form factor of the individual NPs. Differences between the GISAXS patterns are obvious. After 10 days of heat treatment (Fig. 6(c)), the Bragg rods become more intense and sharper. Also more reflections along Qy are visible. The appearance of these reflections is due to extended order. Furthermore, after 10 days of heat treatment (Fig. 6(c)) the diffuse rings nearly vanish compared to Fig. 6(a) and (b). This means that nearly all particles are taking part in the long range order as scattering from individual defects is largely suppressed. The intensity ratio in each GISAXS maps in Fig. 6 is quantified by comparing the integrated intensity of the Bragg rods to the integrated intensity of the diffuse rings as explained in Section 3.2 of the ESI.† The intensity ratios for each sample are tabulated in Table 1, fourth column.
| Method number | a (nm) | ζ (nm) | Intensity ratio |
|---|---|---|---|
| Method 1 | 49 ± 1 | 266 ± 2 | 2.4 |
| Method 2 | 50.3 ± 0.7 | 314 ± 4 | 7.5 |
| Method 3 | 51.5 ± 0.4 | >480 | 5130 |
The Bragg peaks observed in the GISAXS pattern are indexed by considering a 2-D hexagonal lattice with a lattice constant a = 51.5 ± 0.4 nm (value for method 3), which is larger than the particle diameter due to the stearyl alcohol molecule around the nanoparticles. The lattice constant was calculated from the (10) peak position by using the equation linking the interplanar distance d and the lattice constant a.21 The lattice constant approximately kept the same in all samples produced from the three methods as tabulated in Table 1, second column. The line cuts from the GISAXS patterns (Fig. 6(a)–(c)) along Qy at constant Qz = 0.34 nm−1 are shown in Fig. 6(d). It is obvious that the Bragg peaks become more intense and sharper after 10 days of heat treatment (violet line, Fig. 6(d)). This is indicative for a larger coherence length of the crystalline structure and well-ordered NPs monolayer. After taking the instrument resolution into account, a Lorentzian profile is used to fit the first-order peak in each GISAXS pattern, which yields a structural coherence length ζ of 266 ± 2 nm, 314 ± 4 nm and >480 nm‡ for monolayers without stearyl alcohol, monolayers with stearyl alcohol before heat treatment and for monolayers with stearyl alcohol after 10 days of heat treatment, respectively.
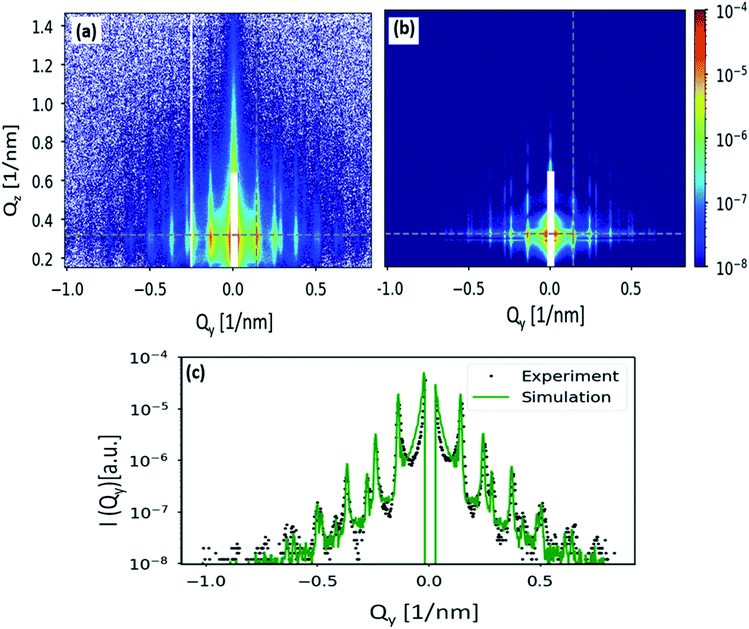
Finally, the GISAXS pattern in Fig. 6(c) is simulated using the BornAgain software22 and compared with the obtained experimental result. As one can see, the simulated pattern shown in Fig. 7(b) closely reproduces the experimental data shown in Fig. 7(a). The GISAXS data has been simulated assuming a two-layers model, consists of a silicon substrate followed by the particles layer. Nanoparticles have a form factor of full sphere with SiO2 core of 23.5 nm radius and a stearyl alcohol shell of 1.7 nm thickness. Since nanoparticles are densely packed, the ambient layer, where the NPs are situated, has been described as a graded interface. A finite 2D hexagonal lattices of randomly selected sizes have been simulated because the sample is not uniformly covered with the NPs but consists of ordered domains of variable size rotated with respect to each other. To consider the polycrystallinity of the film, an orientational distribution has been applied to the simulated domains. Positions and relative intensities of the Bragg rods (Fig. 7(a)) indicate the absence of preferred domain orientations. Therefore, a uniform orientational distribution, i.e. 120 lattice rotation angles in the range between 0° and 60° with equal weights, has been simulated. To account for the nanoparticles size distribution which contributes to diffuse scattering in the GISAXS pattern and broadens the structural peaks, a Gaussian size distribution with FWHM of 3 nm has been applied in the GISAXS model. A full description of the simulation is given in Section 3.3 of the ESI.† The comparison of simulated and measured GISAXS patterns is presented in Fig. 7:
(a) shows the region of interest of the measured pattern.
(b) shows the simulated pattern in the same Q range. Poisson noise has been applied to the scattering intensity.
(c) slice along Qz at Qy = 0.14 nm−1 (position of the first Bragg rod, shown with the vertical gray dashed line in the figures (a) and (b)).
Conclusions
In summary, we have presented a simple, inexpensive approach to obtain highly ordered self-assembled monolayers of stearyl alcohol grafted silica NPs of ≈50 nm in diameter over a large area on a Si substrate using an improved variant of the drop-casting method. The formation of a monolayer is significantly influenced by the NPs concentration, the stearyl alcohol concentration, the volume of the droplet, and the annealing time. The main idea in the present study is the addition of stearyl alcohol to the NP dispersion from where the monolayers are formed. The stearyl alcohol results in monolayers with improved order, as confirmed with SEM for the local order and GISAXS for the long-range hexagonal order. A heat treatment melting the stearyl alcohol in the monolayers leads to nearly perfectly ordered monolayers. This improved ordering is a result of giving the NPs more time to further self-assemble, which is then followed by solidifying the monolayer by simple cooling to room temperature, preventing the large volume change as obtained after evaporation of a solvent. We propose that the heat treatment in combination with a compatible additive with melting point significantly below that of the particles, can be a general method to improve the ordering between particles in monolayers as well as multilayers.Conflicts of interest
There are no conflicts to declare.Acknowledgements
This work was funded in part by the Brain Gain Fund of Forschungszentrum Jülich GmbH. We thank Jochen Friedrich (PGI-7) for the opportunity to use their SEM and for technical support.Notes and references
- M. A. Boles, M. Engel and D. V. Talapin, Chem. Rev., 2016, 116, 11220–11289 CrossRef CAS PubMed.
- V. Karol, et al., Nanotechnology, 2012, 23, 045101–045705 CrossRef PubMed.
- C. B. Murray, C. R. Kagan and M. G. Bawendi, Annu. Rev. Mater. Sci., 2000, 30, 545–610 CrossRef CAS.
- T. Ogi, L. B. Modesto-Lope, F. Iskandar and K. Okuyama, Colloids Surf., A, 2007, 297, 71–78 CrossRef CAS.
- S. Shinde, S. Park and J. Shin, J. Semicond., 2015, 36, 043002 CrossRef.
- M. Szekeres, O. Kamalin, R. A. Schoonheydt, K. Wostyn, K. Clays, A. Persoons and I. Dékány, J. Mater. Chem., 2002, 12, 3268–3274 RSC.
- T. Okubo, S. Chuj, S. Maenosono and Y. Yamaguchi, J. Nanopart. Res., 2003, 5, 111–117 CrossRef CAS.
- Y. Wang, Y. L. Chen, H. Yang, H. Q. Guo, W. Zhou and M. Tao, J. Mater. Sci., 2010, 28, 467–478 CAS.
- H. B. Bohidar and K. Rawat, Design of Nanostructures: Self-Assembly of Nanomaterials, Wiley-VCH Verlag GmbH & Co. KGaA, 1st edn, 2017 Search PubMed.
- F. J. Arriagada and K. Osseo-Asare, J. Colloid Interface Sci., 1999, 211, 210–220 CrossRef CAS PubMed.
- F. J. Arriagada and K. Osseo-Asare, Colloids Surf., 1992, 69, 105–115 CrossRef CAS.
- K. Osseo-Asare and F. J. Arriagada, Colloids Surf., 1990, 50, 321–339 CrossRef CAS.
- A. K. van Helden, J. W. Jansen and A. Vrij, J. Colloid Interface Sci., 1981, 81, 354–368 CrossRef CAS.
- J. Kohlbrecher, J. Buitenhuis, G. Meier and M. P. Lettinga, J. Chem. Phys., 2006, 125, 44715 CrossRef PubMed.
- Jülich Centre for Neutron Science, Journal of Large-Scale Research Facilities, 2016, 2, A61, DOI:10.17815/jlsrf-2-109.
- M. Hu, S. Chujo, H. Nishikawa, Y. Yamaguchi and T. Okubo, J. Nanopart. Res., 2004, 6, 479–487 CrossRef CAS.
- E. Josten, E. Wetterskog, A. Glavic, P. Boesecke, A. Feoktystov, E. B. Reuters, U. Rücker, G. Salazar-Alvarez, T. Brückel and L. Bergström, scientific reports, 2017, 7, 2802 CrossRef PubMed.
- G. Renaud, R. Lazzari and F. Leroy, Surf. Sci. Rep., 2009, 64, 255–380 CrossRef CAS.
- J. Nielsen and D. Morrow, Elements of Modern X-ray Physics, John Wiley & Sons, 2001 Search PubMed.
- S. Disch, E. Wetterskog, R. P. Hermann, G. Salazar-Alvarez, P. Busch, T. Brückel and L. S. K. Bergström, J. Nanosci. Lett., 2011, 11, 1651–1656 CrossRef CAS PubMed.
- D. Mishra, et al., Nanotechnology, 2012, 23, 055707 CrossRef CAS PubMed.
- G. Pospelov, W. Van Herck, J. Burle, J. M. Carmona Loaiza, C. Durniak, J. M. Fisher, M. Ganeva, D. Yurov and J. Wuttke, J. Appl. Crystallogr., 2020, 53, 1600–5767 CrossRef PubMed.
Footnotes |
| † Electronic supplementary information (ESI) available. See DOI: 10.1039/d0ra00936a |
| ‡ About 500 nm is the resolution limit of the instrument. With the present setup only this value can be given as lower bound of the coherence length for method 3. |
| This journal is © The Royal Society of Chemistry 2020 |

