 Open Access Article
Synthesis and characterization of TiO2/Mg(OH)2 composites for catalytic degradation of CWA surrogates†
Martin Šťastný *ab,
Václav Štengla,
Jiří Henych
 a,
Jakub Tolasz
 ab,
Martin Kormundac,
Jakub Ederer
 b,
Gloria Issad and
Pavel Janoš
 b
b
aInstitute of Inorganic Chemistry of the Czech Academy of Sciences, 250 68, Řež, Czech Republic
bFaculty of Environment, University of Jan Evangelista Purkyně in Ústí nad Labem, Králova výšina 3132/7, 400 96 Ústí nad Labem, Czech Republic
cFaculty of Science, University of Jan Evangelista Purkyně in Ústí nad Labem, České mládeže 8, 400 96 Ústí nad Labem, Czech Republic
dInstitute of Organic Chemistry with Centre of Phytochemistry, Bulgarian Academy of Sciences, Ak. G. Bontchev str., bl.9, Sofia, 1113, Bulgaria
First published on 21st May 2020
Abstract
Surface catalyzed reactions can be a convenient way to deactivate toxic chemical warfare agents (CWAs) and remove them from the contaminated environment. In this study, pure titanium oxide, magnesium hydroxide, and their composites TiO2/Mg(OH2) were prepared by thermal decomposition and precipitation of the titanium peroxo-complex and/or magnesium nitrate in an aqueous solution. The as-prepared composites were examined by XRD, XPS, HRTEM, and nitrogen physisorption. Their decontamination ability was tested on CWA surrogates and determined by high-performance liquid chromatography (HPLC) and gas chromatography coupled with mass spectrometry (GC-MS). Dimethyl methyl phosphonate (DMMP) was used as a G simulant for the nerve agents sarin (GB) and soman (GD) while 2-chloroethyl ethyl sulfide (2-CEES) and 2-chloroethyl phenyl sulfide (2-CEPS) were used as surrogates of sulfur mustard (HD). The activity of the as-prepared composites was correlated with acid–base properties determined by potentiometric titrations and pyridine adsorption studied by in situ DRIFTS. The mixing of Ti and Mg led to an increase of the surface area and the amount of surface –OH groups (with an increasing amount of Ti) that caused improved degradation of DMMP.
Introduction
Chemical warfare agents (CWAs) are a group of hazardous chemicals whose deleterious effects have been deliberately used against humans to damage the essential physiological functions of the body.1 CWAs include blistering agents (yperites), asphyxiating agents (phosgene), and nerve agents (acetylcholinesterase enzyme inhibitors).2For detoxification and decontamination of the environment affected by CWAs, various chemical agents (NaOH, NaClO, Ca(ClO)2) utilizing mostly hydrolytic and oxidation reactions are used. Advantageously, these reactions may be employed under relatively mild conditions (ambient temperature, atmospheric pressure), and the degradation products formed can be either burned or bituminized.3 However, their use may be limited due to the generation of significant amounts of liquid waste. In recent years, the unique nanostructured materials (called “reactive sorbents” or “destructive adsorbents”) have been developed. They can efficiently bind and destroy certain dangerous chemicals, including toxic organophosphate nerve agents sarin,4–6 soman,7–9 VX,10–12 or organophosphorus pesticides,13–15 and rapidly decompose them into non-toxic or less toxic products. The surface catalysis of CWAs, their surrogates, or related environmental pollutants, such as pesticides, was documented on pure nanostructured metal oxides MgO,16,17 CaO,10 TiO2,9 MnxOy,18 Fe2O3,19 Al2O3 (ref. 20) or CeO2.15
Their excellent activity stems from a combination of their high specific surface area (∼hundreds m2 g−1), suitable porosity, and a large number of shape dislocations (edges, corners) and structural defects that can act as active sites for adsorption and chemical degradation.21 Nanoscale magnesium oxide (MgO) is a well-known basic oxide that readily reacts with organophosphorus compounds at ambient temperatures by stoichiometric degradation.22,23 The so-called nanocrystalline Mg oxides (AP-MgO) can be prepared by high-temperature supercritical drying firstly described by Klabunde et al. (2001).24 This method is based on hydrolysis of organometallic compounds, mostly alcoholates (e.g., magnesium methoxide Mg(OCH3)2), followed by supercritical drying in an autoclave in a mixture with toluene at 265 °C. These materials were efficient for destructive adsorption of 2-CEES. Similarly, MgO nanoparticles with a surface area up to 1236 m2 g−1 were prepared by Štengl et al. (2003).25
Furthermore, the specific activity of these sorbents can be improved by formation of mixed or doped oxides and nanocomposites. Thus-prepared materials may have better catalytic properties due to their morphology and structural features, large specific surface, or more active sites.26,27 Metallocene Ziegler-Natta Ti/Mg-mixed catalysts are studied for producing commercially essential polymers such as polypropylene (PP) by radical or ionic polymerization.28 The detailed study of structural properties of Ti/Mg mixed oxides or composites prepared by various methods were reported in several recent studies. Liu et al. (2014) described the synthesis of Mg/Ti nanocomposites by co-precipitation of anhydrous magnesium chloride (MgCl2), titanium tetrachloride (TiCl4) and lithium naphthalide (LiNp) in tetrahydrofuran (THF) solution for rapid hydrogen absorption at room temperature.29 Depending on synthesis procedure, various Ti and Mg oxide phases can be obtained, such as hexagonal MgO and tetragonal γ-TiH2 phases forming irregularly shaped particles aggregating together,29 crystalline MgO and anatase TiO2 with mesoporous structures containing spherical nanoparticles30 or nanocomposite rods representing MgO, TiO2, MgTiO3, and Mg2TiO4 crystal forms.31 These materials are mostly used for adsorption of heavy metals,32,33 photocatalytic degradation of organic azo dyes,34,35 or in dye-sensitized solar cells.36,37 Nevertheless, their use in catalytic degradation of CWA surrogates was not reported yet.
In this work, TiO2/Mg(OH)2 nanocomposites were prepared by simple thermal hydrolysis of titanium peroxo-complexes in an aqueous solution. The as-prepared catalysts were tested for degradation of CWA surrogates (DMMP, 2-CEES, and 2-CEPS) in water evaluated by chromatographic methods (HPLC, GC-MS) and in situ DRIFTS spectroscopy.
Materials
Titanium oxo-sulfate (TiOSO4), magnesium nitrate (Mg(NO3)2), sodium hydroxide (NaOH), ammonia solution (NH4OH), and hydrogen peroxide, 30% (H2O2) were purchased from Sigma-Aldrich (Czech Republic). Pyridine (99,5%, p.a.) was obtained from Verkon, Czech Republic. Nerve agent surrogates dimethyl methylphosphonate (DMMP), 2-chloroethyl ethyl sulfide (2-CEES), and 2-chloroethyl phenyl sulfide (2-CEPS) were purchased from Sigma-Aldrich as chromatographic standard (>97%). HPLC organic solvents (Fischer scientific, Czech Republic) were used to prepare the solutions, including the mobile phases for liquid chromatography.Experimental
TiO2/Mg(OH)2 based catalysts were prepared according to the scheme shown in Fig. S1.† Further details are given in Sections S1–S3 of the ESI.†Powder X-ray diffraction (PXRD) patterns were obtained using Bruker D2 diffractometer equipped with a conventional X-ray tube (Cu Kα radiation, 30 kV, 10 mA) and the LYNXEYE 1-dimensional detector. The primary divergence slit module width 0.6 mm, Soler Module 2.5, Airscatter screen module 2 mm, Ni Kbeta-filter 0.5 mm, step 0.00405°, and time per step 0.3 s were used. The qualitative analysis was performed with a DiffracPlus Eva software package (Bruker AXS, Germany) using a JCPDS PDF-2 database. The crystallite sizes were calculated from diffraction line broadening using the Scherrer formula:38
 | (1) |
The specific surface area and porosity of the powder samples were measured using a Quantachrome NOVA 4200e instrument at liquid nitrogen temperature. The samples were degassed for 6 hours at 150 °C. The Brunauer–Emmett–Teller (BET) method was used for surface area calculation. The BJH method (Barrett, Joyner, and Halenda) was used for calculating pore size distributions.39
X-ray photoelectron spectroscopy (XPS) measurements were performed using a SPECS PHIBOS 100 hemispherical analyzer with a 5-channel detector and a SPECS XR50 X-ray source equipped with an Al anode. The calibration of the binding energy (BE) was performed using the C 1s main component set to 285 eV. Survey spectra were recorded with a pass energy of 40 eV, and the high-resolution spectra were recorded as a sum of 10 acquisitions with a pass energy of 10 eV. A Shirley background profile was used for data processing in CasaXPS software. The charge compensation was made by a C 1s peak calibration process. The C 1s peaks have a single peak character attributed to C–C bonds and calibrated to the binding energy (BE) of 284.8 eV.
The morphology of the samples was inspected by transmission electron microscopy (TEM) using a 200 kV TEM microscope FEI Talos F200X. A microscopic 300-Mesh Regular Copper Grid coated with a thin transparent silicon dioxide (SiO2)/monoxide (SiO) was used for the preparation of samples.
Adsorption/degradation tests were performed using a nerve-agent surrogate as an internal standard (0.095 mg mL−1 in deionized water). In this procedure, 0.03 g of the catalyst was mixed with 0.5 mL water and 0.5 mL of the nerve-agent surrogate standard in a series of covered vials (Eppendorf, 2 mL) by aluminum foil protected to sun-light. At pre-determined time intervals (0, 5, 15, 20, 30, 50, 70, 90, and 120 min), the reaction was terminated by the addition of 0.5 mL of formic acid (0.1%), and the powder catalyst was separated by centrifugation (10![[thin space (1/6-em)]](https://www.rsc.org/images/entities/char_2009.gif) 000 rpm, 2.5 min).
000 rpm, 2.5 min).
Photocatalytic tests were carried out in a batch arrangement in a laboratory air-cooled UV-box without external light access. Three UV lamps (PL-S 230 V/11 W, HADEX, s.r.o., Czech Republic) with the maximum radiation at 365 nm were used. All photodegradation experiments were performed in aqueous solutions (10 mL) at the same initial CWA surrogate concentration (0.095 mg mL−1) and catalyst dose (150 mg). Photocatalytic experiments were carried out at room temperature and without pH adjustment. A round bottom crystallization dish was used as the reaction vessel.
The supernatant was analyzed immediately by high-performance liquid chromatography (HPLC). All catalytic experiments were conducted at the laboratory temperature of 22 ± 1 °C. In each series of measurements, several types of quality control experiments were performed: Blank experiments without the presence of powder catalysts.
The surface acidity of the catalysts was investigated by adsorption of pyridine (Py) vapours at room temperature (30 °C). Powder sample was placed in DRIFT cell, heated at 150 °C for 30 min, and cooled to room temperature (30 °C) under constant flow (100 mL min−1) of nitrogen gas. Then the Pyridine was dosed for 5 min using flow of nitrogen through saturator with liquid Py, and then the DRIFT cell was flushed with pure Nitrogen for 15 min. FTIR spectra were recorded using a Thermo Nicolet NEXUS 670 FTIR spectrometer, equipped with a nitrogen-cooled detector and accumulating 64 scans at a spectral resolution of 4 cm−1.
The concentration of CWAs surrogates was determined by liquid chromatography using a Dionex UltiMate® 3000 U-HPLC system with Diode Array Detector (DAD) operating at 230 nm, Rheodyne 7725i injection valve with a 20 μL sampling loop, and a Hypersil GOLD column (Thermo ScientificTM) 250 × 4.6 mm, packed with a C18 stationary phase, 5 μm. Acetonitrile (HPLC-gradient grade, Thermo Fischer Scientific) with the addition of formic acid (0.1%)/water acidified with formic acid (0.1%) was used as mobile phase with a set gradient from −1.5 minute up to 0 minutes for the column equilibration and from 0 minutes (30% acetonitrile) up to 10 minutes (95% acetonitrile), at a flow rate of 1.2 mL min−1 and the column temperature of 30 °C.
A portion of the resulting supernatants obtained after the catalytic reaction was adjusted by a static headspace after the establishment of the equilibrium state between the liquid and vapor phase. The gas-phase was collected using a Hamilton gas-tight syringe and immediately injected into the gas chromatograph with mass spectrometry (GC-MS). The gas chromatograph was an Agilent 6890N model with an HP-5 column 19091J-413 (5%-phenyl-methylpolysiloxane, 30 m × 0.32 mm I.D. × 0.25 μm film thickness), and mass spectrometry (MS) JEOL JMS-Q100GC was used for the identification of the main degradation products of the surrogates. The operation was carried out in an electronic impact (EI) ionization mode. Helium (99.999%) was the carrier gas at the flow rate of 2.0 mL min−1. The temperature program for the chromatographic run (after optimization) was the following: T0 = 40 °C; T0 − T1, 20°C min−1, T1 = 260 °C (hold time, 6 min). The injection was set to a splitless mode at 200 °C; the injection volume was 1.0 μL; the total run time was ∼20.00 min. The EI ionization was performed at an electron energy of 70 eV, and m/z ratio 50–200 was recorded in the full-scan mode.
DMMP adsorption on the surface of the catalyst (Ti050Mg050) at ambient temperature was observed by FTIR diffuse reflectance spectroscopy (DRIFTS) using a Thermo Nicolet NEXUS 670 FTIR spectrometer. In a typical experiment,40,41 the powder sample was placed in a DR cuvette (Praying Mantis, Harrick) and a droplet (5 μL) of a liquid DMMP (97%, Sigma Aldrich) was dosed by an automatic micropipette. The acquisition of spectra was started immediately and repeated in selected time intervals (0, 15, 30, 50, 90, and 120 min). All presented spectra were processed using OMNIC Spectra software.
Acid–base potentiometric titrations were performed on an automatic titrator controlled by a PC (794 Basic Titrino, Metrohm, Switzerland) with a potentiometric endpoint determination. Typically, 75 mg of sample catalyst was weighed into the titration vessel, 30 mL of NaCl was added (0.1 mol L−1), 3 mL of a standardized solution of HCl (0.1 mol L−1 in 0.1 mol L−1 NaCl) and the suspension was mixed and bubbled by nitrogen for 30 minutes. Subsequently, the samples were titrated with standardized 0.1 mol L−1 NaOH (in 0.1 mol L−1 NaCl) with continuous stirring with a magnetic bar under nitrogen atmosphere. The rate of titrant was 0.1 mL min−1 in 0.05 mL aliquots.
Results and discussion
Materials characterization
By combining titanium oxide and magnesium hydroxide, a nanocomposite material with a very well-defined structure, a high specific surface area, and a high proportion of reactive sites has been obtained. By mixing the appropriate amount of TiO2 and Mg(OH)2, the acid–base properties, as well as the specific surface area of the resulting material can be effectively controlled. The TiO2/Mg(OH)2 composites were prepared by thermal decomposition and precipitation of titanium peroxo-complex and/or magnesium nitrate in an aqueous solution as described in detail in ESI S1, S2, and S3.†Compared to pure oxides or hydroxides, respectively, the activity of the resulting materials for CWA surrogates degradation can be increased several times, as shown below. Herein, the as-prepared TiO2/Mg(OH)2 composites were denoted as TiXXXMgYYY, where XXX and YYY represent the percentage ratio of TiO2 and Mg(OH)2, respectively (see Table S1†). The as-prepared composites were examined by XRD, XPS, HRTEM, and nitrogen physisorption.
The results of the material characterization are given in ESI S4† (X-ray powder diffraction, XRD) and S5 (nitrogen physisorption), respectively.
The XPS data provided information about the surface chemical states of Ti, Mg, and O in mixed TiO2/Mg(OH)2 composites (Table S4 and ESI Fig. S4–S6†). In the Mg 2p region of the samples Ti020Mg080 and Ti000Mg100 (see Fig. S4†), the peak found at binding energy ∼49 eV indicates presence of Mg(OH)2 phase.42,43 Higher Ti concentration in the samples (Ti050Mg050, Ti080Mg020) leads to the broadening and shifting of the peak to lower energies indicating strong interaction of Ti and Mg ions. Ti 2p peaks (see Fig. S6†) with the binding energies at 464–458 eV (samples marked as Ti100Mg000, Ti080Mg020, and Ti050Mg050) were assigned to TiO2. However, the Ti2p doublet in Ti080Mg020 but mainly in Ti050Mg050 was significantly shifted to a lower BE, which suggests, again, strong interaction of Ti3+ with Mg2+. The Ti2p peaks were also tentatively deconvoluted to single TiO2 phase peaks with minor contributions of sub-stoichiometric Tix<4+ oxides with BE ca. 456.2 and 457.7 eV.44 In the sample with 20% Ti, the Ti 2p peaks were completely missing suggesting that the Ti phase is covered by Mg(OH)2 overlayer. The O 1s deconvoluted peak (Fig. S6†) of pure titania with maximum at 530 eV correspond to Ti–O bond (a lattice oxygen peak O2−) while binding energy of 532 eV corresponds to surface Ti–OH bond. In the O 1s spectra of the samples with higher magnesium content, dominates the peak with a maximum at ∼531 eV that may be associated principally with the presence of oxygen in magnesium hydroxide.45 Nevertheless, the detailed deconvolution and assignment of the peaks is challenging due to the complexity of the oxygen species present in the samples.
TEM and HRTEM micrographs of the TiO2/Mg(OH)2 samples (see ESI Fig. S7–S9†) showed spindle-like nanoparticles, typical for thermal hydrolysis of Ti peroxo-complexes as has been previously reported,46 with Mg(OH)2 plate-like overlayer. This is already evident in the sample with the lowest titanium content (Ti020Mg080). High-resolution analysis (in Fig. 1) of the sample Ti050Mg050 revealed the interplanar distances 0.344 and 0.823 nm which correspond to the planes (0 1 1) of anatase and to (0 0 1) of brucite, as inferred from the diameter of the diffraction rings obtained from the Fast Fourier Transform (FFT). The calculated interplanar distances for other samples are 0.242 nm for the Ti020Mg080 sample, which corresponds to (0 0 2) plane of brucite. For Ti080Mg020, 0.205 and 0.211 nm distances correspond to (0 1 2) plane of brucite while distances 0.238 and 0.378 nm were assigned to (0 0 4) and (0 1 1) planes of anatase, respectively. 0.190 and 0.355 nm distances found in the Ti100Mg000 sample belong to (0 2 0) and (0 1 1) planes of anatase. The elemental composition obtained from the TEM/EDS mapping is presented in Table S2.†
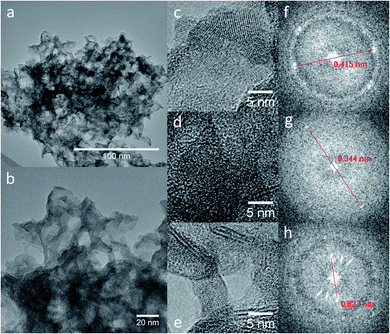 | ||
| Fig. 1 TEM (a) and HRTEM (b–e) micrographs of sample marked as Ti050Mg050. Insets (f–h) give a magnification of selected areas and appropriate FFR patterns. | ||
qt = q1![[thin space (1/6-em)]](https://www.rsc.org/images/entities/char_2009.gif) exp(−kt) + q∞ exp(−kt) + q∞
| (2) |
| Sample | Catalytic degradation of DMMP in water | Qualitative parameters | |||
|---|---|---|---|---|---|
| k ± SEa (min−1) | τ1/2b (min) | dc (% 120 min−1) | dR2 | SEEe | |
| a SE is the standard error of the estimated parameter.b τ1/2 is the half-life time of the decaying quantity DMMP (min).c d is the degree of DMMP conversion after 120 minutes (%).d R2 is the determination coefficient obtained by fit.e SEE is the standard error of the estimate. | |||||
| Ti000Mg100 | 0.022 ± 0.008 | 31.5 | 52.2 | 0.9819 | 0.007 |
| Ti020Mg080 | 0.061 ± 0.006 | 11.3 | 90.3 | 0.9902 | 0.001 |
| Ti050Mg050 | 0.065 ± 0.004 | 10.7 | 98.4 | 0.9937 | 0.008 |
| Ti080Mg0200 | 0.078 ± 0.009 | 8.9 | 91.2 | 0.9839 | 0.002 |
| Ti100Mg000 | 0.016 ± 0.007 | 43.3 | 41.8 | 0.9700 | 0.007 |
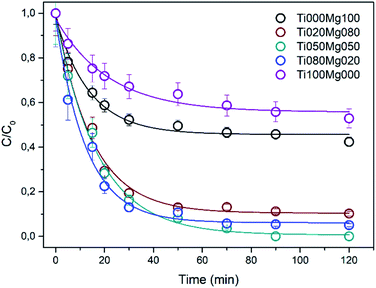
The normalized kinetic curves for DMMP degradation in the dark on TiO2 and Mg(OH)2 and their composites are presented in Fig. 2. Interestingly, the degradation efficiency of the composites is higher than those of pure TiO2 and Mg(OH)2. As can be seen in Table 1, the rate constant k for DMMP degradation on the most active sample (Ti080Mg020) is ∼0.078 min−1, which corresponds to reaction half-time (τ1/2) ca. 9 min. The relatively high activity was also observed for other composites ranging from 0.061 (Ti020Mg080) to 0.065 min−1 (Ti050Mg050) with reaction half-times (τ1/2) ∼11 minutes. Fig. S12A and B† show the dependency of the rate constant and degree of DMMP conversion after 120 min, respectively, on the surface area of the samples. As can be concluded, the mixing of Ti and Mg leads to an increase of the specific surface area (SA) that results in improvement of both degradation rate and efficiency. The most active sample for DMMP degradation (Ti080Mg020, kDMMP ∼ 0.78 min−1) had also the highest specific surface area (∼223 m2 g−1) and porosity (∼0.40 cm3 g−1). On the other hand, the Ti050Mg050 sample had the highest degree of DMMP conversion (∼98%) after 120 min, which indicate that also the qualitative surface properties are important as will be discussed further below.
Sample Ti050Mg050 was further tested for degradation of sulphur mustard (yperite) surrogates 2-CEES and 2-CEPS (see Table S5†). The rate constant for 2-CEES degradation was 0.115 min−1 and degree of conversion ∼79.5% after 120 minutes. The degradation of 2-CEPS was more efficient and reached nearly 95% conversion within 120 minutes but the rate constant was more than two times smaller 0.047 min−1 with half-life ∼15 min. Kinetic curves for 2-CEES and 2-CEPS degradation are shown in Fig. S10.†
In an aqueous environment, metal oxides are covered with surface hydroxyl groups (S–OH0), whereas the presence of two lone electron pairs and dissociable hydrogen ion indicates that these groups are ampholytic. Adsorption of H+ and OH− ions is thus based on protonation and deprotonation of surface hydroxyls, as shown by eqn (3) and (4), where S represents the surface of the material:49,50
![[triple bond, length as m-dash]](https://www.rsc.org/images/entities/char_e002.gif) S–OH0 + H+ ↔ S–OH2+ S–OH0 + H+ ↔ S–OH2+
| (3) |
![[triple bond, length as m-dash]](https://www.rsc.org/images/entities/char_e002.gif) S–OH0 ↔ S–O− + H+ S–OH0 ↔ S–O− + H+
| (4) |
The pH at which the concentrations are equal [S–O−] = [S–OH2+] is known as point zero charge (pHPZC).51
The acidity/basicity and the point of zero charge (PZC) of TiO2/Mg(OH)2-based composites were determined by direct titration with a potentiometric endpoint determination.
The point of zero charge (PZC) has been evaluated from titration curves which have been transformed into curves corresponded to the total concentration of protons consumed in the titration process (TOTH) and can be calculated from the following equation:52
 | (5) |
The amount of surface hydroxyl groups per solid weight of catalyst (q-OH) was calculated from the two equivalence points of the titration curve (VEP1 and VEP2) by the following formula:
 | (6) |
The amount of consumed OH− to reach pH value 10.5, the amount of surface hydroxyl groups (q-OH), and pHPZC are summarized in Table 2.
| Sample | Consumed OH– [mmol g−1] | q-OH [mmol g−1] | pH(PZC) |
|---|---|---|---|
| Ti100Mg000 | 1.05 | 0.265 | 5.01 |
| Ti080Mg020 | 2.89 | 0.717 | 4.77 |
| Ti050Mg050 | 4.35 | 0.497 | 4.78 |
| Ti020Mg080 | 1.67 | 0.151 | 9.34 |
| Ti000Mg100 | 0.91 | 0.152 | 9.85 |
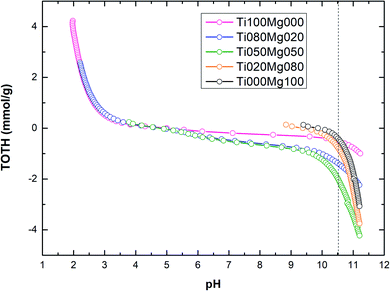
The titration curves of TOTH vs. pH calculated according to eqn (5) for TiO2/Mg(OH)2 composites are shown in Fig. 3.
As can be seen in Fig. 3 and Table 2, the amount of hydroxyl ions (OH−) consumed during the titration process (to reach pH value 10.5) increase in the order Ti000Mg100 < Ti100Mg000 < Ti020Mg080 < Ti080Mg020 < Ti050Mg050. In general, the amount of hydroxyl groups (OH–) consumed during titration are directly related to the buffering capacity of the catalysts. The sample denoted as Ti000Mg100 (pure magnesium hydroxide) showed the lowest capacity while sample denoted as Ti050Mg050 has the highest capacity.
TOTH curves were used for the estimation of samples pH corresponding to the PZC values. The higher content of magnesium hydroxide (Ti020Mg080 and Ti000Mg100) significantly increases the initial pH of the solution. In general, at pH < pHPZC, the surfaces of composites were positively charged, while at pH > pHPZC, the surfaces of composites were negatively charged.
Fig. 3 shows that at pH < 5, the surfaces of composites with higher Ti content (Ti100Mg000, Ti080Mg020 and Ti050Mg050) were positively charged, and at pH > 5, they were negatively charged. However, composites with higher Mg content (Ti020Mg080 and Ti000Mg100) were positively charged at pH < 10, and at pH > 10 were negatively charged. As can be seen from Table 2, the higher Mg(OH)2 content, as well as higher basicity of samples (pHPZC ∼9.3–9.9), can be ascribed to higher amount of unsaturated oxygen atoms coordinated to the Mg atoms.53 The calculated pHPZC values are in accordance with some of the previous works.54,55 Specific adsorption of Cl− ions on the TiO2 surface could be responsible for slight changes in pHPZC values.54
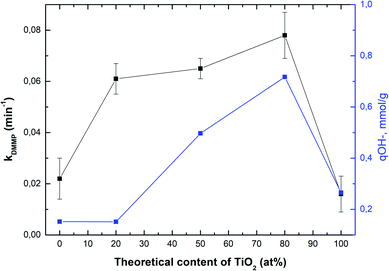
Fig. 4 shows the correlation between the rate constant for DMMP degradation and content of TiO2 in samples (black line), whereas the blue line shows a correlation between the amount of hydroxyl groups and content of TiO2. As can be seen, the sample denoted as Ti080Mg020 showed the highest both the rate constant and the amount of hydroxyl groups. The results clearly show that with the increasing amount of TiO2 in composites, not only the specific surface area (see Table S2†), but also the amount of available surface –OH groups increase significantly.
Furthermore, TiO2 acts also as a photocatalyst, and the highest content of hydroxyl groups could be beneficial during photocatalysis because they can serve as a source of reactive oxygen species which can attack DMMP molecule and lead to its further degradation.56 Therefore, UV-A photocatalytic degradation of DMMP was determined on Ti100Mg000 (pure titania), Ti020Mg080, and Ti080Mg020. The results (see Fig. S11†) show that illumination slightly improves the degradation rate of all tested samples. In addition, Mg(OH)2 present in the composite may acts as an electron trap and barrier for recombination, enhancing the overall photocatalytic activity of TiO2.57
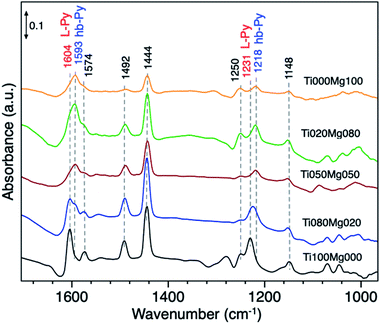
The acid–base properties of TiO2/Mg(OH)2 catalysts were also by adsorption of pyridine (Py) as a probe molecule. This analysis has been widely used to distinguish the presence of Lewis and/or Brønsted acid sites.58 Fig. 5 compares the IR spectra of catalysts with different Ti and Mg ratios.
The typical vibration modes of the pyridine adsorbed species υ(CCN) appear in the frequency range between 1650 and 1400 cm−1.59 The infrared spectrum of adsorbed pyridine shows two modes which can be assigned to (i) hydrogen-bonded pyridine (hb-Py); and (ii) coordinated pyridine (L-Py).
The infrared spectrum of pure TiO2 (Ti100Mg000) and Ti080Mg020 composite displays bands, which are indicative of the formation of L-Py species at 1604, 1574, 1492, 1444 and 1231 cm−1. The coordination of Py molecules to the surface and consequent formation of L–Py indicates coordinatively unsaturated metal sites (Lewis acid sites). These bands are particularly intense in the case of pure TiO2, that suggests strong acidity of Ti cations.
On the other hand, the formation of hydrogen-bonded Py molecules (hb-Py) suggested the bands at 1593 and 1218 cm−1. As evident, these bands have low intensity on pure titania but became prominent with an increasing amount of Mg. These bands confirm the availability of H-bond donor sites (surface–OH groups with low acidity), especially on samples with higher Mg content (<50%).
In the case of DMMP degradation, DMMP molecules may react with intercalated or physisorbed water molecules which are present on the surface of catalysts (including various surface hydroxyl –OH groups), or with strong Lewis acid sites (i.e., Ti4+, Ti3+, Mg2+ as was evident from XPS results) that can play an important role in the first step of DMMP adsorption.60
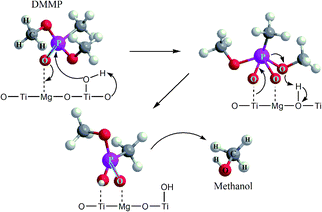
It has been reported that DMMP dissociative adsorption on MgO took place via nucleophilic attack,61 where the electron-rich oxygen of P![[double bond, length as m-dash]](https://www.rsc.org/images/entities/char_e001.gif) O group of DMMP molecule interacts with coordinatively unsaturated magnesium sites (Lewis acid) or with a surface hydroxyl group. The phosphorus center of P
O group of DMMP molecule interacts with coordinatively unsaturated magnesium sites (Lewis acid) or with a surface hydroxyl group. The phosphorus center of P![[double bond, length as m-dash]](https://www.rsc.org/images/entities/char_e001.gif) O bond might be subject to nucleophilic attack by the surface –OH groups. Subsequently, the loss of one methoxy group (CH3O–) from surface-bound DMMP molecule results in formation of methanol (or formic acid) as the main volatile hydrolysis products released from the catalyst surface, and non-volatile products [CH3(CH3O)P]ads or [CH3(CH3O)PO]ads immobilized on the surface of MgO.62
O bond might be subject to nucleophilic attack by the surface –OH groups. Subsequently, the loss of one methoxy group (CH3O–) from surface-bound DMMP molecule results in formation of methanol (or formic acid) as the main volatile hydrolysis products released from the catalyst surface, and non-volatile products [CH3(CH3O)P]ads or [CH3(CH3O)PO]ads immobilized on the surface of MgO.62
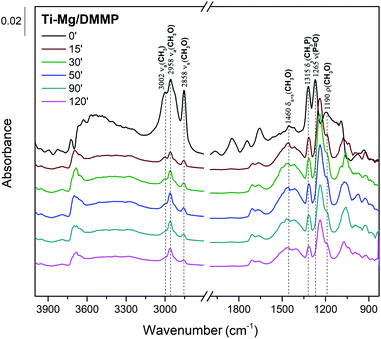
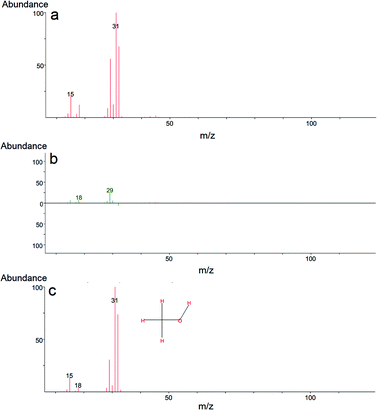
To propose a tentative degradation mechanism for DMMP surrogate on the prepared composites, the results from in situ DRITS and GC-MS techniques were combined. The obtained time-resolved DRIFTS spectra for the DMMP degradation on the Ti050Mg050 sample are presented in Fig. 6. The bands were assigned according to the literature.63,64 In the region below 1500 cm−1, the presence of methoxy groups (CH3O–) is confirmed by antisymmetric and symmetric vibrations centered at around 1460 cm−1. The intensity of this band gradually decreases in time, indicating the degradation of surface adsorbed methoxy groups by their hydrolysis to gaseous methanol. Its formation indicates the absence of characteristic vibrations of the surface adsorbed metal–(OCH3) groups in the CH region with characteristic wavenumbers at about 2850–2960 cm−1. The decomposition of the methoxy groups is also manifested by the gradual extinction of υs(CH3O) centered at 2858 cm−1. At the same time, the shift of the symmetric valence vibration υ(P![[double bond, length as m-dash]](https://www.rsc.org/images/entities/char_e001.gif) O) to the lower values (1265 cm−1 → 1242 cm−1) indicates the binding of electron-rich phosphoryl oxygen (P
O) to the lower values (1265 cm−1 → 1242 cm−1) indicates the binding of electron-rich phosphoryl oxygen (P![[double bond, length as m-dash]](https://www.rsc.org/images/entities/char_e001.gif) O) in DMMP to the metal atom (Lewis acid) or hydroxy group (Brønsted acid).65 The catalytic decomposition of DMMP into gaseous methanol on the surface of the composites was also confirmed by GC-MS analysis, as shown in Fig. 7.
O) in DMMP to the metal atom (Lewis acid) or hydroxy group (Brønsted acid).65 The catalytic decomposition of DMMP into gaseous methanol on the surface of the composites was also confirmed by GC-MS analysis, as shown in Fig. 7.
Furthermore, the bands related to CH3P (centered at 1315 cm−1) remain very stable. This suggests the dissociation of DMMP is realized by the liberation of methoxy groups and that the final surface product (containing P-bounded methyl groups) is [CH3(CH3O)P]ads.66 Based on the DRIFTS and GC-MS analysis, the degradation mechanism was proposed in Fig. 8.
The catalytic degradation of mustard gas (HD) and its simulants (2-CEES, 2-CEPS) has been studied in detail on various metal oxides over the past 20 years.67,68 HD detoxification include nucleophilic substitution, elimination of HCl, and oxidation through cleavage of C–Cl, and S–C bonds. The catalytic reaction of HD on the basic sites of nanostructured alumina (Al2O3) gives 2-chloroethyl vinyl sulfide (CEVS) and divinyl sulfide (DVS) as products.21 Similar products were identified during degradation of 2-CEES over nanosized TiO2,69 MgO, and Mg(OH)2.23 DVS and 1,4-oxathiane were detected in HD reaction with AgY zeolite (the formation of 1,4-oxathiane was presumably attributed to a presence of Ag+ ion on the surface).70
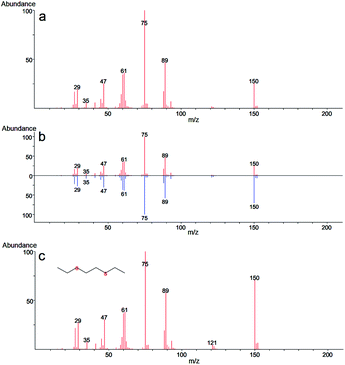
In our case, GC-MS analysis of the headspace extracts of the reaction mixture revealed volatile 1,2-bis(ethylthio)ethane (BETE) degradation product as suggesting m/z values 29, 35, 47, 61, 75, 89, 121 and 150 (see Fig. 9).
The formation of this product suggests the surface catalytic dehydrohalogenation/dimerization of 2-CEES. The reaction is initiated by the cleavage of the S–C bond and the formation of a new S–C bond between two units. Alkoxy species on the surface react with sulfonium cations (S+), giving rise to BETE and –OCH2CH3 groups. Verma et al. reported the formation of EVS and alkoxy species after the interaction of 2-CEES with the hydroxyl groups on ZrO2 (ref. 71) or WO3 (ref. 72) nanoparticles.
We assume that in the first step during the catalytic reaction, the intermolecular cyclization process forms a cyclic sulfonium cation (S+). This cation is highly unstable and reacts immediately with the surface water molecules (present as surface hydroxyl groups), and by reaction with another cyclic cation forms volatile BETE. In the case of dehydrohalogenation reaction, the formation of BETE ensues from the reaction with the metal centers acting as Lewis acids and promoting the cleavage of the labile C–Cl bond in the 2-CEES molecule.73,74 The formation of BETE was also reported in the case of interaction of 2-CEES with the Zr–OH phase75 and zinc peroxide nanoparticles.76 No other degradation products, such as 2-hydroxyethyl ethyl sulfide (HEES), ethyl vinyl sulfide (EVS), diethyl disulfide (DEDS), were observed in the headspace extract. The proposed degradation mechanism of 2-CEES on TiO2/Mg(OH)2 composites is shown in Fig. 10.
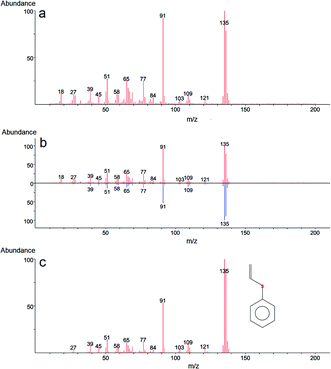
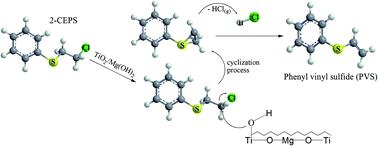
In the case of 2-CEPS degradation, GC-MS analysis show fragmentation pattern with m/z 18, 27, 39, 45, 51, 58, 65, 77, 84, 91, 103, 109, 121 and 135 assigned to phenyl vinyl sulfide (PVS) as the primary degradation product (see Fig. 11). Similarly to 2-CEES degradation, the cyclic sulfonium cation is also the promoter of the reaction. Prasad et al. (2010) studied in detail the degradation of 2-CEPS with metal-based nano-oxides AP–Al2O3, AP–Al2O3–Fe2O3, or AP–Al2O3–V2O5 by using GC-MS and infrared spectroscopy. In this case, the 2-CEPS molecule reacts with Al2O3 and Al2O3–Fe2O3 in two ways: (i) with surface hydroxyl groups (or physisorbed water molecules) to 2-ethyl phenyl sulfide (2-HEPS); (ii) formation of surface-bound alkoxides. On the contrary, on Al2O3–V2O5, 2-CEPS can react: (i) with hydroxyl groups to 2-HEPS; (ii) with V+5 acidic sites forming sulphoxide of 2-CEPS and (iii), with V–OH giving surface alkoxy species.77 Based on the literature and our GC-MS investigation, the possible mechanism of the 2-CEPS interaction with the TiO2/Mg(OH)2 surface was proposed (see Fig. 12). 2-CEPS molecule adsorbs on the Brønsted acid sites. In this step, hydrogen from the surface hydroxyl group attacks the sulphur or chlorine atom of the 2-CEPS molecule and promotes the intermolecular cyclization process forming cyclic sulfonium cation (S+).
Then, the dehydrohalogenation reaction occurs, and the chlorine atom is eliminated (as HCl). At the same time, the lattice oxygen atom (the electron-rich oxygen O2−) attacks the acidic hydrogen affiliated to the carbon atom (neighbour of the sulphur atom in CEPS molecule). Subsequent elimination leads to the formation of degradation product (PVS) via surface bonded alkoxy species.78 The PVS has lower toxicity in comparison with 2-CEPS.79 Similar results were reported in several other studies.80,81 In our case, no other degradation products, such as hydroxyl ethyl phenyl sulphide (HEPS), have been identified in the headspace extract.
Conclusions
In this work, we have introduced TiO2/Mg(OH)2 composites that were used for the rapid degradation of CWA surrogates DMMP, 2-CEES, and 2-CEPS in aqueous solution. Mixing TiO2 and Mg(OH)2 has been found to rapidly increase the specific surface area and degradation activity of the resulting composites. One of the most important catalyst parameters – acid–base properties were correlated with the activity of the samples. The acidity and amount of –OH groups, as well as the specific surface area are decisive factors for the degradation of DMMPs and were strongly affected by Ti![[thin space (1/6-em)]](https://www.rsc.org/images/entities/char_2009.gif) :
:![[thin space (1/6-em)]](https://www.rsc.org/images/entities/char_2009.gif) Mg ratio.
Mg ratio.
Moreover, titanium dioxide in the composites can further promote degradation of CWA surrogates by photocatalysis. Based on the analysis of the degradation products, the mechanism for degradation of the used surrogates was proposed and discussed with the available literature. From these results, we infer that mixed-metal oxides and composites represent a promising way how to rapidly and safely decompose highly toxic compounds by surface chemical reactions.
Conflicts of interest
There are no conflicts to declare.Acknowledgements
Czech Academy of Sciences-Bulgarian Academy of Sciences bilateral project (BAS-20-11) and financial support of Project No. DFNP-17-61/26.07.2017 are acknowledged. The authors acknowledge the assistance provided by the Research Infrastructure NanoEnviCz, supported by the Ministry of Education, Youth and Sports of the Czech Republic under Project No. LM2018124. Authors thank to Dr Darina Smržová and Michaela Šrámová-Slušná for nitrogen physisorption measurements.References
- K. Kuča, M. Pohanka, in Molecular, Clinical and Environmental Toxicology: Volume 2: Clinical Toxicology, ed. A. Luch, Birkhäuser Basel, Basel, 2010, pp. 543–558 Search PubMed.
- K. Ganesan, S. K. Raza and R. Vijayaraghavan, J. Pharm. BioAllied Sci., 2010, 2, 166–178 CrossRef CAS PubMed.
- G. W. Wagner, Ind. Eng. Chem. Res., 2011, 50, 12285–12287 CrossRef CAS.
- B. C. Singer, A. T. Hodgson, H. Destaillats, T. Hotchi, K. L. Revzan and R. G. Sextro, Environ. Sci. Technol., 2005, 39, 3203–3214 CrossRef CAS PubMed.
- A. K. Verma, A. K. Srivastava, B. Singh, D. Shah, S. Shrivastava and C. K. P. Shinde, Chemosphere, 2013, 90, 2254–2260 CrossRef CAS PubMed.
- T. H. Mahato, G. K. Prasad, B. Singh, K. Batra and K. Ganesan, Microporous Mesoporous Mater., 2010, 132, 15–21 CrossRef CAS.
- V. Štengl, M. Maříková, S. Bakardjieva, J. Šubrt, F. Opluštil and M. Olšanská, J. Chem. Technol. Biotechnol., 2005, 80, 754–758 CrossRef.
- V. Štengl, J. Bludská, F. Opluštil and T. Němec, Mater. Res. Bull., 2011, 46, 2050–2056 CrossRef.
- V. Šteng, M. Maříková, S. Bakardjieva, J. Šubrt, F. Opluštil and M. Olšanská, J. Chem. Technol. Biotechnol., 2005, 80, 754–758 CrossRef.
- G. W. Wagner, O. B. Koper, E. Lucas, S. Decker and K. J. Klabunde, J. Phys. Chem. B, 2000, 104, 5118–5123 CrossRef CAS.
- B. Nazari and M. Jaafari, Dig. J. Nanomater. Bios., 2010, 5, 909–917 Search PubMed.
- V. Štengl, V. Houšková, S. Bakardjieva, N. Murafa, M. Maříková, F. Opluštil and T. Němec, Mater. Charact., 2010, 61, 1080–1088 CrossRef.
- M. Šťastný, V. Štengl, J. Henych, J. Tolasz, P. Vomáčka and J. Ederer, J. Mater. Sci., 2016, 51, 2634–2642 CrossRef.
- P. Janoš, T. Hladík, M. Kormunda, J. Ederer and M. Šťastný, Adv. Mater. Sci. Eng., 2014, 2014, 1–24 CrossRef.
- P. Janos, P. Kuran, M. Kormunda, V. Stengl, T. M. Grygar, M. Dosek, M. Stastny, J. Ederer, V. Pilarova and L. Vrtoch, J. Rare Earths, 2014, 32, 360–370 CrossRef CAS.
- N. Sharma and R. Kakkar, J. Comput. Sci., 2015, 10, 225–236 CrossRef.
- G. W. Wagner, P. W. Bartram, O. Koper and K. J. Klabunde, J. Phys. Chem. B Search PubMed.
- L. Bigiani, D. Zappa, D. Barreca, A. Gasparotto, C. Sada, G. Tabacchi, E. Fois, E. Comini and C. MacCato, ACS Appl. Mater. Interfaces, 2019, 11(26), 23692–23700 CrossRef CAS PubMed.
- J. R. Soliz, W. O. Gordon, A. Balboa, J. Mahle, A. J. Hauser, K. M. Bussmann, M. S. Osofsky and C. J. Karwacki, in Abstracts of Papers, 250th ACS National Meeting & Exposition, Boston, MA, United States, August 16-20, 2015 Search PubMed.
- G. K. Prasad, P. V. R. K. Ramacharyulu, J. Praveen Kumar, K. Ganesan and B. Singh, J. Sci. Ind. Res., 2012, 71, 205–209 CAS.
- N. Sharma and R. Kakkar, Adv. Mater., 2013, 4, 508–521 Search PubMed.
- K. J. Ewing and B. Lerner, Appl. Spectrosc., 2001, 55, 407–411 CrossRef CAS.
- B. Maddah and H. Chalabi, Int. J. Nanosci. Nanotechnol., 2012, 8, 157–164 Search PubMed.
- R. M. Narske, K. J. Klabunde and S. S. Fultz, Abstr. Pap. 221st ACS Natl. Meet, San Diego, CA, United States, April 1-5, 2001, IEC-318 Search PubMed.
- V. Štengl, S. Bakardjieva, M. Maříková, P. Bezdička and J. Šubrt, Mater. Lett., 2003, 57, 3998–4003 CrossRef.
- V. Štengl, T. M. Grygar, F. Opluštil and T. Němec, J. Hazard. Mater., 2011, 192, 1491–1504 CrossRef PubMed.
- J. Henych, P. Janoš, M. Kormunda, J. Tolasz and V. Štengl, Arabian J. Chem., 2016, 11, 4258–4269 Search PubMed.
- G. D. Bukatov, D. K. Maslov, S. A. Sergeev and M. A. Matsko, Appl. Catal., A, 2019, 577, 69–75 CrossRef CAS.
- Y. Liu, J. Zou, X. Zeng and W. Ding, RSC Adv., 2014, 4, 42764–42771 RSC.
- H. Jeon, Y. J. Min, S. H. Ahn, S.-M. Hong, J.-S. Shin, J. H. Kim and K. B. Lee, Colloids Surf., A, 2012, 414, 75–81 CrossRef CAS.
- C. H. Ashok, V. K. Rao and C. H. Shilpa Chakra, J. Nanomed. Nanotechnol., 2015, 06, 2–6 Search PubMed.
- P.-Y. Wu, Y.-P. Jiang, Q.-Y. Zhang, Y. Jia, D.-Y. Peng and W. Xu, New J. Chem., 2016, 40, 2878–2885 RSC.
- M. Hua, S. Zhang, B. Pan, W. Zhang, L. Lv and Q. Zhang, J. Hazard. Mater., 2012, 211–212, 317–331 CrossRef CAS PubMed.
- A. Dhanya and K. Aparna, in Recent Advances in Chemical Engineering: Select Proceedings of ICACE 2015, ed. I. Regupathi, V. K. Shetty and M. Thanabalan, Springer Singapore, Singapore, 2016, pp. 219–225 Search PubMed.
- J. Bandara, S. S. Kuruppu and U. W. Pradeep, Colloids Surf., A, 2006, 276, 197–202 CrossRef CAS.
- H. S. Jung, J.-K. Lee, M. Nastasi, S.-W. Lee, J.-Y. Kim, J.-S. Park, K. S. Hong and H. Shin, Langmuir, 2005, 21, 10332–10335 CrossRef CAS PubMed.
- C. S. Chou, R. Y. Yang, C. K. Yeh and Y. J. Lin, Powder Technol., 2009, 194, 95–105 CrossRef CAS.
- a. L. Patterson, Phys. Rev., 1939, 56, 978–982 CrossRef CAS.
- M. Naderi, in Progress in Filtration and Separation, 2014, pp. 585–608 Search PubMed.
- J. Henych, P. Janoš, M. Kormunda, J. Tolasz and V. Štengl, Arabian J. Chem., 2016, 11, 4258–4269 Search PubMed.
- M. Šťastný, J. Tolasz, V. Štengl, J. Henych and D. Žižka, Appl. Surf. Sci., 2017, 412, 19–28 CrossRef.
- S. Ardizzone, C. L. Bianchi, M. Fadoni and B. Vercelli, Appl. Surf. Sci., 1997, 119, 253–259 CrossRef CAS.
- D. E. Haycock, M. Kasrai, C. J. Nicholls and D. S. Urch, J. Chem. Soc., Dalton Trans., 1978, 1791–1796 RSC.
- M. Giannini, T. B. Ballaran and F. Langenhorst, Am. Mineral., 2014, 99, 2060–2067 CrossRef.
- S. Feliu Jr, J. C. Galván, A. Pardo, M. C. Merino and R. Arrabal, Open Corros. J., 2010, 3, 80–91 CrossRef.
- J. Henych, V. Stengl, A. Mattsson and L. Osterlund, Photochem. Photobiol., 2015, 91, 48–58 CrossRef CAS PubMed.
- M. Šťastný, J. Tolasz, V. Štengl, J. Henych and D. Žižka, Appl. Surf. Sci., 2017, 412, 19–28 CrossRef.
- L. Forni, Catal. Rev., 1974, 8, 65–115 CrossRef.
- T. Preočanin and N. Kallay, Croat. Chem. Acta Search PubMed.
- C. Contescu, J. Jagiełło and J. A. Schwarz, Langmuir, 1993, 9, 1754–1765 CrossRef CAS.
- M. N. Khan and A. Sarwar, Surf. Rev. Lett., 2007, 14, 461–469 CrossRef.
- S. Yang, D. Shao, X. Wang and M. Nagatsu, RSC Adv., 2014, 4, 4856–4863 RSC.
- H. Kawakami and S. Yoshida, J. Chem. Soc., Faraday Trans. 2, 1984, 80, 921–932 RSC.
- J. P. Reymond and F. Kolenda, in Powder Technology, 1999 Search PubMed.
- K. Bourikas, C. Kordulis and A. Lycourghiotis, Environ. Sci. Technol., 2005, 39, 4100–4108 CrossRef CAS PubMed.
- K. E. O’Shea, I. Garcia and M. Aguilar, Res. Chem. Intermed., 1997, 23, 325–339 CrossRef.
- J. Bandara, C. C. Hadapangoda and W. G. Jayasekera, Appl. Catal., B, 2004, 50, 83–88 CrossRef CAS.
- A. Penkova, L. F. Bobadilla, F. Romero-Sarria, M. A. Centeno and J. A. Odriozola, Appl. Surf. Sci., 2014, 317, 241–251 CrossRef CAS.
- E. Selli and L. Forni, Microporous Mesoporous Mater., 1999, 31, 129–140 CrossRef CAS.
- C. N. Rusu and J. T. Yates, J. Phys. Chem. B, 2000, 104, 12292–12298 CrossRef CAS.
- G. E. Fryxell and G. Cao, Environmental applications of nanomaterials: Synthesis, sorbents and sensors, 2nd edn, 2012 Search PubMed.
- M. B. Mitchell, V. N. Sheinker, W. W. Cox, E. N. Gatimu and A. B. Tesfamichael, J. Phys. Chem. B, 2004, 108, 1634–1645 CrossRef CAS.
- K. Knagge, M. Johnson, V. H. Grassian and S. C. Larsen, Langmuir, 2006, 22, 11077–11084 CrossRef CAS PubMed.
- S. R. Segal, L. Cao, S. L. Suib, X. Tang and S. Satyapal, J. Catal., 2001, 198, 66–76 CrossRef CAS.
- A. R. Head, R. Tsyshevsky, L. Trotochaud, Y. Yu, L. Kyhl, O. Karslloǧlu, M. M. Kuklja and H. Bluhm, J. Phys. Chem. C, 2016, 120, 29077–29088 CrossRef CAS.
- W. C. Hung, J. C. Wang and K. H. Wu, Appl. Surf. Sci., 2018, 444, 330–335 CrossRef CAS.
- M. E. Martin, R. M. Narske and K. J. Klabunde, Microporous Mesoporous Mater., 2005, 83, 47–50 CrossRef CAS.
- S. C. Stout, S. C. Larsen and V. H. Grassian, Microporous Mesoporous Mater., 2007, 100, 77–86 CrossRef CAS.
- I. N. Martyanov and K. J. Klabunde, Environ. Sci. Technol., 2003, 37, 3448–3453 CrossRef PubMed.
- G. W. Wagner and P. W. Bartram, Langmuir, 1999, 15, 8113–8118 CrossRef CAS.
- M. Verma, R. Chandra and V. K. Gupta, J. Environ. Chem. Eng., 2016, 4, 219–229 CrossRef CAS.
- M. Verma, R. Chandra and V. K. Gupta, J. Colloid Interface Sci., 2015, 453, 60–68 CrossRef CAS PubMed.
- S.-T. Han, H.-L. Xi, X.-Z. Fu, X.-X. Wang, Z.-X. Ding, Z.-C. Lin and W.-Y. Su, Wuli Huaxue Xuebao, 2004, 20, 296–301 CAS.
- B. W. L. Jang and J. J. Spivey, Catal. Today, 2000, 55, 3–10 CrossRef CAS.
- J. K. Mitchell, J. A. Arcibar-Orozco and T. J. Bandosz, Appl. Surf. Sci., 2016, 390, 735–743 CrossRef CAS.
- D. A. Giannakoudakis, M. Florent, R. Wallace, J. Secor, C. Karwacki and T. J. Bandosz, Appl. Catal., B, 2018, 226, 429–440 CrossRef CAS.
- G. K. Prasad, J. Sci. Ind. Res., 2010, 69, 835–840 CAS.
- G. W. Wagner and Y.-C. Yang, Ind. Eng. Chem. Res., 2002, 41, 1925–1928 CrossRef CAS.
- M. J. Climent, A. Corma, S. Iborra and A. Velty, J. Mol. Catal. A: Chem., 2002, 182–183, 327–342 CrossRef CAS.
- M. Sadeghi, S. Yekta and H. Ghaedi, Int. Nano Lett., 2016, 6, 161–171 CrossRef.
- A. Kiani and K. Dastafkan, J. Colloid Interface Sci., 2016, 478, 271–279 CrossRef CAS PubMed.
Footnote |
| † Electronic supplementary information (ESI) available: Detailed material characterization along with supplementary figures, XRD patterns, adsorption isotherms, XPS spectra, TEM and HRTEM micrographs, GC chromatograms and the appropriate m/z spectra of CWA surrogates, and kinetic curves and kinetic parameters for the degradation of other CWA surrogates in an aqueous solution. See DOI: 10.1039/d0ra00944j |
| This journal is © The Royal Society of Chemistry 2020 |

