 Open Access Article
Influence of molecular weight and concentration of carboxymethyl chitosan on biomimetic mineralization of collagen†
Ruoxun Wang‡
 ab,
Jiaxin Guo‡ab,
Xiaoxuan Linab,
Sipeng Chenab and
Sui Mai*ab
aDepartment of Operative Dentistry and Endodontics, Guanghua Hospital of Stomatology, School of Stomatology, Sun Yat-sen University, Guangzhou, China. E-mail: maisui@mail.sysu.edu.cn
bGuangdong Provincial Key Laboratory of Stomatology, Guangzhou, China
First published on 31st March 2020
Abstract
The objective of the present study was to systematically investigate the influence of molecular weight (MW) and concentration of carboxymethyl chitosan (CMC), which served as non-collagenous protein (NCP) surrogates, on biomimetic mineralization of type I collagen. Supersaturated CMC-stabilized amorphous calcium-phosphate (CMC-ACP) dispersions containing different MWs (20 kDa, 60 kDa, 150 kDa) and concentrations (25, 50, 100, 200, 400 μg ml−1) of CMC were prepared. After mineralization in the aforementioned dispersions for 7 days, the pattern and extent of biomimetic mineralization of collagen scaffolds were investigated. Our study showed that increasing CMC concentration resulted in increasing stability and decreasing particle size of CMC-ACP dispersions. Images from scanning and transmission electron microscopy revealed that intrafibrillar mineralization of collagen was obtained with 20k-200, 60k-100, 60k-200 and 150k-200 CMC-ACP dispersions, with hydroxyapatite (HAp) formation confirmed by Fourier transform infrared spectroscopy and X-ray diffraction measurements, whereas HAp formed extrafibrillar clusters in other collagen scaffolds. Thermogravimetric analysis showed that the combined effect of MW and concentration of CMC contributed to different extents of biomimetic mineralization, and was correlated with the stability and particle size of CMC-ACP dispersions, and the size-exclusion characteristics of type I collagen. The results of this work support the effective function of CMC as NCP analogs, and provide parameters of MWs and concentrations of CMC for applications in hard tissue engineering as well as insights into intersections of mechanisms in biomimetic mineralization.
1 Introduction
Bone is a hierarchically structured organic–inorganic hybrid composite,1,2 consisting of needle-like hydroxyapatite (HAp) nanocrystals with their c-axes preferentially aligned with the long axis of collagen fibrils at the nanoscale.3,4 The highly-ordered hierarchical nanostructure of intrafibrillar mineralization endows natural bone with superior biomechanical properties,5 and therefore understanding the mechanism of HAp nucleation and growth inside the collagen has become the core of unravelling bone formation6 and fabricating new bone graft substitutes.Biomimetic mineralization provides novel strategies for reconstructing the orderly arrangement of HAp and collagen fibrils similar to that in natural bone. The general idea of biomimetic mineralization is to utilize polymer additives, like anionic and cationic polyelectrolytes, to simulate the role of non-collagenous proteins (NCPs) in biomineralization process.7–13 The commonly used polymer additives are polyacrylic acid (PAA),14,15 polyaspartic acid (pAsp)7–12 and poly(allylamine) hydrochloride (PAH).16,17 NCPs play a crucial role in inducing intrafibrillar formation of HAp crystals, probably by sequestering calcium ions and decelerating the transition of calcium phosphate into HAp via forming amorphous calcium phosphate (ACP) liquid precursors, which can infiltrate into collagen fibrils and gradually transform into HAp.18 Therefore, hierarchical intrafibrillar mineralization could be achieved. If mineralized ions or simulated body fluids are used as mineralization media without any NCPs or their analogs, collagen fibrils cannot initiate and mediate biomimetic hierarchical mineralization.19 The intrafibrillar mineralization of collagen is believed to be modulated by interactions between ACP with NCPs and collagen fibrils.20
Recently, the introduction of carboxymethyl chitosan (CMC) as novel analogs of NCPs into biomimetic mineralization has drawn researchers' attention.21–23 As an amphoteric polyelectrolyte derived from chitosan, CMC contains abundant carboxyl and amino groups; when the environmental pH deviates from its isoelectric point, CMC can transform into a cationic/anionic polyelectrolyte through protonation/deprotonation reactions.24,25 It can sequester calcium ions and inhibit the transformation of ACP into HAp crystals, with which it can surrogate NCPs function as selective inhibitors or promoters of biomimetic mineralization.26 Furthermore, CMC boasts satisfactory biocompatibility, antibacterial activity and economic applicability. Our previous study also investigated the role of CMC in biomimetic remineralization of artificial caries-affected dentin.27 We noticed that there were discrepancies in the literature about the mechanism, pattern and extent of CMC-induced biomimetic mineralization. These discordances might be attributed to differences in the relevant variables of CMC, like the molecular weight (MW) and concentration, which might affect the [–COO−]/[Ca2+] ratio in solution and the size and stability of ACP particles,6 and eventually the outcome of biomimetic mineralization.
In the present study, the influence of MW and concentration of CMC on the pattern and extent of biomimetic mineralization of type I collagen was explored, with the aim of studying the mechanism of CMC-induced biomimetic mineralization and providing parameters for constructing scaffolds for bone and dentin tissue engineering. The null hypothesis was that different MWs and concentrations of CMC cannot affect the particle size and stability of ACP dispersions, and thus cannot influence the pattern and extent of biomimetic mineralization of type I collagen.
2 Materials and methods
2.1 Calcium-binding test of CMC
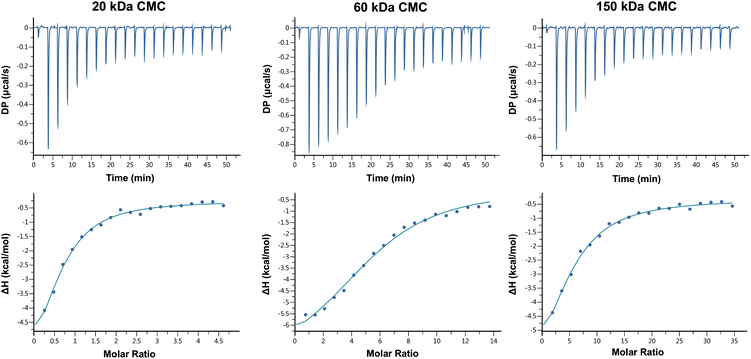
Isothermal titration calorimetry (ITC) was used to analyse the thermodynamics of Ca2+ binding to CMC of three different MWs (RuibioC3105, MW 20 kDa, Germany; RuibioC3108, MW 60 kDa, Germany; RuibioC3125, MW 150 kDa, Germany). Before titration, each group of CMC samples was dialyzed overnight against Tris-buffered saline (TBS) at pH 7.4 (50 mM Tris, 50 mM HCl and the appropriate amount of NaCl), and the ionic strengths were controlled by equilibrium dialysis and adjustment of NaCl. For each group, the Ca2+ and CMC solutions were prepared in the same dialysis buffer respectively, to minimize the effect of interaction between solvent and ligand. The ITC measurement was performed in the Micro CalPEAQ-ITC Control Software (Malvern MicroCal, Malvern, UK) and carried out at 25 °C while stirring at 750 rpm. The reference cell was filled with water. 900 μM Ca2+ was titrated into CMC solutions (40 μM/20 kDa, 13.3 μM/60 kDa and 5.33 μM/150 kDa) via 20 individual injections (2.0 μl for each) at the interval of 150 s respectively. Blank experiment was measured by titrating Ca2+ into the same buffer under the same conditions, to correct for the heat of titrant dilution. The Micro CalPEAQ-ITC Analysis Software (Malvern MicroCal, Malvern, UK) was used to derive the association binding constant (Ka), enthalpy change (ΔH), Gibbs free energy change (ΔG), entropy change (ΔS) and stoichiometry of binding (N).2.2 Characterization of CMC-ACP dispersions
Subsequent OD measurements were conducted every 2 hours on each CMC-ACP dispersion to get a detailed precipitation curve and to calculate the precipitation half-time t1/2. Curves of OD as a function of time (t) were fitted to a logistic function:
| OD(t) = A/(1 + e−B(t − t1/2)) | (1) |
2.3 Fabrication and mineralization of collagen
The method for preparing type I collagen used in this experiment was modified according to that of Price.33 Rat tail tendons from Sprague Dawley (SD) rats were dissolved in acetic acid (0.3 M) for 3 days. Then the collagen solution was centrifuged in a refrigerated centrifuge (4 °C, 3000 rpm, 30 minutes). The supernatant was placed in dialysis bags to dialyze for 5–7 days in dipotassium phosphate solution (0.02 M). Then the collagen hydrogel collected from the dialysis bags was rinsed with deionized water and lyophilized. Mineralization was conducted by incubating collagen scaffolds in the aforementioned CMC-ACP dispersions at 37 °C, which were refreshed every 2 days. After 7 days, collagen scaffolds were rinsed with deionized water and lyophilized for characterization.2.4 Characterization of mineralized collagen scaffolds
TEM was performed to investigate the intra- and extrafibrillar mineralization of different scaffolds. Mineralized collagen scaffolds were crushed to fine-grained powders in liquid nitrogen, dispersed in ethanol and dropped on nickel grids; half of them were contrasted for 1 min with 1% uranyl acetate (SPI-Chem™, Structure Probe, West Chester, PA, USA). All the samples were analysed using a TEM (TEM1400; JEOL, Japan) with an accelerating voltage of 120 kV in bright-field and SAED modes.
2.4.3 X-ray diffractometry (XRD) analysis
The crystal structure of mineralized scaffolds was characterized using an X-ray powder diffractometer (Empyrean, PANalytical B.V., Almelo, Netherlands). The samples were scanned with Cu Kα X-ray radiation at 40 kV and 35 mA over the 2θ range of 15°–45°. The results were analysed using JADE8 software (JADE, Materials Data Inc., Livermore, CA, USA).3 Results
3.1 Characterization of CMC
The FT-IR and 1H-nuclear magnetic resonance (NMR) spectra of CMC of three different MWs were depicted in Fig. S1 and S2† respectively. The results indicated carboxymethylation on both amino and hydroxyl groups of chitosan, with degrees of substitution (DS) of N,N-dicarboxymethyl groups of CMC of three different MWs close to 100%, and DS of O-carboxymethyl groups approximately 62%, 40% and 52% respectively, which suggested the similar capable calcium-binding sites of CMC of three MWs and reduced the influence of different functional groups on further experiments of biomimetic mineralization of collagen.Titration of calcium ions with the three CMC solutions identified endothermic reactions, which were indicated by downward peaks in the top graphs of Fig. 1. The initial injections produced large heats, because almost all the injected Ca2+ binds to the target CMC molecules. The heat of each injection returned rapidly to the baseline, indicating that the Ca2+ and CMC reacted rapidly. As titration continued, binding sites became occupied and the heat magnitude per injection decreased, until eventually almost all the binding sites were occupied and the heat was mainly derived from the dilution. The affinity for Ca2+ of three MWs of CMC, which was indicated by Ka, was all in the moderate range of 104 M−1, and the stoichiometry of binding (N) was about 0.61 ± 0.07, 5.57 ± 0.20 and 5.03 ± 0.62 mol of Ca2+ per mole of CMC respectively (Table 1). The negative binding energy (ΔG) for the titrations of the three CMC with Ca2+ was very similar (around −6 kJ mol−1), which was composed of enthalpic (ΔH) and entropic (ΔS) changes. CMC–Ca2+ complex formation was a majorly enthalpy-driven reaction, as the ΔH had a larger contribution to the ΔG than the TΔS. The negative ΔH contribution to binding is primarily caused by the strength of the interactions of Ca2+ with the target CMC; The ΔS contribution to binding is primarily caused by conformational changes and hydrophobic interactions.34 The ΔH and ΔS values of the 3 CMC were similar as well, despite subtle differences in ΔS (20 kDa > 60 kDa > 150 kDa), which indicated 150 kDa CMC might lose the most conformational freedom upon Ca2+ binding despite entropic gain from water released upon binding, but the relation between ΔS and conformational changes was yet to be confirmed by further studies.
| CMC MW, kDa | Ka, M−1 | ΔH, kcal mol−1 | ΔG, kcal mol−1 | ΔS, cal mol−1 K−1 | Stoichiometry, N |
|---|---|---|---|---|---|
| 20 | 5.85 × 10⁴ | −7.45 ± 1.33 | −6.51 | −3.16 | 0.61 ± 0.07 |
| 60 | 4.35 × 10⁴ | −7.87 ± 0.42 | −6.33 | −5.17 | 5.57 ± 0.20 |
| 150 | 4.67 × 10⁴ | −8.13 ± 1.60 | −6.37 | −5.90 | 5.03 ± 0.62 |
3.2 Characterization of CMC-ACP dispersions
 | ||
| Fig. 2 OD profiles of CMC-ACP dispersions with 20 kDa, 60 kDa and 150 kDa CMC and different CMC concentrations. | ||
| CMC MW kDa | CMC concentration | ||||
|---|---|---|---|---|---|
| 25 μg ml−1 | 50 μg ml−1 | 100 μg ml−1 | 200 μg ml−1 | 400 μg ml−1 | |
| 20 | 18.0 | 62.9 | >168.0 | >168.0 | >168.0 |
| 60 | 13.2 | 39.6 | >168.0 | >168.0 | >168.0 |
| 150 | 11.4 | 34.1 | 46.6 | >168.0 | >168.0 |
3.3 Effect of MW and concentration of CMC on mineralization of collagen
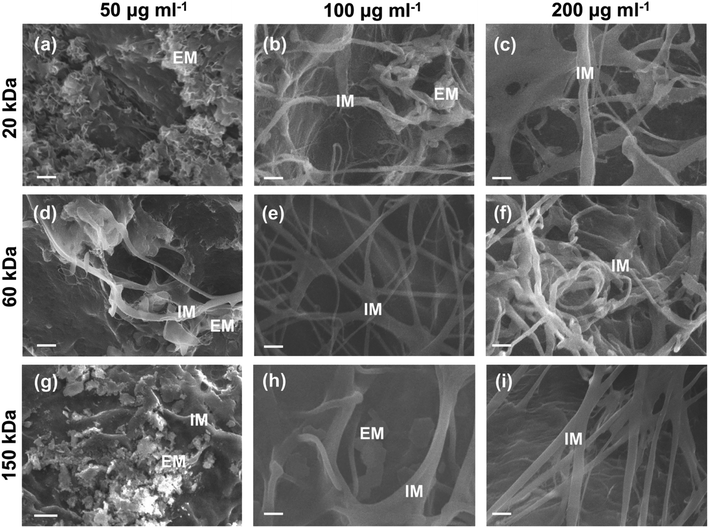
The surface micromorphology of type I collagen scaffolds mineralized for 7 days was characterized by SEM (Fig. 4).Apparent extrafibrillar mineralization was obtained with dispersions containing 20 kDa CMC at low concentration (50 μg ml−1) (20k-50; Fig. 4a), with platelet-like nanocrystals randomly distributing on surface of collagen fibrils. Intrafibrillar mineralization was achieved with dispersions containing high concentrations of CMC (200 μg ml−1) as well as dispersions containing medium MW (60 kDa) CMC at medium (100 μg ml−1) concentrations (20k-200, 60k-100, 60k-200 and 150k-200; Fig. 4c, e, f and i), with uniform diameters and surfaces without apparent banding pattern or extrafibrillar minerals. Intra- and extrafibrillar mineralization were found in other samples mineralized with dispersions containing 20 kDa CMC at medium concentration (100 μg ml−1) and higher MW CMC at low or medium concentration (20k-100, 60k-50, 150k-50 and 150k-100; Fig. 4b, d, g and h), with a combination of both nanocrystals deposited on the surface of fibrils and uniform fibril surface without apparent banding pattern.
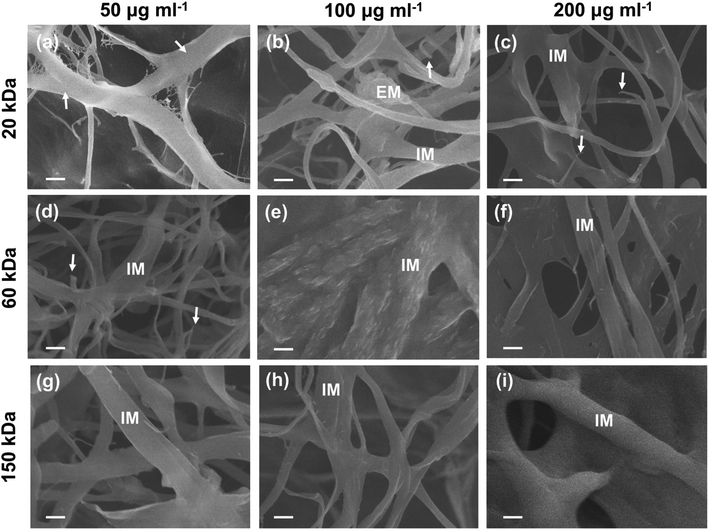
As for the SEM images of the inner-section of type I collagen scaffolds mineralized for 7 days, no obvious signs of extrafibrillar mineralization were found (Fig. 5). In the current cross section, low-MW (20 kDa) CMC at low concentration (50 μg ml−1) (20k-50) inhibited both extrafibrillar and intrafibrillar mineralization of collagen fibrils (Fig. 5a), showing typical banding pattern of native collagen. Different extent of intrafibrillar mineralization was achieved with dispersions containing other combinations of MWs and concentrations (Fig. 5b–i), with uniform surfaces without apparent banding pattern or obvious extrafibrillar crystals, except for the 20k-100 sample (Fig. 5b) showing a cluster of extrafibrillar aggregate. In collagen scaffolds mineralized with 20k-100, 20k-200 and 60k-50 dispersions (Fig. 5b–d), broken ends of collagen fibrils were observed, which could be attributed to the impact of high-power electron beam and the lack of homogenous intrafibrillar mineralization leading to unsatisfactory mechanical strength of collagen fibrils. Comparatively, uniform diameters and surfaces were achieved with dispersions containing high-MW (150 kDa) CMC as well as dispersions containing medium MW (60 kDa) CMC at medium (100 μg ml−1) and high (200 μg ml−1) concentrations (60k-100, 60k-200, 150k-50, 150k-100, 150k-200; Fig. 5e–i). Moreover, some collagen fibrils showed merged platy-fibrous (60k-200; Fig. 5f), rough (60k-100; Fig. 5e) or bulgy (150k-200, Fig. 5i) texture, suggesting the mineralization solutions might cause further assembly of multiple collagen fibrils,11 and a higher degree of intrafibrillar mineralization. It was worth noting that there were different imaging manifestations between the surface and inner-section of the collagen scaffolds, which might be attributed to the extrafibrillar nanocrystals deposited on the surface of some scaffolds, which hindered the sufficient infiltration of CMC-ACP nanoparticles to deeper areas of the scaffold.
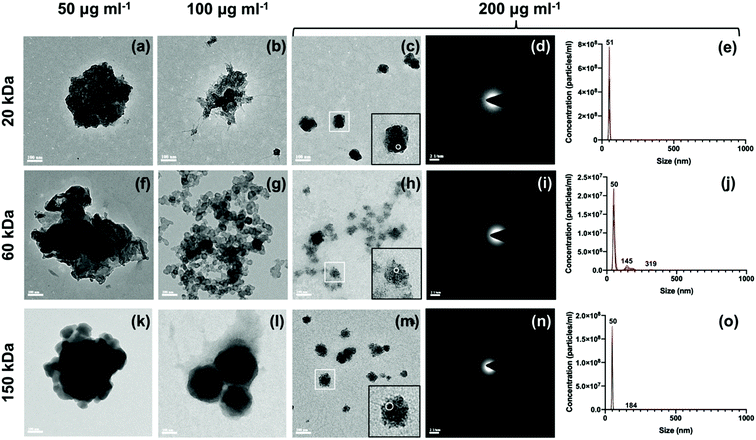
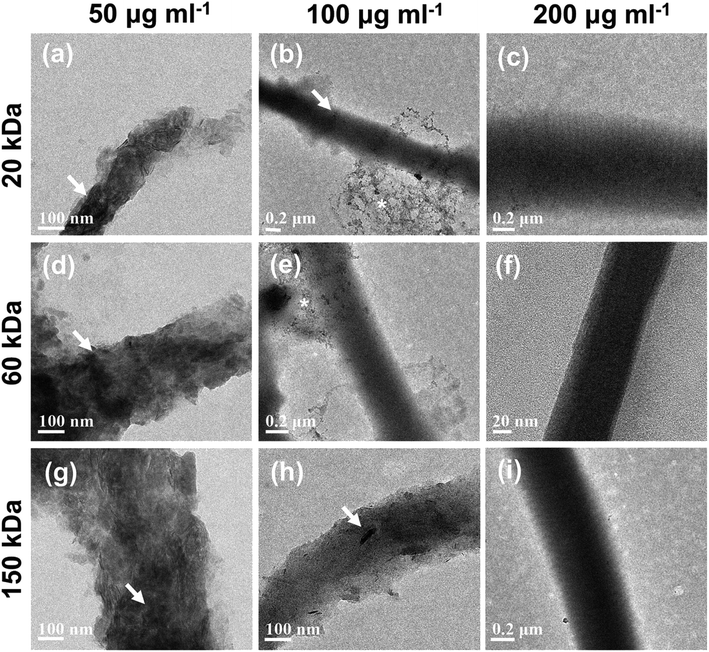
Unstained TEM images showed different micromorphology of type I collagen scaffolds mineralized with different dispersions (Fig. 6). Unevenly mineralized collagen fibrils with deposits of high electron density were found in samples mineralized with dispersions containing low (50 μg ml−1 of 20 kDa, 60 kDa and 150 kDa) and some medium (100 μg ml−1 of 20 kDa and 150 kDa) concentrations of CMC (Fig. 6a, b, d, g and h). Uniform intrafibrillar mineralization of collagen fibrils with even and increasing electron density was obtained with dispersions containing high (200 μg ml−1 of 20 kDa, 60 kDa and 150 kDa) and some medium (100 μg ml−1 of 60 kDa) concentration of CMC (Fig. 6c, e, f and i). In Fig. 6b and e, aggregates of ACP nanoparticles with diameter smaller than 50 nm were found around the collagen fibrils, in line with TEM images of CMC-ACP dispersions of 20k-100 and 60k-100 (Fig. 3b and g).
3.4 Characterization of minerals
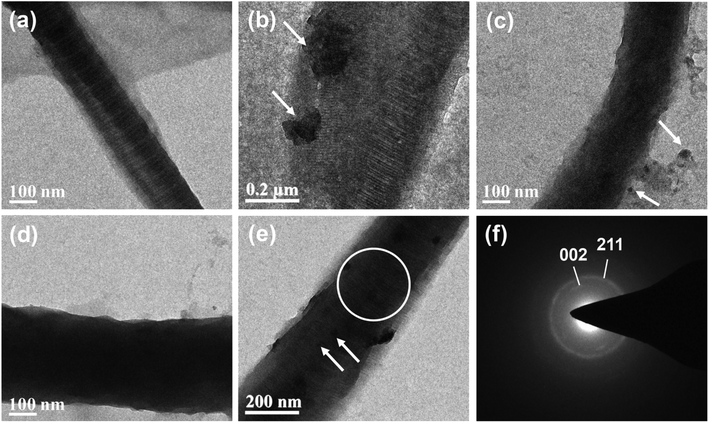
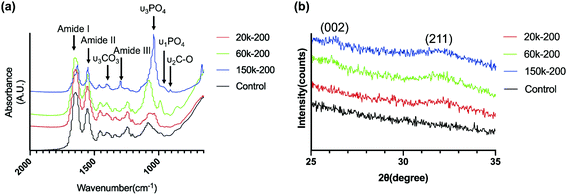
Stained TEM images of collagen fibrils with/without mineralization were compared, as shown in Fig. 7. Self-assembled type I collagen fibrils without mineralization showed clear stripes with apparent banding pattern (Fig. 7a). Under mineralization of conventional supersaturated calcium-phosphate dispersion (Fig. 7b), minerals were deposited on the surface of collagen fibrils and the electron density of collagen fibrils was not obviously changed. Collagen fibril mineralized with 60k-50 (Fig. 7c) CMC-ACP dispersion showed an uneven appearance with increased electron density, indicating intra- and extrafibrillar mineralization. As for collagen fibrils mineralized with 60k-200 (Fig. 7d) and 150k-200 (Fig. 7e) CMC-ACP dispersions, these biomimetic mineralized collagen fibrils showed obscure collagen banding pattern, increased electron density and typical deposition of needle-like HAp crystals arranged along the long axis within collagen fibrils, which indicated intrafibrillar mineral deposition. SAED conducted to determine the phase of crystals in the circle region of Fig. 7e showed a typical [002]/[211] diffraction ring of HAp (Fig. 7f).FT-IR spectra of mineralized collagen scaffolds after 7 days in selected CMC-ACP dispersions showed characteristic absorbance peaks for carbonated apatite (Fig. 8a). Peaks at 960 and 1020 cm−1 were identified as the stretching modes of υ1PO4 and υ3PO4. Peaks at 873 cm−1 were assigned to the υ2C–O stretching mode of carbonate substitution in the apatite lattice. The υ3CO3 peak at 1398 cm−1 was also indicative of the presence of carbonated apatite. Weaker peaks assigned to the minerals were detected in collagen mineralized with the 20k-200 dispersion and the control pure collagen scaffold. Moreover, the apatite υ3PO4/collagen amide I ratio of collagen scaffold mineralized with 150k-200 dispersion was obviously higher than that of other selected samples, indicating a higher extent of mineralization with 150k-200 CMC-ACP dispersion.
XRD spectra of collagen scaffolds mineralized with the dispersions containing 200 μg ml−1 CMC of different MWs for 7 days showed peaks of HAp from the (002) and (211) planes (Fig. 8b), which were similarly found in XRD spectra for native trabecular bone.
3.5 Quantification of minerals
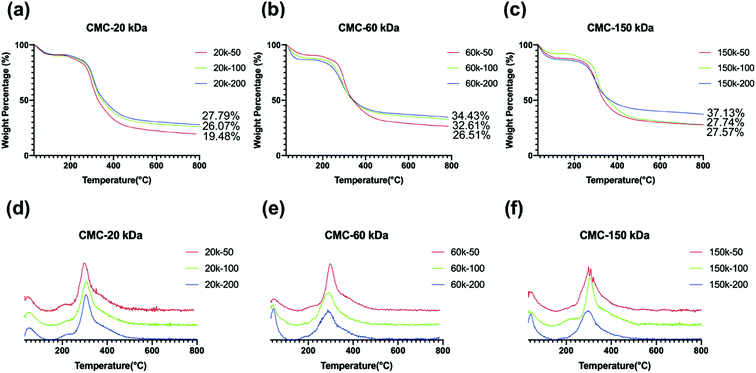
Mineral contents ranged between 19.48–37.13 wt% for mineralized collagen scaffolds (Fig. 9a–c). Collagen scaffold with significant extrafibrillar mineralization on the surface and inhibited mineralization in the inner-section, which was obtained with dispersions containing 20k-50 CMC (Fig. 9a), showed mineral contents in the lowest range. This could be attributed to the fact that early extrafibrillar nanocrystal deposition hindered further CMC-ACP infiltration into the collagen fibrils and deeper areas of the scaffold. Lower mineral contents were also found in samples mineralized with 20k-100, 60k-50, 150k-50 and 150k-100 dispersions, which were probably due to the extrafibrillar mineral deposits as well.DTG curves of the selected samples (Fig. 9d–f) showed two characteristic weight loss peaks, which correspond to the loss of physisorbed water (under 100 °C) followed by decomposition (260–360 °C) of the organic collagen matrix. The high-temperature peak of pure collagen scaffold (450–600 °C), which correspond to the combustion of the organic collagen matrix as previous reported,20 disappeared in these mineralized specimens, indicating the mineralization of collagen scaffolds altered their thermal behaviour.
4 Discussion
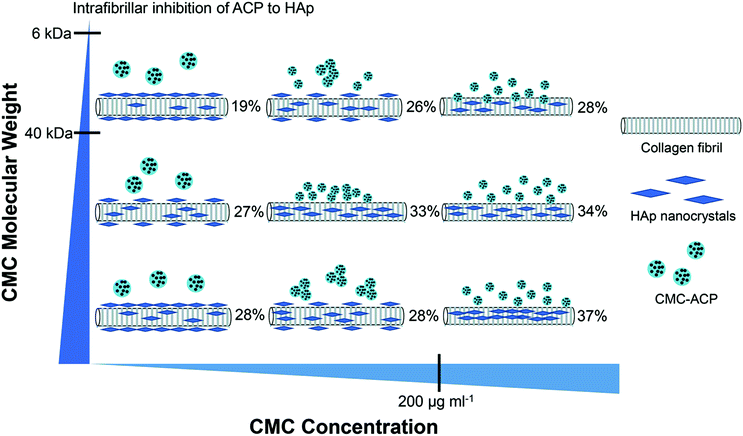
The objective of this study was to investigate the influence of MW and concentration of CMC on the pattern and extent of collagen fibril mineralization. The main results and relationships found in our study between the MW and concentration of CMC, CMC-ACP nanoparticles, and the pattern and extent of collagen fibril mineralization were schematically summarized in Fig. 10. Increasing CMC concentration resulted in CMC-ACP dispersions with increasing stability and decreasing particle size. The least stable dispersion was achieved with high MW CMC at low concentration. With this unstable dispersion, sufficient amount of extrafibrillar minerals was observed on the surface of scaffolds. Conversely, the most stable dispersions were achieved with high concentrations of CMC, and they induced full and uniform intrafibrillar mineralization across the sample with different mineral contents. Besides, the size-exclusion characteristics of type I collagen might influence the outcome of mineralization as well. According to Toroian,38 molecules larger than 40 kDa are excluded from the fibril, but they can favour intrafibrillar mineralization by forming small apatite crystal nuclei that diffuse into the fibril and inhibiting apatite growth everywhere but within the fibril; conversely, molecules smaller than 6 kDa can diffuse into all water within the fibril and directly inhibit mineralization within the fibril. Our previous study also confirmed the size-exclusion of collagen, by providing evidence of the rejection of CMC (MW 150 kDa) by collagen fibrils.27 In this study, we chose different CMC with MWs between 6 kDa and 40 kDa (20 kDa) or larger than 40 kDa (60 kDa, 150 kDa), and their combined effects with concentrations on stabilizing ACP dispersions and inducing collagen mineralization lead to different consequences. Therefore, the stability of CMC-ACP dispersions and mineralization of collagen fibrils in these dispersions were correlated to the combined effects of MW and concentration of CMC, and the null hypothesis had to be rejected.Previous studies have demonstrated that relevant variables of two commonly-used NCPs – pAsp and PAA, might affect the outcome of biomimetic mineralization. Higher MW of pAsp yielded faster and a higher degree of mineralization,7 while lower concentration of pAsp induced faster mineralization and crystallization.6 In the cases for PAA, lowering MW and increasing concentration of PAA resulted in solution with increasing stability and purely intrafibrillar mineralization of the collagen,20,39,40 probably due to the shorter chain length and higher mobility of low-MW PAA as well as a higher ratio of [–COO−]/[Ca2+] in solution. In our system, the crystallization-inhibiting and precursor-stabilizing effect of CMC was confirmed via turbidity assessment and CMC-ACP nanoparticle characterization, but due to the complexity and ambiguity of biomineralization process,41 over-stabilized ACP dispersions with low MW of CMC may hinder the crystallization and mineralization within the fibril, which eventually result in excessive inhibition and non-mineralization. The lowest MW of CMC in our study was 20 kDa, which was higher than the freely-accessible threshold of semipermeable collagen fibril, hence some of the stabilized CMC-ACP precursors could penetrate into the fibrils and retard the intrafibrillar mineralization, while some retain outside to suppress extrafibrillar mineralization, resulting in the pure intrafibrillar mineralization with comparatively lower extent in the 20k-200 group. For the 60k-100 dispersion, TEM images showed clusters of small nanoparticles with a diameter of around 50 nm, and the precipitation half-time was elongated to more than 168 hours; pure intrafibrillar mineralization with higher extent was achieved, probably due to the shorter chain length and higher mobility of 60 kDa CMC than that of 150 kDa CMC.39 Although the exact biomineralization mechanism is still exclusive, some have proposed mechanisms like polymer-induced liquid precursor (PILP) process28 and osmotic pressure theory,16 and these are in accordance with our results as intrafibrillar mineralization occurred with stable CMC-ACP precursors, and large precursors excluded from the fibril might induce intrafibrillar mineralization because of the need to balance electroneutrality and osmotic equilibrium simultaneously.
The penetration depth of CMC-ACP precursors into collagen scaffolds is also pivotal for fabrication of biomimetic bone substitute materials.28 In the 20k-50 group, extrafibrillar mineralization was obtained on the surface of collagen scaffolds, which hindered the subsequent penetration of large CMC-ACP nanodroplets into interior region, resulting in non-uniform mineralization and the lowest mineral content. Conversely, no apparent mineral coating was observed on the surface of 20k-200, 60k-100, 60k-200 and 150k-200 collagen scaffolds, and consequently the deeper area had been infiltrated with the small CMC-ACP nanodroplets, which eventually resulted in a higher extent of intrafibrillar mineralization. During the process of biomimetic mineralization, the collagen scaffold acts like a sponge to absorb fluidic CMC-ACP, and these liquid precursors can infiltrate by simple diffusion and eventually be dislodged from CMC into the semipermeable collagen fibril as a result of the balance between osmotic equilibrium and electroneutrality.16 Although experiments like confocal microscopy studies of fluorescently tagged CMC into collagen scaffold and SEM imaging across the cross-sections could further validate the penetration capacities of different CMC-ACP precursors, the present study provides evidence that MW and concentration serve as limiting factors for mineralizing bulk collagen scaffolds, and thus the optimization of these parameters and other reaction conditions should be pursued to obtain scaffolds more representative of bone.
Previous studies have speculated that CMC could stabilize ACP precursors through binding to Ca2+,21,23,27 as the negatively charged carboxyl groups on the C/N-terminal regions; but the Ca2+ binding capacity of CMC has not been examined previously. Our findings have confirmed this ability by showing that the Ca2+ binding to CMC of three different MWs had moderate affinities up to an order of 104 M−1 and was mainly through electrostatic interactions at pH 7.4, which may associate with the negatively charged carboxyl groups. The stoichiometry of binding (N) indicated that one Ca2+ bound with about two 20 kDa CMC, while about five Ca2+ bound with one 60 kDa or 150 kDa CMC, but the detailed coordination mechanism for each Ca2+ binding remained unclear given that the system appeared complex and required more extensive investigations. Moreover, differences in entropic (ΔS) components of three MWs of CMC indicated that 150 kDa CMC might lose the most conformational freedom after binding to Ca2+, probably due to its longest chain length and lowest mobility, which might eventually result in a comparatively lower ratio of [–COO−]/[Ca2+] and stability of CMC-ACP precursors, but the relation between ΔS and conformational changes of CMC was yet to be confirmed by further studies. As increasing concentration of CMC in supersaturated calcium-phosphate dispersions could bind with more Ca2+, which resulted in lowered supersaturation and inhibited crystal growth,42 the elongated precipitation half-time and increased stability of CMC-ACP dispersions could be achieved. In our system, collagen scaffolds mineralized with dispersions containing high concentrations (200 μg ml−1) CMC of all MWs achieved pure intrafibrillar mineralization, indicating that the differences in Ca2+ binding capacities would not lead to different outcomes in stabilizing precursors and inhibiting crystallization, but the “gatekeeper” collagen fibrils could determine the entrance of these CMC-ACP nanodroplets. Recently Lin et al. reported that CMC as a polyampholyte could mediate intrafibrillar mineralization of collagen under acidic conditions, by capturing negatively charged PO43− ions from a supersaturated solution to stabilize ACP nanoparticles.25 This kept us in suspense – how the polyampholyte CMC of different MWs coordinates with ions in ACP under different conditions, and whether modifications of CMC could further promote its function as NCPs analog. Explorations into this novel surrogate with more structural resemblance to natural proteins might provide us with insights into the mechanism of biomineralization.
With the increased demands of bone tissue engineering, biomimetic mineralized scaffold boasts its superiority for providing a macro- and micro-environment similar to that of natural bone, and thus extra seed cells or growth factors are non-required for its construction. The potential effects of guided bone regeneration with collagen membrane were proved to be influenced by different mineralization degree,22,43 with contributing factors like types of polymeric process-directing agents, MWs and concentrations, mineralization time and pattern. Our results support using CMC to surrogate NCPs in biomimetic mineralization and provide parameters of MWs and concentrations for manufacturing mineralized collagen scaffolds with different mineralization degree, and thus may provide valuable attributes for fabrication of precisely-controlled “biomimetic” bone graft substitutes.
5 Conclusions
In the present study, the influence of MW and concentration of CMC as NCPs surrogates on biomimetic mineralization of type I collagen was systematically investigated. The Ca2+ binding capacities of CMC and its role as ACP stabilizers and crystallization inhibitors were confirmed, and the combined effects of CMC MW and concentration on pattern and extent of collagen mineralization by modulating the stability of CMC-ACP precursors were validated. Our work provided the optimal range of MWs and concentrations of CMC for fabrication of biomimetic mineralized collagen scaffolds as well as insights on the role of interactions between ACP precursors and the collagen fibril on collagen mineralization and hence on bone formation.Conflicts of interest
There are no conflicts to declare.Acknowledgements
The authors gratefully acknowledge the financial support from National Natural Science Foundation of China (grant number 81100743), Natural Science Foundation of Guangdong Province (grant number 2018B030311040) and Guangdong Financial Fund for High-Caliber Hospital Construction (grant number 174-2018-XMZC-0001-03-0125/D-15).Notes and references
- S. Weiner, W. Traub and H. D. Wagner, J. Struct. Biol., 1999, 126, 241–255 CrossRef PubMed.
- S. Weiner and W. Traub, FASEB J., 1992, 6, 879–885 CrossRef PubMed.
- E. Beniash, Wiley Interdiscip. Rev.: Nanomed. Nanobiotechnol., 2011, 3, 47–69 CrossRef.
- W. J. Landis, K. J. Hodgens, J. Arena, M. J. Song and B. F. McEwen, Microsc. Res. Tech., 1996, 33, 192–202 CrossRef PubMed.
- H. Gao, B. Ji, I. L. Jager, E. Arzt and P. Fratzl, Proc. Natl. Acad. Sci. U. S. A., 2003, 100, 5597–5600 CrossRef PubMed.
- F. Nudelman, P. H. H. Bomans, A. George, G. de With and N. A. J. M. Sommerdijk, Faraday Discuss., 2012, 159, 357–370 RSC.
- S. S. Jee, T. T. Thula and L. B. Gower, Acta Biomater., 2010, 6, 3676–3686 CrossRef PubMed.
- S. S. Jee, L. Culver, Y. Li, E. P. Douglas and L. B. Gower, J. Cryst. Growth, 2010, 312, 1249–1256 CrossRef.
- Y. Li, T. T. Thula, S. Jee, S. L. Perkins, C. Aparicio, E. P. Douglas and L. B. Gower, Biomacromolecules, 2012, 13, 49–59 CrossRef PubMed.
- L. B. Gower, Chem. Rev., 2008, 108, 4551–4627 CrossRef PubMed.
- T. T. Thula, F. Svedlund, D. E. Rodriguez, J. Podschun, L. Pendi and L. B. Gower, Polymers, 2011, 3, 10–35 CrossRef PubMed.
- D. E. Rodriguez, T. Thula-Mata, E. J. Toro, Y.-W. Yeh, C. Holt, L. S. Holliday and L. B. Gower, Acta Biomater., 2014, 10, 494–507 CrossRef CAS PubMed.
- B. Cantaert, Y.-Y. Kim, H. Ludwig, F. Nudelman, N. A. J. M. Sommerdijk and F. C. Meldrum, Adv. Funct. Mater., 2012, 22, 907–915 CrossRef CAS.
- S. Mai, Y. K. Kim, J. Kim, C. K. Yiu, J. Ling, D. H. Pashley and F. R. Tay, J. Dent. Res., 2010, 89, 405–410 CrossRef CAS.
- F. R. Tay and D. H. Pashley, Biomaterials, 2008, 29, 1127–1137 CrossRef CAS.
- L. N. Niu, S. E. Jee, K. Jiao, L. Tonggu, M. Li, L. Wang, Y. D. Yang, J. H. Bian, L. Breschi, S. S. Jang, J. H. Chen, D. H. Pashley and F. R. Tay, Nat. Mater., 2017, 16, 370–378 CrossRef CAS.
- K. Jiao, L.-N. Niu, C.-F. Ma, X.-Q. Huang, D.-D. Pei, T. Luo, Q. Huang, J.-H. Chen and F. R. Tay, Adv. Funct. Mater., 2016, 26, 6858–6875 CrossRef CAS.
- A. Lotsari, A. K. Rajasekharan, M. Halvarsson and M. Andersson, Nat. Commun., 2018, 9, 4170 CrossRef.
- F. Nudelman, K. Pieterse, A. George, P. H. Bomans, H. Friedrich, L. J. Brylka, P. A. Hilbers, G. de With and N. A. Sommerdijk, Nat. Mater., 2010, 9, 1004–1009 CrossRef CAS.
- Y. Qi, Z. Ye, A. Fok, B. N. Holmes, M. Espanol, M. P. Ginebra and C. Aparicio, ACS Biomater. Sci. Eng., 2018, 4, 2758–2766 CrossRef CAS.
- Y. Wang, N. Van Manh, H. Wang, X. Zhong, X. Zhang and C. Li, Int. J. Nanomed., 2016, 11, 2053–2067 CAS.
- Y. Wang, Y. Hua, Q. Zhang, J. Yang, H. Li, Y. Li, M. Cao, Q. Cai, X. Yang, X. Zhang and C. Li, J. Tissue Eng. Regener. Med., 2018, 12, 1545–1555 CrossRef CAS.
- Z. Chen, S. Cao, H. Wang, Y. Li, A. Kishen, X. Deng, X. Yang, Y. Wang, C. Cong, H. Wang and X. Zhang, PLoS One, 2015, 10, e0116553 CrossRef.
- L. Chen, Z. Tian and Y. Du, Biomaterials, 2004, 25, 3725–3732 CrossRef CAS.
- M. Lin, H. Liu, J. Deng, R. An, M. Shen, Y. Li and X. Zhang, J. Mater. Sci. Technol., 2019, 35, 1894–1905 CrossRef.
- C. A. Wan Andrew, E. Khor and G. W. Hastings, Biomaterials, 1998, 1309–1316 CrossRef CAS.
- Z. Huang, Y. Qi, K. Zhang, L. Gu, J. Guo, R. Wang and S. Mai, J. Mech. Behav. Biomed. Mater., 2019, 89, 81–88 CrossRef CAS.
- M. J. Olszta, X. Cheng, S. S. Jee, R. Kumar, Y.-Y. Kim, M. J. Kaufman, E. P. Douglas and L. B. Gower, Mater. Sci. Eng. R Rep., 2007, 58, 77–116 CrossRef.
- D. Bachurski, M. Schuldner, P. H. Nguyen, A. Malz, K. S. Reiners, P. C. Grenzi, F. Babatz, A. C. Schauss, H. P. Hansen, M. Hallek and E. Pogge von Strandmann, J. Extracell. Vesicles, 2019, 8, 1596016 CrossRef CAS.
- M. Tong, O. S. Brown, P. R. Stone, L. M. Cree and L. W. Chamley, Placenta, 2016, 38, 29–32 CrossRef CAS.
- L. Huang, J. Pi, J. Wu, H. Zhou, J. Cai, T. Li and L. Liu, Pharmacol. Res., 2016, 111, 374–383 CrossRef CAS.
- J. A. Gallego-Urrea, J. Tuoriniemi and M. Hassellöv, TrAC, Trends Anal. Chem., 2011, 30, 473–483 CrossRef CAS.
- P. J. Price, TCA Man., 1975, 1, 43–44 CrossRef CAS.
- S. Leavitt and E. Freire, Curr. Opin. Struct. Biol., 2001, 11, 560–566 CrossRef CAS.
- A. Dey, P. H. Bomans, F. A. Muller, J. Will, P. M. Frederik, G. de With and N. A. Sommerdijk, Nat. Mater., 2010, 9, 1010–1014 CrossRef CAS.
- D. Gebauer and H. Cölfen, Nano Today, 2011, 6, 564–584 CrossRef CAS.
- D. Gebauer, M. Kellermeier, J. D. Gale, L. Bergstrom and H. Colfen, Chem. Soc. Rev., 2014, 43, 2348–2371 RSC.
- D. Toroian, E. L. Joo and P. A. Price, J. Biol. Chem., 2007, 282, 22437–22447 CrossRef CAS.
- S.-C. Huang, K. Naka and Y. Chujo, Polym. J., 2008, 40, 154–162 CrossRef CAS.
- J. Wang, Y. Chen, L. Li, J. Sun, X. Gu, X. Xu, H. Pan and R. Tang, CrystEngComm, 2013, 15, 6151–6158 RSC.
- Y. Wang, T. Azaïs, M. Robin, A. Vallée, C. Catania, P. Legriel, G. Pehau-Arnaudet, F. Babonneau, M.-M. Giraud-Guille and N. Nassif, Nat. Mater., 2012, 11, 724–733 CrossRef CAS.
- J. Chu, X. Feng, H. Guo, T. Zhang, H. Zhao and Q. Zhang, Front. Physiol., 2018, 9, 842 CrossRef.
- J. Wang, Y. Qu, C. Chen, J. Sun, H. Pan, C. Shao, R. Tang and X. Gu, Mater. Sci. Eng., C, 2019, 104, 109959 CrossRef CAS PubMed.
Footnotes |
| † Electronic supplementary information (ESI) available. See DOI: 10.1039/d0ra00999g |
| ‡ These authors contributed equally to this work. |
| This journal is © The Royal Society of Chemistry 2020 |

