 Open Access Article
An Na-modified Fe@C core–shell catalyst for the enhanced production of gasoline-range hydrocarbons via Fischer–Tropsch synthesis†
Guangyuan Maa,
Yanfei Xua,
Jie Wanga,
Jingyang Baia,
Yixiong Dua,
Jianli Zhangb and
Mingyue Ding *abc
*abc
aSchool of Power and Mechanical Engineering, Hubei International Scientific and Technological Cooperation Base of Sustainable Resource and Energy, Wuhan University, Wuhan 430072, China. E-mail: dingmy@whu.edu.cn
bState Key Laboratory of High-efficiency Utilization of Coal and Green Chemical Engineering, Ningxia University, Yinchuan 750021, China
cShenzhen Research Institute of Wuhan University, Shenzhen 518108, China
First published on 18th March 2020
Abstract
Although numerous studies have been conducted in the field of converting syngas to value-added fuels, selectively converting syngas to gasoline-range hydrocarbons (C5–12 hydrocarbons) remains a big challenge. Alkali metal (namely, K, Na and Li)-modified Fe@C core–shell catalysts were synthesized by a one-step hydrothermal method for Fischer–Tropsch synthesis. An optimized selectivity of 56% for the C5–12 hydrocarbons with a higher CO conversion of about 95% was obtained for the FeNa2.0@C catalyst compared to that for other alkali metal-modified Fe@C catalysts. According to the characterization results, the incorporation of alkali metals into Fe@C enhanced the conversion of FeCO3 to Fe3O4, which promoted the formation of the FTS active phase iron carbides. In particular, the strongest interaction of Fe–alkali metal and the highest amount of surface carbon layers were observed after adding an Na promoter into Fe@C in contrast to that observed for K and Li promoters, which strengthened the synergistic effect of Fe–Na metals and the spatial confinement of the core–shell structure, further improving the C5–12 hydrocarbon selectivity.
Introduction
Increasing consumption of crude oil and CO2 emission have led to a worldwide concern and driven the research on the alternative processes of liquid fuel production in recent years.1 Syngas (CO + H2) derived from biomass, coal or natural gas can be converted to liquid fuels and valuable chemicals by the Fischer–Tropsch synthesis (FTS) technology, which has attracted more and more attention for both academic and industrial utilization.2 FTS produces a wide range of hydrocarbons with different carbon numbers by a carbon chain growth reaction following the Anderson–Schulz–Flory (ASF) distribution. Breaking the ASF distribution for producing target hydrocarbons is difficult but very important.3Compared to the catalysts based on other FTS-active metals, namely, Co, Ru and Ni, Fe-based catalysts have attracted much interest for the conversion of syngas with a lower H2/CO ratio originating from coal or biomass due to the lower cost and higher water–gas shift (WGS) activity.4 To break the ASF distribution and improve the selectivity of target products, electron promoters (e.g., Mn, K and Na)5 and structural supports (e.g., Al2O3 and SiO2)6,7 are commonly used to modify the electronic and spatial structures of active Fe metal. In addition, a bi-functional catalyst with Fe metal combined with zeolites is adopted to crack or isomerize the FTS products.1 Ma et al.8 reported that Na–Zn–Fe5C2 combined with hierarchical HZSM-5 significantly changed the FTS product distribution, leading to the formation of aromatics with 51% selectivity.
Recently, designing core–shell structured catalysts has attracted increasing interest due to spatial confinement and suppression of the agglomeration of the nanoparticles inside the cavity.9 The results reported by Chen et al.10 indicated that the core–shell Fe2O3@CNT catalyst promoted the catalytic activity and C5+ hydrocarbon selectivity. Bao et al.11 designed a core–shell structured catalyst with Fe encapsulated with an H-type zeolite, which suppressed the formation of methane while improving the C5+ hydrocarbon selectivity. Yu et al.12 prepared a catalyst comprising FexOy encapsulated by carbon species, which presented excellent performance for promoting the production of C5–12 hydrocarbons. According to our previous work, an Fe3O4@C core–shell catalyst was designed, which showed 45% selectivity for C5–12 hydrocarbons.13 Therefore, the dimensional and chemical characteristics of the unique core–shell structure over Fe-based catalysts can tune the FTS product distribution effectively.
Additionally, alkali promoters (K, Na and Mg) have been extensively used for modifying the structure and electron density of Fe-based catalysts.5,14 Yong et al.15 investigated the effect of a K promoter incorporated in Fe–Mn catalysts on the FTS performance and found that adding the K promoter suppressed the hydrogenation function of the catalyst, resulting in a decrease in methane and light hydrocarbon selectivities, whereas there was an increase in olefin selectivity. It has been reported that the addition of sodium into Fe-based catalysts is sensitive to olefin formation, but the function of Na is unclear.7 The results reported by de Jong et al.16 indicated that the incorporation of sodium and sulfur promoters into Fe/α-Al2O3 enhanced the catalytic activity, increased the C2–4 olefin selectivity, and restrained the formation of methane. Ma et al.17 suggested that the sodium-modulated Fe5C2 catalyst altered the electronic status of active iron species, which strengthened CO activation but suppressed the hydrogenation of double bonds, promoting the formation of C5+ alkenes. Alkali metals added into Fe-based catalysts adjusted the hydrocarbon product distribution dramatically. However, the combination of alkali metal promoters and core–shell structures over Fe-based catalysts is rarely reported.
Herein, alkali metal-modified Fe@C core–shell catalysts were prepared, and they displayed excellent Fischer–Tropsch synthesis performances. In particular, the Na-modified Fe@C catalyst exhibited superior gasoline-range hydrocarbon (C5–12) selectivity (up to 56%) with high catalytic activity (about 95%) during FTS compared to the catalysts modified with other alkali metals. Numerous techniques including inductively coupled plasma (ICP), scanning electron microscopy (SEM), transmission electron microscopy (TEM), N2 adsorption–desorption isotherms (BET), NH3 temperature-programmed desorption (NH3-TPD), X-ray photoelectron spectroscopy (XPS), Raman spectroscopy (LRS), and Fourier transform infrared (FTIR) spectroscopy were combined to reveal the structure–performance relationship of the designed catalysts.
Experimental section
Catalyst preparation
Fe–M@C catalysts were synthesized by a hydrothermal process, where M is the alkali metal. Typically, FeCl3·6H2O and a desired amount of alkali metal promoters (NaCl, KCl, or LiCl) were dissolved in 80 mL ethylene glycol. Then, 6.0 g urea and 0.4 g glucose were dispersed into the solution by stirring. The mixture was heated at 200 °C for 12 h in a Teflon-lined stainless-steel autoclave. The products were washed several times using deionized water and ethanol. The samples were dried at 60 °C for 12 h. The actual loading of alkali metal promoters determined by inductively coupled plasma (ICP) was around 1.0 wt%. In addition, FeNax@C catalysts with different sodium contents were prepared by the same method mentioned above. The weight percentages of sodium loading were 0.0, 0.5, 1.0, 2.0, and 3.0 wt%.Catalyst characterization and catalytic evaluation
The details of catalyst characterization and catalytic tests are shown in the ESI.†Results and discussion
Textural properties of the Fe–M@C catalysts
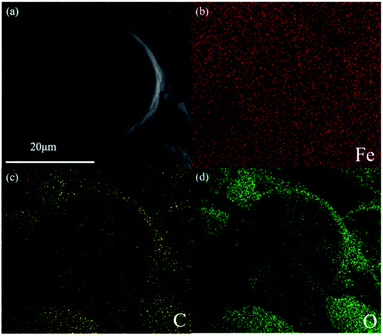
Carbon-encapsulated Fe–M nanocatalysts were synthesized by a one-step hydrothermal method without calcination. As shown in the SEM image in Fig. S1 (ESI†), Fe@C displays uniform morphology, in which the average size of the spherical particles is about 28 μm, and its morphology is similar to that of Fe3O4@C reported in our previous work.18 The addition of alkali metals including Na, K, and Li into the Fe@C core–shell catalyst did not change the morphology and structure. The ICP analysis results (Table S1†) indicated that the amounts of alkali metals were in the range of 0.4–0.6 wt%, implying that all the alkali metals, i.e., Na, K, and Li were added into Fe@C. Taking the Fe–Na@C catalyst as a representative sample, the Fe, C, and O elements are present but the Na element is not observed in the EDS element mapping image (Fig. 1). It is possible that a small amount of the Na promoter added into the Fe–Na@C catalyst is well dispersed in the core–shell structure, which limits the observation of the Na element in the EDS mapping image. In addition, iron and carbon are both dispersed well without appearing in the growth pattern of the layer-by-layer structure, suggesting that nano Fe-in-C crystallites tend to aggregate into large core–shell structured nanoparticles.The porous nature of Fe–M@C was analyzed using N2 adsorption–desorption isotherm plots. As shown in Fig. S2a,† all of the Fe@C and Fe–M@C catalysts exhibit characteristics of typical type IV isotherms with an H2 hysteresis loop, which can be ascribed to “ink-bottle-like” mesoporous materials.19 The mesopores are attributed to the aggregation of Fe or FeM nanoparticles encapsulated by carbon layers.18 The textual properties of Fe@C calculated by the BET method (shown in Table 1) indicated that the BET surface area and pore sizes were 233.6 m2 g−1 and 2.94 nm, respectively. The incorporation of alkali metals, i.e., Na, K, and Li into Fe@C resulted in a decrease in the BET surface area and increase in pore size, which may be caused by the enhanced dehydration of glucose by the alkali promoter, promoting the formation of carbonaceous colloids.20 From Fig. S2b,† it can be found that the pore size distribution of Fe@C shifts towards a larger size after the addition of alkali metals, further confirming the enhanced mesoporous structures formed after adding alkali metals. The largest pore size of 5.96 nm is exhibited for the Fe–Na@C catalyst.
| Samples | BET surface area (m2 g−1) | Pore volume (cm3 g−1) | Pore size (nm) |
|---|---|---|---|
| Fe@C | 233.6 | 0.11 | 2.94 |
| Fe–Na1.0@C | 143.2 | 0.27 | 5.96 |
| Fe–K1.0@C | 190.7 | 0.16 | 4.74 |
| Fe–Li1.0@C | 174.3 | 0.10 | 4.55 |
Reduction behavior of the Fe–M@C catalysts
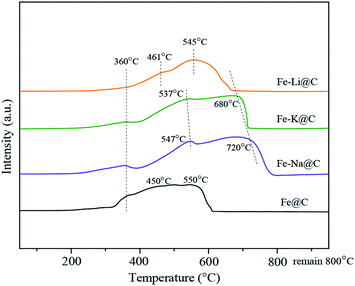
The reduction behavior of the Fe–M@C catalysts was analyzed by H2-TPR. Fig. 2 shows that three main reduction peaks emerge at around 360, 450 and 550 °C for the Fe@C catalyst, corresponding to the continual reduction of FeCO3 → Fe3O4 → FeO → Fe. In the Fe@C catalyst, FeCO3-in-C core–shell structures are formed by the FeCO3 nanoparticles combined with carbonaceous colloids via coulombic interactions, as confirmed in our previous work.18 After the addition of alkali metals, the intensity of the reduction peak of FeCO3 → Fe3O4 decreases significantly, which may be caused by the further dehydration of functional groups on the surface of carbonaceous species, promoting the conversion of FeCO3 to Fe3O4.21 In addition, the reduction peaks of Fe3O4 → FeO → Fe for Fe@C shift to a higher temperature after the addition of the Na, K and Li promoters, which may be ascribed to the enhanced interaction between Fe and alkali metals in the core layers of the Fe–M@C catalysts, restraining the reduction of iron oxides.22 Specifically, the reduction peaks of Fe–Na@C shift towards the highest temperature, revealing the strongest interaction of Fe–Na compared to Fe–K and Fe–Li in the Fe–M@C catalysts.Phase compositions of Fe–M@C catalysts
The bulk phase compositions of the catalysts were estimated by XRD (Fig. 3a). As can be seen, the diffraction peaks of FeCO3 at 2θ of 24.8°, 32.0°, 38.3°, 42.3°, 46.2°, 52.6°, and 52.8° appear for the Fe@C catalyst, while no diffraction peaks of Fe3O4 are observed, indicating that Fe@C is mainly composed of the FeCO3 phase. After the addition of alkali metals, i.e., Na, K and Li, except for the diffraction peaks of FeCO3, new diffraction peaks of Fe3O4 at 2θ of 30.2°, 35.5°, 43.2°, 57.1°, and 62.6° (JCPDS No. 99-0073) are displayed, suggesting that the phase transformation of FeCO3 to Fe3O4 occurs after the alkali metals are added to the Fe@C catalyst. The results are consistent with that of H2-TPR discussed above, further confirming that the alkali environment promotes the dehydration of surface functional groups such as O–H and C![[double bond, length as m-dash]](https://www.rsc.org/images/entities/char_e001.gif) O of carbonaceous species, enhancing the self-assembly of FeCO3-in-C microstructures to form Fe3O4-carbon core–shell structures. The surface phase compositions of the Fe–M@C catalysts were further characterized by XPS. Fig. 3b and c show the XPS spectra of Fe 2p and C 1s of the Fe–M@C catalysts, respectively. An Fe 2p3/2 peak at 710.5 eV with a shoulder Fe 2p1/2 peak at 723.8 eV is displayed on the surface of Fe@C, which may be ascribed to the Fe2+ species originating from the FeCO3 phase. As alkali metals are added into Fe@C, the Fe 2p peak displays a 0.4 eV shift to higher binding energy (Fig. 3b), which indicates the formation of Fe3+ species on the surface of the Fe–M@C catalysts; this verifies that the incorporation of alkali metals into Fe@C promotes the conversion of FeCO3 to Fe3O4 (both the Fe3+ and Fe2+ species). The C 1s spectrum (Fig. 3c) of the Fe–M@C catalysts can be separated into three peaks at 289.0, 285.4 and 284.5 eV, which are attributed to the –CO3, C–O–C and C
O of carbonaceous species, enhancing the self-assembly of FeCO3-in-C microstructures to form Fe3O4-carbon core–shell structures. The surface phase compositions of the Fe–M@C catalysts were further characterized by XPS. Fig. 3b and c show the XPS spectra of Fe 2p and C 1s of the Fe–M@C catalysts, respectively. An Fe 2p3/2 peak at 710.5 eV with a shoulder Fe 2p1/2 peak at 723.8 eV is displayed on the surface of Fe@C, which may be ascribed to the Fe2+ species originating from the FeCO3 phase. As alkali metals are added into Fe@C, the Fe 2p peak displays a 0.4 eV shift to higher binding energy (Fig. 3b), which indicates the formation of Fe3+ species on the surface of the Fe–M@C catalysts; this verifies that the incorporation of alkali metals into Fe@C promotes the conversion of FeCO3 to Fe3O4 (both the Fe3+ and Fe2+ species). The C 1s spectrum (Fig. 3c) of the Fe–M@C catalysts can be separated into three peaks at 289.0, 285.4 and 284.5 eV, which are attributed to the –CO3, C–O–C and C![[double bond, length as m-dash]](https://www.rsc.org/images/entities/char_e001.gif) C bonds, respectively.23,24 The Fe–M@C catalysts exhibit a higher intensity of the peak for the C
C bonds, respectively.23,24 The Fe–M@C catalysts exhibit a higher intensity of the peak for the C![[double bond, length as m-dash]](https://www.rsc.org/images/entities/char_e001.gif) C bond than that for Fe@C, suggesting that the alkali metal-modified Fe@C catalysts promote the formation of carbon layers on the surface of the catalysts. In particular, the highest intensity of the peak for the C
C bond than that for Fe@C, suggesting that the alkali metal-modified Fe@C catalysts promote the formation of carbon layers on the surface of the catalysts. In particular, the highest intensity of the peak for the C![[double bond, length as m-dash]](https://www.rsc.org/images/entities/char_e001.gif) C bond is exhibited for the Fe–Na@C catalyst compared to that for other Fe–M@C catalysts, implying that optimized carbon layers are formed via the addition of the Na promoter into Fe@C. The surface functional groups of the Fe–M@C catalysts were evaluated by using FTIR spectroscopy (Fig. 3d). Bands at v = 3450, 1640, and 1390 cm−1 are observed for the Fe–M@C catalysts, corresponding to the –OH, C
C bond is exhibited for the Fe–Na@C catalyst compared to that for other Fe–M@C catalysts, implying that optimized carbon layers are formed via the addition of the Na promoter into Fe@C. The surface functional groups of the Fe–M@C catalysts were evaluated by using FTIR spectroscopy (Fig. 3d). Bands at v = 3450, 1640, and 1390 cm−1 are observed for the Fe–M@C catalysts, corresponding to the –OH, C![[double bond, length as m-dash]](https://www.rsc.org/images/entities/char_e001.gif) C and –COO– groups, indicating that abundant functional groups are present on the surface layers. These functional groups are due to glucose dehydration while forming Fe or FeM particles encapsulated by carbon shells. Raman spectra also confirm this phenomenon. As shown in Fig. S3,† there are two broad bands at 1342 and 1581 cm−1 for all the catalysts, which are ascribed to the D and G type carbons, respectively.9 The D type carbon is ascribed to amorphous carbon, while the G type carbon is attributed to graphitic carbon. Compared to the observation for Fe@C, the intensities of both D and G type carbons increase for the Fe–M@C catalysts, indicating that the addition of alkali metals into Fe@C is in favor of the composition of surface carbon layers. The highest intensities of the D and G bands are displayed for the Fe–Na@C catalyst, further confirming the optimized function of the Na promoter on the carbon layers formed.
C and –COO– groups, indicating that abundant functional groups are present on the surface layers. These functional groups are due to glucose dehydration while forming Fe or FeM particles encapsulated by carbon shells. Raman spectra also confirm this phenomenon. As shown in Fig. S3,† there are two broad bands at 1342 and 1581 cm−1 for all the catalysts, which are ascribed to the D and G type carbons, respectively.9 The D type carbon is ascribed to amorphous carbon, while the G type carbon is attributed to graphitic carbon. Compared to the observation for Fe@C, the intensities of both D and G type carbons increase for the Fe–M@C catalysts, indicating that the addition of alkali metals into Fe@C is in favor of the composition of surface carbon layers. The highest intensities of the D and G bands are displayed for the Fe–Na@C catalyst, further confirming the optimized function of the Na promoter on the carbon layers formed.
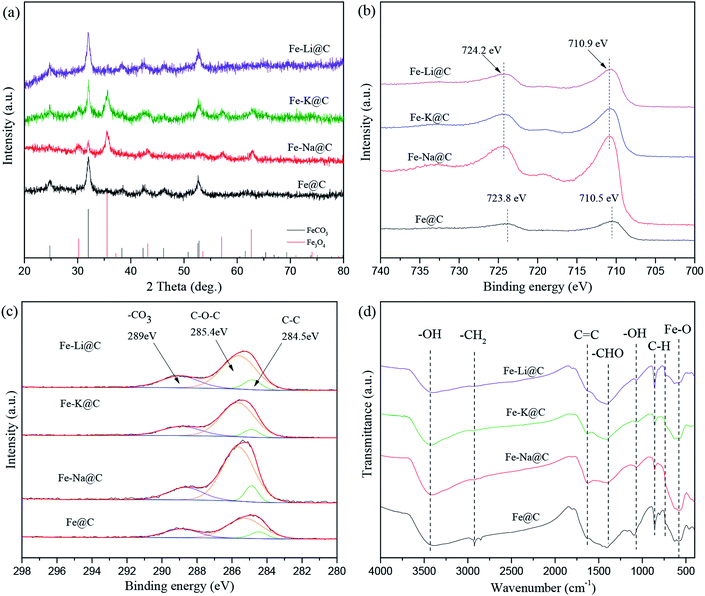 | ||
| Fig. 3 XRD patterns of the catalysts (a); XPS spectra of Fe 2p (b) and C 1s (c) for the catalysts; FTIR spectra of the catalysts (d). | ||
FTS performance of Fe–M@C catalysts
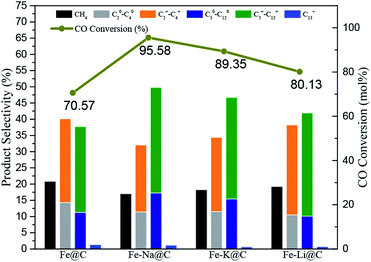
The FTS performance of the Fe–M@C catalysts was studied in a fixed-bed reactor under industrially relevant reaction conditions (shown in Fig. 4 and Table S2†). The Fe@C catalyst presents about 70% of CO conversion and 35 μmolCO gFe−1 s−1 of FTY (the number of CO moles converted to hydrocarbons per gram of iron per second). As alkali metals are added into Fe@C, both CO conversion and FTY increase significantly. The highest catalytic activity (95% of CO conversion and 55 μmolCO gFe−1 s−1 of FTY) is displayed for the Fe–Na@C catalyst. In addition, the product distribution shown in Table S2† and Fig. 4 indicates that the Fe@C catalyst displays higher methane selectivity and lower C5+ hydrocarbon selectivity compared to the Fe–M@C catalysts, suggesting that the modification by alkali metals, namely, Na, K and Li promotes the shift in the product distribution to heavy hydrocarbons. More interestingly, the Fe–Na@C catalyst presents optimized C5+ hydrocarbon selectivity (51%), especially C5–12 selectivity (50%), in contrast to Fe–K@C and Fe–Li@C.It is generally accepted that alkali metals have an obvious effect on the FTS of Fe-based catalysts.25–27 Bukur et al.28 suggested that an increase in the K content in the Fe-based catalyst promoted the catalytic activity, while excessive addition of the K promoter resulted in decrease in CO conversion. Additionally, An et al.29 reported that increasing the residual Na content in the Fe–Cu based catalyst resulted in the decrease in CO conversion. In the present study, the Fe@C catalyst is mainly composed of FeCO3, which is converted to Fe3O4 after the addition of alkali metals. The Fe3O4 phase could be directly transformed into active iron carbides during the FTS reaction, while FeCO3 could not be directly transformed.30 Therefore, the alkali metal-modified Fe@C catalyst facilitates the formation of active iron carbides, promoting the FTS performance. As we know, an alkali promoter enhances CO chemisorption but weakens H2 chemisorption over the Fe-based catalysts, which leads to a higher CO/H2 ratio, promoting the product distribution shift toward heavy hydrocarbons.15 The interaction of Fe and an alkali metal is strengthened as the alkali metal is added into Fe@C, as confirmed by H2-TPR; this may enhance the synergistic effect of Fe–alkali metal, improving the formation of C5+ hydrocarbons. On the other hand, the incorporation of alkali metals into Fe@C increases the amount of carbon on the surface layer, which may extend the residence time for the formation of the –CHX species inside the carbon shell, promoting their polymerization for producing long-range hydrocarbons.13 Interestingly, the Fe–Na@C catalyst presents optimized activity and C5–12 selectivity among all the Fe–M@C catalysts.
Characterization of the FeNax@C catalysts
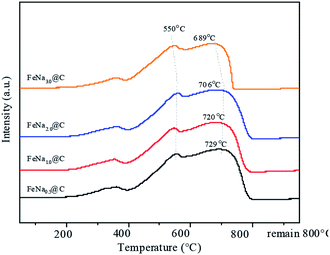
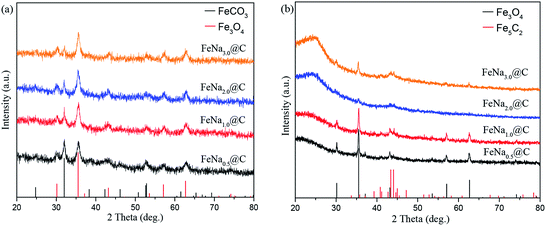
In order to further modify the FTS performance, the FeNa@C catalysts with different sodium contents were studied. The N2 adsorption–desorption isotherm plots of the FeNax@C catalysts with various sodium contents are shown in Fig. S4.† All the FeNax@C catalysts displayed structures similar to “ink-bottle-like” mesoporous materials with typical type IV isotherms and an H2 hysteresis loop, implying that sodium loading did not destroy the morphology of FeNax@C. The textual properties listed in Table S3† show that the average pore size increases gradually on increasing the sodium content and reaches a maximum at the sodium content of 2.0 wt%. Beyond this sodium content, the average pore size begins to decrease. A contrary changing trend is exhibited for the BET surface area. This suggests that the incorporation of 2.0 wt% Na into Fe@C results in an optimized interaction between Fe and Na, which enhances the dehydration of the surface functional groups of carbon layers and promotes the aggregation of Fe3O4–C core–shell structures, leading to the highest average pore size with the lowest BET surface area. From the H2-TPR results (Fig. 5), it can be seen that three main reduction peaks corresponding to the continual reduction of FeCO3 → Fe3O4 → FeO → Fe are displayed at around 360, 450 and 550 °C. On increasing the sodium content, the reduction peaks of Fe3O4 → FeO → Fe shift slightly towards higher temperatures, indicating that the increase in sodium loading enhances the Fe–Na interaction, suppressing the reduction of iron oxides. As the sodium content exceeds 2.0 wt%, the reduction peaks of iron oxide shift slowly to a lower temperature; this may be ascribed to the addition of excess sodium, which plays a negative role in the Fe–Na interaction.The bulk structures of fresh and spent FeNax@C catalysts were characterized by XRD. Diffraction peaks for FeCO3 and Fe3O4 appear for the fresh catalysts (Fig. 6a). It is apparent that the peak intensity of FeCO3 decreases with the gradual addition of the sodium promoter, indicating that increasing the sodium content strengthens the conversion of FeCO3 to Fe3O4 in the FeNax@C catalysts. The ratio of the Fe3O4/FeCO3 peak intensity increases gradually on increasing the sodium content, further confirming the enhanced conversion of FeCO3 to Fe3O4 in the FeNa@C catalyst with a higher sodium loading. After the reaction, new diffraction peaks of iron carbides at about 43–44° appear (Fig. 6b); this demonstrates that iron oxides are partly converted to iron carbides during the reaction and act as active sites in the Fischer–Tropsch synthesis. The peak intensity of iron carbides increases gradually and reaches the maximum value at 1.0 wt% Na loading; then, it begins to decrease with a continual increase in Na loading.
The surface structures of the as-prepared FeNax@C catalysts were further analyzed by XPS. Both the Fe3+ and Fe2+ species are observed on the surface of the FeNax@C catalysts. Both the Na/Fe and C/Fe molar ratios on the surface layers are shown in Fig. 7. As shown in Fig. 7a, the Na/Fe ratio increases with the addition of sodium. The Na/Fe ratio increases from 0.012 for 0.5 wt% Na loading to 0.044 for 3.0 wt% Na loading, following a linear relationship with the increasing Na loading. In addition, the C/Fe ratio increases slowly with the increase in the Na loading (Fig. 7b). The C/Fe ratio of FeNa0.5@C is 1.61, which increases to 2.34 for FeNa2.0@C, only 0.45-fold amplification. When the Na loading is over 2.0 wt%, the C/Fe ratio increases significantly. The C/Fe ratio of FeNa3.0@C is 4.17, which is almost two times higher than that of FeNa2.0@C, indicating that adding excess Na promoter obviously improves the formation of surface carbon layers.
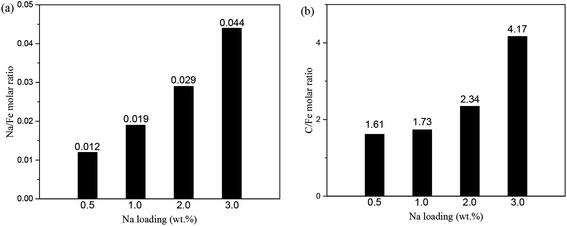 | ||
| Fig. 7 Na/Fe molar ratio (a) and C/Fe molar ratio (b) of surface layer FeNax@C (x = 0.5, 1.0, 2.0, 3.0) (calculated by XPS). | ||
FTS performance of the Na-promoted Fe@C catalyst
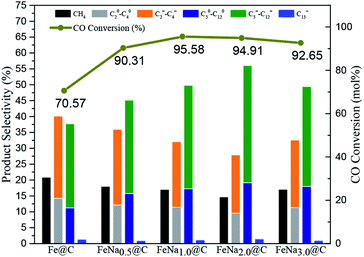
The FTS performance of the FeNax@C catalysts was evaluated at the reaction conditions of 340 °C, 2.0 MPa and H2/CO = 1. As shown in Fig. 8 and Table S4,† CO conversion increases gradually with the increase in sodium content and reaches a maximum value (95.6%) at 1.0 wt% sodium. With the continual increase in the sodium content in the FeNa@C catalyst, the catalytic activity begins to decrease slightly. The effect of sodium on the FTS activity is similar to that reported in some previous reports.31,32 In the present study, the incorporation of an Na promoter into Fe@C facilitates the formation of active iron carbides, as confirmed by XRD. Synchronously, the catalytic activity presents an increasing trend. The maximum intensity of the peak of iron carbides is observed when the Na loading is 1.0 wt%, which results in a maximum value of 95.6% for CO conversion. With the further increase in Na loading over the FeNax@C catalyst, the amount of iron carbides begins to decrease, implying the decrease in FTS active sites. Therefore, CO conversion decreases slightly with the continual increase in Na loading.In addition, the product distribution changes on changing the Na loading. The C5+ hydrocarbon selectivity increases gradually on increasing the loading of the Na promoter and reaches the maximum value at 2.0 wt% Na loading. As the Na loading exceeds 2.0 wt%, the C5+ hydrocarbon selectivity begins to decrease. A contrary changing trend is exhibited for methane selectivity. A maximum value of 57.5% for the C5+ hydrocarbons with 56.1% for the C5–12 hydrocarbons and a minimum value of 14.6% for CH4 are obtained for the FeNa2.0@C catalyst. The product distribution of FTS based on the ASF model predicts that the maximum selectivity of the C5–12 hydrocarbons is approximately 45%.13 The FeNa2.0@C catalyst in the present study exhibits about 56.1% of C5–12 selectivity with a CO conversion of 94.9%, which is extremely deviated from the typical ASF distribution; this suggests that the Na-modified Fe@C catalyst may tune the product distribution of hydrocarbons via breaking the ASF model efficiently.
Ma et al.17 studied the effect of an Na promoter on the FTS performance of the Fe–Zn–Na catalyst and found that the incorporation of the Na promoter facilitated the shift of product distribution towards heavy hydrocarbons, especially promoting the formation of olefins. The results reported by de Jong et al.33 indicated that the enhanced interaction of Fe–Na suppressed the formation of methane. All of these results suggest that the incorporation of the Na promoter into Fe-based catalysts plays an important role in tuning the product distribution of hydrocarbons. In the present study, the incorporation of the Na promoter into Fe@C enhances the interaction of Fe–Na, which reaches the maximum value as the Na loading increases to 2.0 wt%, as confirmed by H2-TPR. Synchronously, the product distribution shifts slowly towards heavy hydrocarbons, suggesting that the enhanced interaction of Fe–Na facilitates the formation of the C5+ hydrocarbons. As the Na loading exceeds 2.0 wt%, the Fe–Na interaction begins to decrease, which results in the products shifting towards light hydrocarbons. On the other hand, excessive addition of the Na promoter (over 2.0 wt%) into Fe@C promotes the formation of surface carbon layers, probably suppressing the production of the C5+ hydrocarbons via decreasing the active sites for Fischer–Tropsch synthesis.
Conclusions
In summary, core–shell Fe@C catalysts modified by different alkali metals (namely, K, Na and Li) were prepared successfully and applied for Fischer–Tropsch synthesis. The incorporation of alkali metals into Fe@C facilitated the phase transformation of FeCO3 to Fe3O4, promoting the formation of active iron carbides for FTS and shifting the product distribution towards heavy hydrocarbons. In particular, the Fe–Na@C catalyst exhibited optimum catalytic activity and C5–12 hydrocarbon selectivity compared to other alkali metal (K and Li)-modified Fe@C catalysts. The characterization results indicated that the strongest interaction of Fe–Na and the highest number of surface carbon layers were displayed for the Fe–Na@C catalyst, which enhanced the synergistic effect of Fe–Na metal and spatial confinement of the core–shell structure; this promoted the formation of the C5+ hydrocarbons, especially that of the C5–12 hydrocarbons, in contrast to that observed for the K and Li promoters. However, the excessive addition of the Na promoter (over 2.0 wt%) decreased the Fe–Na interaction and accelerated the formation of surface carbon layers, reducing the catalytic activity and C5+ hydrocarbon selectivity. An optimized selectivity of 56.1% for the C5–12 hydrocarbons with 95% CO conversion was obtained for the FeNa2.0@C catalyst under industrially relevant conditions.Conflicts of interest
There are no conflicts to declare.Acknowledgements
The authors gratefully acknowledge the financial supports from the National Natural Science Foundation of China (51861145102, 21978225), Science and Technology Program of Shenzhen (JCYJ20180302153928437), Foundation of State Key Laboratory of High-efficiency Utilization of Coal and Green Chemical Engineering (2019-KF-06) and Fundamental Research Fund for the Central Universities (2042019kf0221).Notes and references
- D. X. Martínez-Vargas, L. Sandoval-Rangel, O. Campuzano-Calderon, M. Romero-Flores, F. J. Lozano, K. D. P. Nigam, A. Mendoza and A. Montesinos-Castellanos, Ind. Eng. Chem. Res., 2019, 58, 15872–15901 CrossRef.
- W. Zhou, K. Cheng, J. Kang, C. Zhou, V. Subramanian, Q. Zhang and Y. Wang, Chem. Soc. Rev., 2019, 48, 3193–3228 RSC.
- J. Sun, G. Yang, X. Peng, J. Kang, J. Wu, G. Liu and N. Tsubaki, ChemCatChem, 2019, 11, 1412–1424 CrossRef CAS.
- Y. Lu, Q. Yan, J. Han, B. Cao, J. Street and F. Yu, Fuel, 2017, 193, 369–384 CrossRef CAS.
- H. Xiong, M. A. Motchelaho, M. Moyo, L. L. Jewell and N. J. Coville, Fuel, 2015, 150, 687–696 CrossRef CAS.
- A. H. Lillebø, A. Holmen, B. C. Enger and E. A. Blekkan, Wiley Interdiscip. Rev.: Energy Environ., 2013, 2, 507–524 Search PubMed.
- K. Cheng, V. V. Ordomsky, B. Legras, M. Virginie, S. Paul, Y. Wang and A. Y. Khodakov, Appl. Catal., A, 2015, 502, 204–214 CrossRef CAS.
- B. Zhao, P. Zhai, P. Wang, J. Li, T. Li, M. Peng, M. Zhao, G. Hu, Y. Yang, Y.-W. Li, Q. Zhang, W. Fan and D. Ma, Chem, 2017, 3, 323–333 CAS.
- C. Zhu, M. Zhang, C. Huang, L. Zhong and K. Fang, New J. Chem., 2018, 42, 2413–2421 RSC.
- W. Chen, Z. Fan, X. Pan and X. Bao, J. Am. Chem. Soc., 2008, 130, 9414–9419 CrossRef CAS PubMed.
- J. Bao, G. Yang, C. Okada, Y. Yoneyama and N. Tsubaki, Appl. Catal., A, 2011, 394, 195–200 CrossRef CAS.
- G. Yu, B. Sun, Y. Pei, S. Xie, S. Yan, M. Qiao, K. Fan, X. Zhang and B. Zong, J. Am. Chem. Soc., 2010, 132, 935–937 CrossRef CAS PubMed.
- J. Tu, M. Ding, Q. Zhang, Y. Zhang, C. Wang, T. Wang, L. Ma and X. Li, ChemCatChem, 2015, 7, 2323–2327 CrossRef CAS.
- M. Luo and B. H. Davis, Appl. Catal., A, 2003, 246, 171–181 CrossRef CAS.
- Y. Yang, H.-W. Xiang, Y.-Y. Xu, L. Bai and Y.-W. Li, Appl. Catal., A, 2004, 266, 181–194 CrossRef CAS.
- H. M. Torres Galvis, A. C. J. Koeken, J. H. Bitter, T. Davidian, M. Ruitenbeek, A. I. Dugulan and K. P. de Jong, J. Catal., 2013, 303, 22–30 CrossRef CAS.
- P. Zhai, C. Xu, R. Gao, X. Liu, M. Li, W. Li, X. Fu, C. Jia, J. Xie, M. Zhao, X. Wang, Y.-W. Li, Q. Zhang, X.-D. Wen and D. Ma, Angew. Chem. Int. Ed., 2016, 55, 9902–9907 CrossRef CAS PubMed.
- G. Ma, X. Wang, Y. Xu, Q. Wang, J. Wang, J. Lin, H. Wang, C. Dong, C. Zhang and M. Ding, ACS Appl. Energy Mater., 2018, 1, 4304–4312 CrossRef CAS.
- X. Han, K. Fang and Y. Sun, RSC Adv., 2015, 5, 51868–51874 RSC.
- J. Venter, M. Kaminsky, G. L. Geoffroy and M. A. Vannice, J. Catal., 1987, 103, 450–465 CrossRef CAS.
- Z. Zhong, J. Ho, J. Teo, S. Shen and A. Gedanken, Chem. Mater., 2007, 19, 4776–4782 CrossRef CAS.
- M. Ding, J. Tu, M. Qiu, T. Wang, L. Ma and Y. Li, Appl. Energy, 2015, 138, 584–589 CrossRef CAS.
- A. Ejaz, Z. Lu, J. Chen, Q. Xiao, X. Ru, G. Han and T. Shoji, Corros. Sci., 2015, 101, 165–181 CrossRef CAS.
- J. Ryu, Y.-W. Suh, D. J. Suh and D. J. Ahn, Carbon, 2010, 48, 1990–1998 CrossRef CAS.
- J. Li, X. Cheng, C. Zhang, Y. Yang and Y. Li, J. Mol. Catal. A: Chem., 2015, 396, 174–180 CrossRef CAS.
- J. Gaube and H.-F. Klein, Appl. Catal., A, 2008, 350, 126–132 CrossRef CAS.
- J. Li, X. Cheng, C. Zhang, Q. Chang, J. Wang, X. Wang, Z. Lv, W. Dong, Y. Yang and Y. Li, Appl. Catal., A, 2016, 528, 131–141 CrossRef CAS.
- D. B. Bukur, D. Mukesh and S. A. Patel, Ind. Eng. Chem. Res., 1990, 29, 194–204 CrossRef CAS.
- X. An, B. Wu, W. Hou, H. Wan, Z. Tao, T. Li, Z. Zhang, H. Xiang, Y. Li, B. Xu and F. Yi, J. Mol. Catal. A: Chem., 2007, 263, 266–272 CrossRef CAS.
- M. Ding, Y. Yang, Y. Li, T. Wang, L. Ma and C. Wu, Appl. Energy, 2013, 112, 1241–1246 CrossRef CAS.
- X. An, B. Wu, H.-J. Wan, T.-Z. Li, Z.-C. Tao, H.-W. Xiang and Y.-W. Li, Catal. Commun., 2007, 8, 1957–1962 CrossRef CAS.
- Y. Zhang, L. Ma, J. Tu, T. Wang and X. Li, Appl. Catal., A, 2015, 499, 139–145 CrossRef CAS.
- H. M. Torres Galvis, J. H. Bitter, C. B. Khare, M. Ruitenbeek, A. I. Dugulan and K. P. de Jong, Science, 2012, 335, 835–838 CrossRef CAS PubMed.
Footnote |
| † Electronic supplementary information (ESI) available. See DOI: 10.1039/d0ra01036g |
| This journal is © The Royal Society of Chemistry 2020 |

