 Open Access Article
Facile control of surfactant lamellar phase transition and adsorption behavior†
Rui A. Gonçalves a,
Polina Naidjonokab,
Tommy Nylander
 b,
Maria G. Miguelc,
Björn Lindmanab and
Yeng Ming Lam
 *a
*a
aSchool of Materials Science and Engineering, Nanyang Technological University, 639798 Singapore, Singapore. E-mail: YMLam@ntu.edu.sg
bDivision of Physical Chemistry, Department of Chemistry, Centre for Chemistry and Chemical Engineering, Lund University, SE-221 00 Lund, Sweden
cDepartment of Chemistry, University of Coimbra, 3004-535 Coimbra, Portugal
First published on 11th May 2020
Abstract
This study sets out to investigate the effect of the presence of small water-soluble additives on the tunability of the surfactant gel-to-liquid crystalline (Lβ–Lα) phase transition temperature (Tm) for a bilayer-forming cationic surfactant and the phase behavior of such surfactant systems on dilution. This is strongly driven by the fact that this type of cationic surfactant has many interesting unanswered scientific questions and has found applications in various areas such as consumer care, the petrochemical industry, food science, etc. The underlying surfactant/additive interactions and the interfacial behavior of lamellar surfactant systems including the surfactant deposition on surfaces can provide new avenues to develop novel product formulations. We have examined dioctadecyldimethyl ammonium chloride (DODAC) in the presence of small polar additives, with respect to the phase behavior upon dilution and the deposition on silica. Differential scanning calorimetry (DSC) is used to track the transition temperature, Tm, and synchrotron and laboratory-based small and wide-angle X-ray scattering (SAXS and WAXS) were used to determine the self-assembled surfactant structure below and above the Tm. DSC scans showed that upon dilution the additives could be removed from the surfactant bilayer which in turn tuned the Tm. A spontaneous transition from a liquid crystalline (Lα) phase to a gel (Lβ) phase on dilution was demonstrated, which indicated that additives could be taken out from the Lα phase. By means of in situ null ellipsometry, the deposition of a diluted surfactant Lβ phase upon replacement of bulk solution by deionized water was followed. This technique enables time-resolved monitoring of the deposited surfactant layer thickness and adsorbed amount, which allows us to understand the deposition on surfaces. Robust layers at least one bilayer-thick were deposited onto the surface and shown to be irreversibly adsorbed due to poor surfactant solvency in water. The thickest layer of surfactant deposited after dilution was found for mixtures with small amounts of additive since high amounts might lead to a phase-separated system.
1. Introduction
The function of materials is often determined by their surface properties, i.e. where the material meets the surrounding medium. Deposition of a functional layer on a surface is, therefore, crucial for controlling material properties such as lubrication and protection against contamination. It is challenging to prepare molecularly thin layers, and in particular, with controlled thickness and surface properties for such studies. Amphiphilic molecules, such as surfactants and lipids, can adsorb from aqueous solution and deposit on hydrophobic and hydrophilic surfaces forming monomolecularly thin layers. Such layers are, however, not very stable when exposed to water or humid air since they are made from substances with a significant solubility in water. Stable layers can either be obtained by chemically coupling the molecules onto the surface or between the adsorbed molecules. One example where the former concept is used is in the case where molecules with thiol end groups are used to modify gold surfaces and this has led to the development of some important practical applications.1–3Another principle for the preparation of monomolecular layers is built on spreading insoluble amphiphilic compounds on the air–water interface. This monolayer can be transferred to solid surface passing through the interface. Multilayers can be obtained in this way by letting the solid surface pass through the water–air interface several times. This is the basis for the well-established Langmuir–Blodgett method.4
In hair conditioning the general principle is to render hair with net positive charges, creating an electrostatic repulsion. This can be achieved by either cationic surfactants or cationic polymers and both principles have been used successfully and are common in commercial hair conditioners. For the creation of robust layers in a simple procedure, however, alternatives to the indicated general principles have to be found.
The adsorption of soluble, low molecular weight substances is typically reversible, however polymers often display a more or less irreversible adsorption, especially for high molecular weight polymers. Charged polymers have a higher solubility in water and adsorb mainly when the surface is oppositely charged.5,6 This adsorption is effectively irreversible for higher molecular weight polymers. Polyelectrolyte adsorption has been thoroughly studied during recent decades and is exploited in many applications. For example, it is possible to charge up surfaces through adsorption and by using the irreversibility of adsorption also reverse the charge of a surface. A practical application of charging up surfaces is in conditioning (“two-in-one”) hair shampoo where a cationic polymer is deposited on hair from a mixed solution of an anionic surfactant and a cationic polymer. With an excess of surfactant, such a formulation is thermodynamically stable, and no adsorption onto hair occurs. However, on rinsing with water, the system falls into the two-phase region of the phase diagram and deposition occurs; further rinsing leads to removal of the surfactant whereas the polymer remains and this gives the substrate the desired positive charge and a conditioning effect. The mechanism is well understood from phase diagrams, and the deposition has been demonstrated in in situ adsorption studies using ellipsometry.7–12
Alternatively, surfactants can be used for hair conditioning. Normally cationic surfactants or different mixed systems are used.13 A good conditioning effect normally is based on achieving a layer of cationic surfactant in the lamellar gel (normally referred to as Lβ) state. Here the surfactant molecules are in a solid-like state whereby robust layers are formed, and desorption is slow because of very low solubility. Often cationic surfactants with two long alkyl chains are used. Problems with such formulations include the limited kinetic stability of the formulations and the difficulty in controlling the thickness of the deposited layers. In our previous work, we demonstrated the ability to tune the main phase transition temperature by using additives which are preferably located at the surfactant–water interface.14 Small polar molecules are known to be active in affecting the bilayer fluidity in biological systems. These systems also comprise double-chained amphiphiles, and the mechanisms will be the same for biological systems and surfactant systems.15–17 Also, hydrotrope molecules have been used in the formulation of personal care products, which make them favorable candidates to tune the phase behavior of surfactant mixtures.
The purpose of the present study was to reveal whether a well-defined layer of surfactant in the Lβ state could be achieved by a controlled phase transition from a stable surfactant phase, in particular, a lamellar liquid crystalline phase (Lα). For this purpose, we investigate whether addition of water-soluble components acting as co-surfactants can induce the required phase transition. Furthermore, in situ null ellipsometry studies were performed to determine the amount of surfactant deposited and the adsorbed layer thickness. We here show that ternary surfactant–additive–water mixtures in the lamellar liquid crystalline state can be designed in such a way that they are converted into the lamellar gel phase in excess of water. These are then deposited on surfaces in thin layers of well-defined thickness.
2. Experimental
2.1. Materials and sample preparation
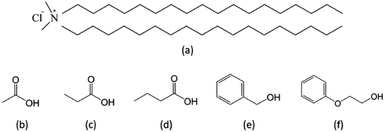
Dioctadecyldimethylammonium chloride (DODAC, 96.7% purity) was supplied by Evonik Corporation, USA. Acetic acid, propionic acid and butyric acid were purchased from Sigma-Aldrich, Singapore. Benzyl alcohol was supplied by Ineos Chlorotoluenes, Belgium, and phenoxyethanol supplied by Clariant Produkte GmbH, Germany. These compounds (Scheme 1) were used as received. Ultrapure water of 18 mΩ conductivity was used to prepare the samples (described as original samples). Binary DODAC–water and ternary DODAC–water–additive mixtures were prepared as described previously.14 Diluted samples were prepared by weighting a fraction of the original sample and diluting in a 1![[thin space (1/6-em)]](https://www.rsc.org/images/entities/char_2009.gif) :
:![[thin space (1/6-em)]](https://www.rsc.org/images/entities/char_2009.gif) 10 sample/water ratio, on a screw-cap glass vial. All the samples were equilibrated at room temperature for, at least, seven days before characterization.
10 sample/water ratio, on a screw-cap glass vial. All the samples were equilibrated at room temperature for, at least, seven days before characterization.
2.2. Differential scanning calorimetry
A discovery DSC differential scanning calorimeter (TA Instruments, USA) was used to determine the main phase transition temperature (Tm) under a heating/cooling cycle at of 2 °C min−1 from 10 to 60 °C, and back to 10 °C. The chamber was kept under a nitrogen environment. The software Trios (TA Instruments, USA) was used to calculate the enthalpy associated with the phase transition (ΔHm).2.3. Small and wide-angle X-ray scattering
SAXS and WAXS characterization was carried out using two X-ray source instruments. A simultaneous SAXS/WAXS laboratory instrument, Nano-inXider (Xenocs), equipped with a micro-focus source generating X-rays of a wavelength λ = 1.542 Å (Genix3D) operating at 50 kV and 0.6 mA was used to characterize the original mixtures. The small and wide-angle X-ray scattering beamline at the Australian Synchrotron operating with incident X-rays beam of a wavelength λ = 1.512 Å (8.2 keV beam) with a Pilatus 2M detector located at 7000 mm was used for SAXS. An incident X-rays beam of a wavelength λ = 0.827 Å (15 keV beam) with a Pilatus 2M detector located at 320 mm was used for WAXS. Fluid samples were loaded into thin-walled borosilicate capillaries (1.5 mm outer diameter, 0.01 mm wall thickness, Hampton Research) and mounted to a multi-capillary block connected to a water bath for thermal behavior studies. The system was calibrated using a AgBeh standard. Each sample was exposed to the beam for 600 seconds using the Nano-inXider, and 1 second at the synchrotron. The combination of SAXS and WAXS profiles allowed to characterize the surfactant mixtures. The resulting 2D scattering profiles were integrated to 1D background-corrected profiles using Foxtrot software (Xenocs) and ScatterBrain software (Australian Synchrotron).2.4. Surfactant adsorption on surfaces
The optical characteristics of silicon wafer, i.e. the refractive index of silicon as well as the thickness and refractive index of the silicon oxide layer, were determined in air and in deionized water as explained in detail by Tiberg and Landgren.18 In order to correct imperfections of the optical components, four-zone measurements at the beginning of each experiment were used.
The adsorption from additive/surfactant mixtures was initiated by injecting 0.5 mL of the stock solution into the trapezoid cuvette filled with 4.5 mL of deionized water. The solution in the cuvette was agitated with a magnetic bid rotating at about 300 rpm. The adsorption process was followed by recording the ellipsometric angles for approximately 3500 s, when steady-state was reached. The experiments were conducted at 25 °C ± 0.1 °C by circulating water from a thermostat bath through the cuvette holder. In the rinse experiments, the bulk solution initially in the cuvette was exchanged by flowing deionized water through the measurement cell by means of a peristaltic pump under a flow rate of 10 mL min−1.
The ellipsometer is used to measure the relative change in amplitude, Ψ, and phase shift, Δ, upon reflection of polarized light against a surface. In order to convert Ψ and Δ into layer thickness and refractive index, a four-layer optical model assuming an isotropic medium and planar surface was applied.19 From the obtained values of the thickness and refractive index, the adsorbed amount, Γ, was calculated using de Feijter's formula:20
| Γ = df(nf − n0)/(dn/dc) |
![[thin space (1/6-em)]](https://www.rsc.org/images/entities/char_2009.gif) :
:![[thin space (1/6-em)]](https://www.rsc.org/images/entities/char_2009.gif) 1
1![[thin space (1/6-em)]](https://www.rsc.org/images/entities/char_2009.gif) :
:![[thin space (1/6-em)]](https://www.rsc.org/images/entities/char_2009.gif) 5 by volume) of 25% NH4OH (pro analysis, Merck), 30% H2O2 (pro analysis, Merck) and H2O at 80 °C for 5 min, followed by cleaning in a boiling mixture (1
5 by volume) of 25% NH4OH (pro analysis, Merck), 30% H2O2 (pro analysis, Merck) and H2O at 80 °C for 5 min, followed by cleaning in a boiling mixture (1![[thin space (1/6-em)]](https://www.rsc.org/images/entities/char_2009.gif) :
:![[thin space (1/6-em)]](https://www.rsc.org/images/entities/char_2009.gif) 1
1![[thin space (1/6-em)]](https://www.rsc.org/images/entities/char_2009.gif) :
:![[thin space (1/6-em)]](https://www.rsc.org/images/entities/char_2009.gif) 5 by volume) of 32% HCl (pro analysis, Merck), 30% H2O2 (pro analysis, Merck) and H2O at 80 °C for 5 min. Then the slides were thoroughly rinsed with deionized water and ethanol and stored in absolute ethanol until use. Before use in the ellipsometry measurement, the substrate was dried with nitrogen and treated in a plasma cleaner (Harrick Scientific Corp., model PDC-3XG) for 5 min in air plasma at 0.02 mbar.
5 by volume) of 32% HCl (pro analysis, Merck), 30% H2O2 (pro analysis, Merck) and H2O at 80 °C for 5 min. Then the slides were thoroughly rinsed with deionized water and ethanol and stored in absolute ethanol until use. Before use in the ellipsometry measurement, the substrate was dried with nitrogen and treated in a plasma cleaner (Harrick Scientific Corp., model PDC-3XG) for 5 min in air plasma at 0.02 mbar.3. Results and discussion
3.1. Effects of the presence of an additive on the Tm
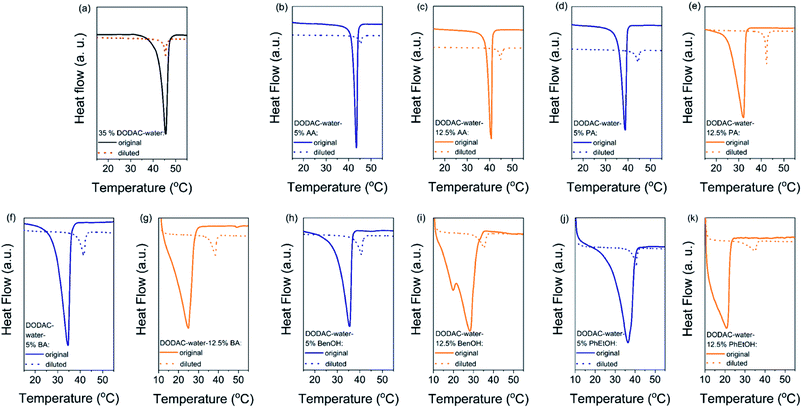
The gel-to-liquid crystalline (Lβ–Lα) phase transition temperature (Tm) and the enthalpy of phase transition (ΔHm) of the surfactant mixtures were determined by differential scanning calorimetry (DSC). The corresponding surfactant chain packing was determined by small and wide-angle X-ray scattering and will be discussed in the next section.Fig. 1 shows the DSC heating thermograms of the ternary surfactant–additive–water mixtures. Here we present the effect of three short-chain fatty acids (SCFAs): acetic, propionic and butyric acid; and two hydrotrope molecules: benzyl alcohol and phenoxyethanol on the thermal behavior of dioctadecyldimethylammonium chloride (DODAC) in water. The full lines represent the original samples without additive and with 5 (blue color) and 12.5 wt% (orange color) of additive, and the dotted lines correspond to the samples diluted with water. Only one thermal transition was detected for all the mixtures within the investigated temperature range (10 to 60 °C), for both the original sample as well as the same sample after dilution ten times with water. This suggests that with the dilution of the mixtures using water, the same types of self-assembled structures were maintained below and above the Tm, i.e. with the lamellar arrangement. The original and diluted samples therefore appear to be in a gel (Lβ) phase below the Tm, and in the liquid crystalline (Lα) phase above the respective Tm. The original samples with additive show a lowered Tm but on dilution with water a shift of the Tm to a higher temperature was observed for all the samples. For instance, Fig. 1(b) displays the thermal behavior of the DODAC in the presence of small amount (5 wt%) of acetic acid. A Tm of around 43.5 and 45.5 °C was found for the original sample and the diluted sample, respectively.
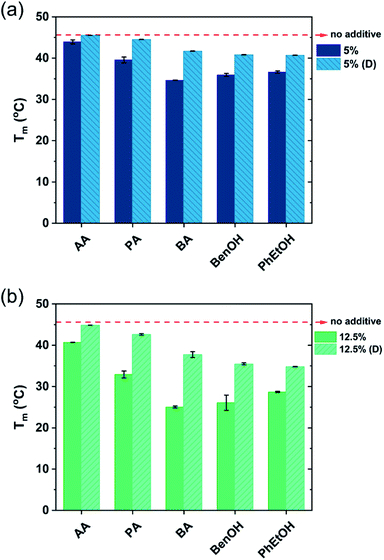
The shape of the endothermic peaks is similar for all the mixtures. This suggests that all additives affect the phase transition temperature via a similar mechanism and that they do not change the nature of the transition. However, the thermograms of the original samples of benzyl alcohol and phenoxyethanol, Fig. 1(h)–(k) full line, appear to be slightly different as they show a small plateau before the phase transition, which almost disappears with the larger amount (12.5 wt%) of additive in the mixture. At 12.5 wt%, the system contains a larger molar concentration of additive than of surfactant. At this high concentration of additive, the system containing benzyl alcohol results in a peak split, indicating the possible formation of an intermediate phase. The presence of these hydrotropes results in a significant decrease in the Lβ–Lα transition temperature (to 21 °C). Fig. 2 summarizes the Tm values obtained for aqueous mixtures of DODAC in the presence of small and large amounts of the three SCFAs and the two hydrotrope molecules. These results show that the presence of the cosolutes in the surfactant system facilitates the transition from bilayers in the “solid” state to a “melted” state. A longer hydrophobic moiety of the cosolute results in a more significant decrease in the Tm.
The results from the diluted samples show that the addition of water to the surfactant system shifts the Tm back to higher temperatures as seen in Fig. 2. This indicates that these additives can be removed from the bilayers by water addition, thus restoring the gel phase. The enthalpy of the phase transition per mole of DODAC for the diluted samples was quite similar, although slightly lower when compared to the values of the “original” samples as summarized in Table 1. This effect can be attributed to a residual amount of cosolute remaining in the bilayers. However, the enthalpy of phase transition of the diluted mixtures with butyric acid is higher than the original sample. Butyric acid is the least polar molecule of the studied series of additives. Therefore, this additive may partially remain at the surfactant–water interface reducing the electrostatic repulsion between surfactant head-groups.
![[thin space (1/6-em)]](https://www.rsc.org/images/entities/char_2009.gif) :
:![[thin space (1/6-em)]](https://www.rsc.org/images/entities/char_2009.gif) 10 sample/water ratio. AA-Acetic acid; PA-propionic acid; BA-butyric acid; BenOH-benzyl alcohol; PhEtOH-phenoxyethanol
10 sample/water ratio. AA-Acetic acid; PA-propionic acid; BA-butyric acid; BenOH-benzyl alcohol; PhEtOH-phenoxyethanol
| Additive (wt%) | ΔHm (kJ mol−1) | ||
|---|---|---|---|
| Original | Diluted | ||
| a Peak split that appears to indicate two thermal transitions, hence ΔHm could not be determined. | |||
| Acetic acid (AA) | 5.0 | 44.2 ± 0.7 | 34.6 ± 1.3 |
| 12.5 | 41.7 ± 1.9 | 39.8 ± 1.1 | |
| Propionic acid (PA) | 5.0 | 37.0 ± 0.1 | 32.4 ± 2.1 |
| 12.5 | 42.2 ± 1.3 | 34.3 ± 2.2 | |
| Butyric acid (BA) | 5.0 | 30.8 ± 0.7 | 33.6 ± 1.3 |
| 12.5 | 27.2 ± 1.4 | 28.7 ± 0.7 | |
| Benzyl alcohol (BenOH) | 5.0 | 33.9 ± 1.6 | 34.3 ± 4.3 |
| 12.5 | —a | 32.4 ± 0.7 | |
| Phenoxyethanol (PhEtOH) | 5.0 | 34.3 ± 1.2 | 34.9 ± 0.4 |
| 12.5 | 32.1 ± 5.6 | 37.0 ± 3.7 | |
The presence of SCFAs and hydrotropes in the lamellar structure helped to tune the Tm. Upon dilution, the relative stability of the lamellar gel phase increases and hence the Tm was shifted to higher temperatures.
3.2. Surfactant packing in the diluted regime
Small and wide-angle X-ray scattering (SAXS/WAXS) was used to determine the chain packing and structure of the diluted surfactant–additive mixtures at temperatures below and above the gel-to-liquid crystalline (Lβ–Lα) phase transition (Tm). The characteristic Bragg reflections with a peak ratio of 1![[thin space (1/6-em)]](https://www.rsc.org/images/entities/char_2009.gif) :
:![[thin space (1/6-em)]](https://www.rsc.org/images/entities/char_2009.gif) 2
2![[thin space (1/6-em)]](https://www.rsc.org/images/entities/char_2009.gif) :
:![[thin space (1/6-em)]](https://www.rsc.org/images/entities/char_2009.gif) 3… corresponding to lamellar structures were clearly observed in the small-angle regime. In addition, the wide-angle scattering profiles will give an indication on whether the alkyl chains of the bilayer are in a more solid-like or fluid-like state. For bilayers in the gel state (Lβ), a sharp peak at around 1.5 Å−1 is expected and this corresponds to the characteristic inter-acyl chain distance of 4.2 Å, whereas, for the fluid-like state (Lα), a shift to lower q values and a peak broadening is observed. Indeed the reflections in the wide-angle regime correspond to an inter-acyl chain distance of 4.1–4.2 Å for the Lβ phase, and ca. 4.5–4.6 Å for the Lα phase.23 The SAXS profiles of the original DODAC mixtures with short-chain fatty acids (SCFAs) and hydrotropes at temperatures below and above their Tm (ascertained by DSC)) were also recorded and the data confirms the lamellar structures, Fig. SI-1–SI-4 (ESI†). Additional features can be extracted from the SAXS and WAXS profiles, such as interlamellar d-spacing, polar layer thickness, non-polar layer thickness and the area per surfactant molecule as discussed in detail in our previous study.14
3… corresponding to lamellar structures were clearly observed in the small-angle regime. In addition, the wide-angle scattering profiles will give an indication on whether the alkyl chains of the bilayer are in a more solid-like or fluid-like state. For bilayers in the gel state (Lβ), a sharp peak at around 1.5 Å−1 is expected and this corresponds to the characteristic inter-acyl chain distance of 4.2 Å, whereas, for the fluid-like state (Lα), a shift to lower q values and a peak broadening is observed. Indeed the reflections in the wide-angle regime correspond to an inter-acyl chain distance of 4.1–4.2 Å for the Lβ phase, and ca. 4.5–4.6 Å for the Lα phase.23 The SAXS profiles of the original DODAC mixtures with short-chain fatty acids (SCFAs) and hydrotropes at temperatures below and above their Tm (ascertained by DSC)) were also recorded and the data confirms the lamellar structures, Fig. SI-1–SI-4 (ESI†). Additional features can be extracted from the SAXS and WAXS profiles, such as interlamellar d-spacing, polar layer thickness, non-polar layer thickness and the area per surfactant molecule as discussed in detail in our previous study.14
The surfactant mixtures were diluted ten times with water. These diluted mixtures display a rather thick water layer, and therefore they were characterized using synchrotron SAXS/WAXS beamline as the scattering is rather weak. The additive is expected to be at least partly removed from the water–DODAC interface. Indeed, after dilution the surfactant mixtures showed an increase in the Tm as discussed above. Thus, this suggests that the additives can be “washed away” from the mixed surfactant Lα phase, so that the DODAC gel phase is recovered. To verify this expected behavior, the alkyl chain packing was determined using WAXS data collected from synchrotron source, both below and above the transition temperature of these diluted mixtures.
The mixtures showed only one thermal transition under heating also after dilution of the sample (Fig. 1). As previously reported, it can be assumed that lamellar surfactant systems display a large osmotic swelling which results in thick water layers in the lamellar structure.23,24 Therefore, one may expect the same behavior for the DODAC–water–additive mixtures. Fig. 3 shows the SAXS and WAXS profiles of the diluted mixtures of DODAC in the presence 5 wt% of acetic acid at 20 and 55 °C. As identified in Fig. 3(a) and summarized in Table 2, the Bragg reflections follow an order of 1![[thin space (1/6-em)]](https://www.rsc.org/images/entities/char_2009.gif) :
:![[thin space (1/6-em)]](https://www.rsc.org/images/entities/char_2009.gif) 2
2![[thin space (1/6-em)]](https://www.rsc.org/images/entities/char_2009.gif) :
:![[thin space (1/6-em)]](https://www.rsc.org/images/entities/char_2009.gif) 3… which corresponds to a lamellar packing of the DODAC. At 20 °C, a sharp peak at 1.5285 Å−1, which corresponds to the hydrocarbon chains in the gel phase with an inter-acyl chain distance of 4.1 Å, is observed (Fig. 3(b)). This confirms that the system features an Lβ phase at 20 °C. The sharp Bragg peak in the WAXS data has disappeared at 55 °C and is replaced by a broad peak at lower q values, typically observed for bilayers in the fluid-like state. These results suggest that after dilution, the system does not lose its lamellar packing. This demonstrates the ability to tune the phase behavior of this surfactant system in the presence of additives by simple dilution. The original samples in the presence of additives display a lower Tm as compared to the sample in the absence of additives. The Lα phase in the presence of additives is thus relatively more stable for neat DODAC. The additive can be partially removed from the bilayers leading to a recovery of the Lβ phase and consequently increase the Tm simply by dilution of the mixture with water. The same trend was found for all the diluted mixtures in the presence of 5 and 12.5 wt% of propionic and butyric acid, benzyl alcohol and phenoxyethanol, Fig. SI-5–SI-9 (ESI†).
3… which corresponds to a lamellar packing of the DODAC. At 20 °C, a sharp peak at 1.5285 Å−1, which corresponds to the hydrocarbon chains in the gel phase with an inter-acyl chain distance of 4.1 Å, is observed (Fig. 3(b)). This confirms that the system features an Lβ phase at 20 °C. The sharp Bragg peak in the WAXS data has disappeared at 55 °C and is replaced by a broad peak at lower q values, typically observed for bilayers in the fluid-like state. These results suggest that after dilution, the system does not lose its lamellar packing. This demonstrates the ability to tune the phase behavior of this surfactant system in the presence of additives by simple dilution. The original samples in the presence of additives display a lower Tm as compared to the sample in the absence of additives. The Lα phase in the presence of additives is thus relatively more stable for neat DODAC. The additive can be partially removed from the bilayers leading to a recovery of the Lβ phase and consequently increase the Tm simply by dilution of the mixture with water. The same trend was found for all the diluted mixtures in the presence of 5 and 12.5 wt% of propionic and butyric acid, benzyl alcohol and phenoxyethanol, Fig. SI-5–SI-9 (ESI†).
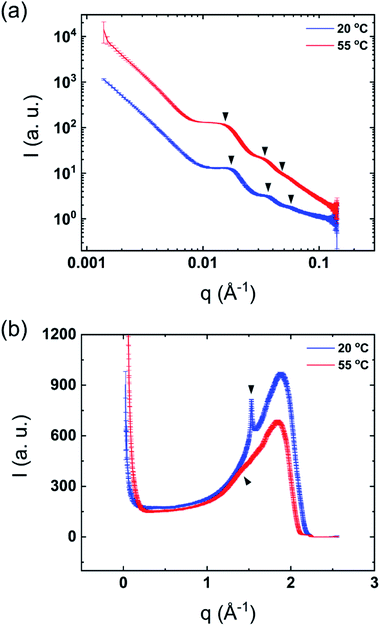 | ||
| Fig. 3 Synchrotron scattering profiles of diluted mixtures of 5 wt% acetic acid in DODAC–water at 20 °C (below Tm) and 55 °C (above Tm). (a) SAXS and (b) WAXS. | ||
| Temperature | |||
|---|---|---|---|
| 20 °C | 55 °C | ||
| SAXS | d100 (Å) | 359 | 403 |
| d200 (Å) | 176 | 201 | |
| d300 (Å) | 117 | 134 | |
| WAXS | Chain-to-chain (Å) | 4.1 | 4.4 |
| Phase | Lβ | Lα | |
3.3. Adsorbed amount and layer thickness upon rinsing
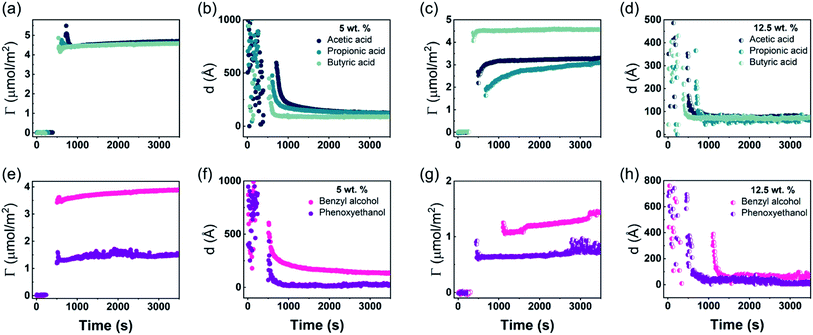
In situ, time-resolved adsorption measurements were conducted using aqueous dispersions of DODAC in the presence of three short-chain fatty acids (SCFAs): acetic acid, propionic acid, butyric acid; and two hydrotrope molecules: benzyl alcohol and phenoxyethanol. The average thickness and adsorbed amount are presented in Fig. 4 and 5. The adsorption/deposition process was performed in a two-cycle fashion, start/stop rinsing and repeat of rinsing, as illustrated in Scheme 2.
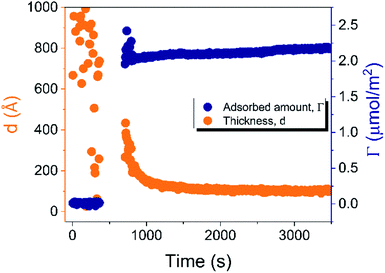 | ||
| Fig. 4 Time evolution of the adsorbed amount (Γ) and average layer thickness (d) of DODAC–water mixture at the silica/water interface (T = 25 °C). | ||
Before discussing the details of the results for the different conditions (presented below in Fig. 4–7) we make some general observations. One striking aspect is that throughout the deposition process of a surfactant layer on the substrate, the variation of both the adsorbed amount and the thickness of the adsorbed layers is rather limited in spite of large differences in the composition of the bulk surfactant phase. Once deposited, the values remain stable and do not vary over long times and do not change on dilution. This rather well defined behavior is striking in view of the non-equilibrium conditions of the experiments.
A stable plateau obtained for the values of Γ and d occur after ca. 1000 s, with the exception of the sample with 12.5 wt% of propionic acid, Fig. 5(c). The time required to reach steady-state conditions depends on factors such as turbidity of the sample, the bulk concentration, etc.18 Since ellipsometry is an optical technique, it requires a certain transparency of the medium. The turbid nature of the surfactant mixtures used here does not allow enough light to pass through the solution to follow the adsorption process. Nevertheless, seconds after the rinsing process started, the instrument resumed the data collection. Therefore, there is a gap in the data between the moment that the sample was injected (t = 300 s) and a few seconds after the rinsing started (t = 700 s). Once the solution was sufficiently clear, the amount of surfactant adsorbed was determined to be 2.13 μmol m−2, and the average layer thickness 107 Å. From the adsorbed amount, the area per surfactant molecule was determined to be 78 Å2. This result is consistent with the area per surfactant molecule of bulk DODAC–water mixtures determined using SAXS in our previous study.14
Table 3 summarizes the properties of the adsorbed layers from the diluted DODAC–water–additive mixtures. Since all the films onto the hydrophilic silica are deposited from a highly diluted medium they are expected to be in the gel phase at 25 °C as demonstrated by the DSC and WAXS results. After the deposition on the surface, two cycles of rinsing were conducted, with no desorption being observed. The driving force for the formation of the surfactant film is mainly due to the inherent insolubility of DODAC in water but there is also an electrostatic attraction of the cationic surfactant to the negatively charged surface. The composition of the formed surfactant layer cannot be determined using ellipsometry, hence we can only evaluate the data in terms of the total amount deposited and the thickness of the formed layer. In the corresponding bulk sample, the DODAC bilayer was determined to be 28 Å-thick (using X-rays). This bilayer is rather thin when compared to the expected total thickness of two monolayers formed by an 18 carbon-chain oriented perpendicular to the interface. Such a small thickness value can be explained by the formation of a tilted and interdigitated DODAC bilayer in the gel phase.14
| Diluted sample | Adsorbed amount, Γ (μmol m−2) | Average thickness, d (Å) | Area per molecule, a (Å2) | pH | |
|---|---|---|---|---|---|
| a Large scattering observed.b Result from the plateau in the steady-state. | |||||
| No additive | 2.13 ± 0.04 | 107 ± 7 | 78 | 6.16 | |
| Small amount | 5% acetic acid | 4.71 ± 0.05 | 124 ± 7 | 35 | 2.99 |
| 5% propionic acid | 4.54 ± 0.04 | 136 ± 13 | 37 | 3.10 | |
| 5% butyric acid | 4.53 ± 0.04 | 89 ± 2 | 37 | 3.14 | |
| 5% benzyl alcohol | 3.84 ± 0.04 | 144 ± 8 | 43 | 4.43 | |
| 5% phenoxyethanol | 1.48a ± 0.03 | 26 ± 5 | 112 | 7.22 | |
| Large amount | 12.5% acetic acid | 3.22 ± 0.03 | 76 ± 3 | 52 | 2.77 |
| 12.5% propionic acid | 2.91 ± 0.19 | 63 ± 2 | 57 | 2.84 | |
| 12.5% butyric acid | 4.55 ± 0.02 | 72 ± 3 | 36 | 2.82 | |
| 12.5% benzyl alcohol | 1.81b ± 0.01 | 62 ± 7 | 92 | 3.89 | |
| 12.5% phenoxyethanol | 0.73 ± 0.06 | 38 ± 10 | — | 6.76 | |
The mixtures with a small amount of short-chain fatty acid gave a larger adsorbed amount than the corresponding mixtures with an excess of short-chain fatty acid, except for the mixture with an excess of butyric acid. The same trend was found for the average film thickness. In line with previous results for polyelectrolyte–surfactant mixtures deposition increases when rinsing starts closer to the phase border.9 On rinsing, a residual amount of SCFAs remains in the bilayers, which reduced the electrostatic repulsion between DODAC molecules, thus resulting in larger adsorbed amounts, and consequently, a smaller area per surfactant molecule.
The mixture with high concentration of benzyl alcohol was rather opaque, therefore it took a long time to resume ellipsometry data collection after the rinsing process had started, Fig. 5(g). Furthermore, three steady-state plateaus are identified during successive rinsing cycles, which feature an increase of the adsorbed amount with each rinsing step. This suggests that as benzyl alcohol is removed gradually, more DODAC deposited at each step. For all the other mixtures, the additive was “washed away” immediately during the first rinsing cycle. This evidence highlights the DODAC solvency effect as the driving force for surfactant adsorption onto silica.
For all the investigated additives, robust layers with a thickness of at least twice the length of the surfactant molecules are seen to be irreversibly deposited on hydrophilic silica.
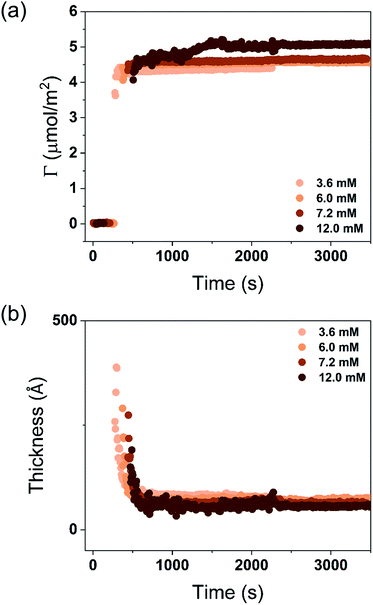
The turbidity of the mixtures increased with concentration in the order C1 < C2 < C3 < C4, which is noticeable in Fig. 6. After the rinsing process started, only 158 seconds were needed to resume the data collection for the C1 mixture, whereas extra time was needed for the mixtures with high concentrations. The C4 mixture profile shows a considerably higher level of scattering when compared to the lower concentration samples, and stabilized at a steady-state plateau only around 2400 s. This suggests that a more homogeneous layer of surfactant at low concentration was formed.
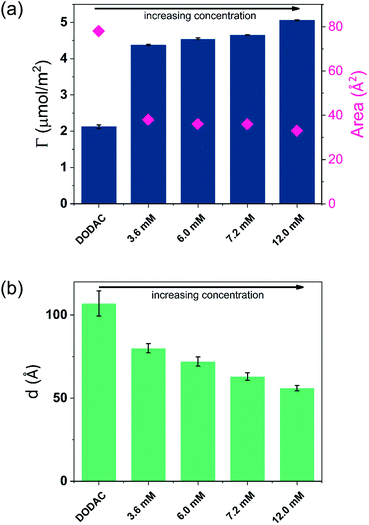
Though the adsorbed amount is higher and the adsorbed layer thinner in the presence of butyric acid than for the surfactant alone there is only a moderate variation of the deposition data with the concentration, Fig. 7. There is a slight increase of the adsorbed amount with the concentration. The origin of this effect is not clear but as discussed previously, the presence of SCFAs contributes to shield the electrostatic repulsion between DODAC head groups, which might enhance the amount of surfactant adsorbed on the substrate. As a result, the area per surfactant molecule was determined to decrease when compared to the mixture in the absence of SCFAs. The mixture C4 resulted in a slightly larger adsorbed amount of DODAC and smaller area per molecule, and the deposited layer from this mixture took longer time to reach steady-state values. It is noteworthy that the adsorbed amounts from mixtures with increasing concentration appear to be the same. More importantly, from the first and second columns in Fig. 7(a), the results suggest that butyric acid facilitates the deposition of robust and homogeneous layers of DODAC onto hydrophilic silica, even for the lowest concentration studied. The deposited layer of DODAC in the presence of butyric acid (from 56 to 89 Å) was slightly thinner compared to the deposited layer in the absence of additive (107 Å).
In the previous section, we have shown that thicker layers of DODAC were deposited when the additive was present in small amount (5 wt%), and the larger amount of additive (12.5 wt%) lead to a deposition of thinner layers of surfactant. The mixtures C1, C2, C3 and C4 are in the presence of larger concentration of butyric acid giving slightly thinner deposited layers of surfactant. Whereas there are some differences, a main finding is that well-defined layers are deposited and have a thickness slightly above the double length of the surfactant molecule.
4. Conclusion
The double-chain cationic surfactant, DODAC, has very low solubility in water but a large tendency to form stacked bilayer (lamellar) structures swelling with water. At low temperatures, a gel phase, Lβ, is formed with the surfactant molecules in a solid-like state whereas above a well-defined transition temperature, Tm, a liquid crystalline phase, Lα, is formed. As described in this work, a number of low molecular weight water-soluble compounds can lower the transition temperature substantially. Interestingly, on diluting samples of surfactant, additive and water, there is a spontaneous transition from the Lα to the Lβ phase, ascribed to the dissociation of additive from the bilayers. Surfactants of the type studied have important applications for surface modification, like in hair conditioning. This is based on covering the substrate with the Lβ phase. One problem in applications is to form stable formulations of the surfactant, the formulation typically consisting of kinetically stable dispersed particles of the Lβ phase. The Lα phase, on the other hand, is thermodynamically stable over wide ranges and easier to formulate. One purpose of the present work was to investigate if stable samples of the Lα phase can spontaneously be changed into the Lβ phase and subsequently deposited on a substrate. This was achieved via lowering the Tm using a water-soluble additive. On dilution, it is washed away, and the composition of the surfactant bilayer changed so that Tm is raised and a gel structure is formed. The WAXS results show that a sharp crystalline peak appears on dilution and that the chain-to-chain distance decreases, thus demonstrating the formation of a gel phase. Ellipsometry studies demonstrate that dilution of the surfactant–additive–water phases lead to the deposition of well-defined robust layers on a substrate. The adsorbed surfactant layers have a thickness of the order of the double surfactant molecule length and are stable and not affected by extensive dilution.Conflicts of interest
There are no conflicts to declare.Acknowledgements
The authors acknowledge useful discussions on SAXS and WAXS data fitting with Dr Pio Buenconsejo and financial support from Agency for Science, Technology and Research (A*STAR), Singapore (APG2013/016). Part of this research was undertaken on the SAXS and WAXS beamline (ID: M14264) at the Australian Synchrotron, part of ANSTO, and also at the Facility for Analysis, Characterisation, Testing and Simulation (FACTS) in Nanyang Technological University, Singapore.References
- R. G. Nuzzo and D. L. Allara, J. Am. Chem. Soc., 1983, 105, 4481–4483 CrossRef CAS.
- E. B. Troughton, C. D. Bain, G. M. Whitesides, R. G. Nuzzo, D. L. Allara and M. D. Porter, Langmuir, 1988, 4, 365–385 CrossRef CAS.
- C. D. Bain, E. B. Troughton, Y. T. Tao, J. Evall, G. M. Whitesides and R. G. Nuzzo, J. Am. Chem. Soc., 1989, 111, 321–335 CrossRef CAS.
- I. R. Peterson, J. Phys. D: Appl. Phys., 1990, 23, 379–395 CrossRef CAS.
- B. Lindman, B. Medronho, L. Alves, C. Costa, H. Edlund and M. Norgren, Phys. Chem. Chem. Phys., 2017, 19, 23704–23718 RSC.
- T. Nylander, Y. Samoshina and B. Lindman, Adv. Colloid Interface Sci., 2006, 123, 105–123 CrossRef PubMed.
- E. Terada, Y. Samoshina, T. Nylander and B. Lindman, Langmuir, 2004, 20, 1753–1762 CrossRef CAS.
- E. Terada, Y. Samoshina, T. Nylander and B. Lindman, Langmuir, 2004, 20, 6692–6701 CrossRef CAS PubMed.
- A. V. Svensson, L. Huang, E. S. Johnson, T. Nylander and L. Piculell, ACS Appl. Mater. Interfaces, 2009, 1, 2431–2442 CrossRef CAS PubMed.
- O. Santos, E. S. Johnson, T. Nylander, R. K. Panandiker, M. R. Sivik and L. Piculell, Langmuir, 2010, 26, 9357–9367 CrossRef CAS PubMed.
- A. V. Svensson, E. S. Johnson, T. Nylander and L. Piculell, ACS Appl. Mater. Interfaces, 2010, 2, 143–156 CrossRef CAS.
- M. Clauzel, E. S. Johnson, T. Nylander, R. K. Panandiker, M. R. Sivik and L. Piculell, ACS Appl. Mater. Interfaces, 2011, 3, 2451–2462 CrossRef CAS PubMed.
- M. Kodama, M. Kuwabara and S. Seki, Thermochim. Acta, 1981, 50, 81–91 CrossRef CAS.
- R. A. Gonçalves, B. Lindman, M. G. Miguel, T. Iwata and Y. M. Lam, J. Colloid Interface Sci., 2018, 528, 400–409 CrossRef PubMed.
- S. Bjorklund, J. M. Andersson, Q. D. Pham, A. Nowacka, D. Topgaard and E. Sparr, Soft Matter, 2014, 10, 4535–4546 RSC.
- E. Sparr and H. Wennerstrom, Curr. Opin. Colloid Interface Sci., 2011, 16, 561–567 CrossRef CAS.
- J. Guo, J. C. S. Ho, H. Chin, A. E. Mark, C. Zhou, S. Kjelleberg, B. Liedberg, A. N. Parikh, N.-J. Cho, J. Hinks, Y. Mu and T. Seviour, Phys. Chem. Chem. Phys., 2019, 21, 11903–11915 RSC.
- F. Tiberg and M. Landgren, Langmuir, 1993, 9, 927–932 CrossRef CAS.
- R. M. A. Azzam and N. M. Bashara, Ellipsometry and polarized light, North-Holland Pub. Co., Amsterdam, New York, 1977, sole distributors for the U.S.A. and Canada, Elsevier North-Holland, 1977 Search PubMed.
- J. A. De Feijter, J. Benjamins and F. A. Veer, Biopolymers, 1978, 17, 1759–1772 CrossRef CAS.
- A. Theisen, Refractive Increment Data-book for Polymer and Biomolecular Scientists, Nottingham University Press, 2000 Search PubMed.
- T. Tumolo, L. Angnes and M. S. Baptista, Anal. Biochem., 2004, 333, 273–279 CrossRef CAS PubMed.
- D. F. Evans and H. Wennerström, The colloidal domain : where physics, chemistry, biology, and technology meet, Wiley-VCH, New York, 2nd edn, 1999 Search PubMed.
- E. F. Marques and B. F. B. Silva, in Encyclopedia of Colloid and Interface Science, ed. T. Tadros, Springer Berlin Heidelberg, Berlin, Heidelberg, 2013, pp. 1202–1241, DOI:10.1007/978-3-642-20665-8_169.
- R. A. Demel and B. De Kruyff, Biochim. Biophys. Acta, Rev. Biomembr., 1976, 457, 109–132 CrossRef CAS.
- J. R. Usher, R. M. Epand and D. Papahadjopoulos, Chem. Phys. Lipids, 1978, 22, 245–253 CrossRef CAS PubMed.
- R. N. McElhaney, Chem. Phys. Lipids, 1982, 30, 229–259 CrossRef CAS PubMed.
- K. Tonigold, I. Varga, T. Nylander and R. A. Campbell, Langmuir, 2009, 25, 4036–4046 CrossRef CAS PubMed.
Footnote |
| † Electronic supplementary information (ESI) available. See DOI: 10.1039/d0ra01340d |
| This journal is © The Royal Society of Chemistry 2020 |

