 Open Access Article
Analytical methods for the determination of oil carryover from CNG/biomethane refueling stations recovered in a solvent
Karine Arrhenius *a,
Andreas Fischera,
Oliver Büker
 a,
Hervé Adrienb,
Ahmad El Masrib,
Francois Lestremaub and
Tim Robinsonc
aResearch Institutes of Sweden (RISE), Brinellgatan 4, 50462 Borås, Sweden. E-mail: karine.arrhenius@ri.se
bINERIS, Parc Alata, 60550 Verneuil en Halatte, France
cWaverton Analytics Ltd, Emerton Building, Barony Road, Nantwich, Cheshire CW5 5QS, UK
First published on 24th March 2020
Abstract
Vehicle gas is often compressed to about 200 bar at the refueling station prior to charging to the vehicle's tank. If a high amount of oil is carried over to the gas, it may cause damage to the vehicles; it is therefore necessary to accurately measure oil carryover. In this paper, three analytical methods for accurate quantification of the oil content are presented whereby two methods are based on gas chromatography and one on FTIR. To better evaluate the level of complexity of the matrix, 10 different compressor oils in use at different refueling stations were initially collected and analysed with GC and FTIR to identify their analytical traces. The GC traces could be divided into three different profiles: oils exhibiting some well resolved peaks, oils exhibiting globally unresolved peaks with some dominant peaks on top of the hump and oils exhibiting globally unresolved peaks. After selection of three oils; one oil from each type, the three methods were evaluated with regards to the detection and quantification limits, the working range, precision, trueness and robustness. The evaluation of the three measurement methods demonstrated that any of these three methods presented were suitable for the quantification of compressor oil for samples. The FTIR method and the GC/MS method both resulted in measurement uncertainties close to 20% rel. while the GC/FID method resulted in a higher measurement uncertainty (U = 30% rel.).
1. Introduction
Biomethane is a renewable fuel produced through upgrading of biogas and syngas.1 Due to the negative environmental impact caused by fossil fuels usage, the production of biomethane worldwide increases rapidly. There will soon be more than 1000 biomethane production plants operating in more than 30 countries and producing 3 billion m3.2 The benefits of using biomethane as a transport fuel are numerous. Biomethane/natural gas has a large energy content, supports reaching a low carbon economy and therefore plays an important role in reducing carbon dioxide emissions. This gas is suitable for all types of engines and transport modes.3 Biomethane offers larger environmental benefits than natural gas. The biomethane produced is mainly fed into the local natural gas grids; grid injection is in practice in at least 10 European States. Vehicle gas is often compressed to about 200 bar at the refueling station prior to charging to the vehicle's tank.Depending on the oil types, the compressors design, the operating conditions, the maintenance operated at the stations and the presence or absence of filtration devices, a more or less large amount of oil can be entrained into the gas fuelled to vehicles and buses. Small amounts of oil present in the gas are beneficial; Compressed Natural Gas (CNG)/biomethane is a very dry fuel and some oil carryover is necessary to provide lubrification for certain engine parts. It has however been showed that a high level of oil dissolved in the gas can damage the vehicles if it deposits in the gas vehicles tanks and fueling systems. Onboard a CNG vehicle, the pressure is reduced to 7 bar. Under these conditions, oil dissolved in the gas may condense and soak the pressure regulator diaphragm. This will affect its accuracy, slow its response and in some cases, cause a rupture of the regulator internals if oil clogs the regulator. The most sensitive part is the engine itself due to the presence of sensors which are extremely sensitive to any contamination.4 Oil is carried by the compressed gas in two forms: as an aerosol which is formed by the mechanical shearing in the compressor and as a vapor which is formed during oil vaporisation and absorption in the gas.
The use of coalescing filters to remove liquids and aerosols from gases is a well-known, reliable and proven technology for reducing or even practically removing oil aerosol carryover. Coalescence is a steady-state process in which large droplets are created from smaller droplets and aerosols.5,6 The gas passes through a fibre media cartridge. Aerosol droplets are forced through the coalescing media from the inside of the cartridge tube to the outside walls. The increased mass of the droplets causes them to fall by gravity from the cartridge into a low velocity area in the bottom of the coalescer housing where oil accumulates until purged.
But compressed gas exiting lubricated compressors also carries oil as a vapor. This oil cannot be removed by coalescing filters unless pressure and/or temperature decreases, causing the vaporised oil to condense and form a very fine aerosol. Oil vapours can however be removed by adsorption on activated carbon, alumina or similar adsorbents.
Several methods have been developed for measuring oil carryover in gas. Their complexity depends often on whether it is necessary to measure oil as vapor and oil as aerosol separately or not. Several of these methods are gravimetric methods and do not allow measuring oil vapor and oil aerosol separately. Oil content is determined by the flow passing over a device equipped with a filter and the weight difference of the filter before and after sampling (after heating to remove water).7,8 The method developed by AGL (Atlanta Gas Light)9 uses a gravimetric collection device for oil in which a tube filled with an adsorbent is connected to a high-pressure line. A gravimetric method to determine oil and particle content was also developed by DVGW (The German Technical and Scientific Association for Gas and Water).10 It consisted of a filter system in the high-pressure side and a gas sampling device on the low-pressure side. Temperature, pressure and pressure drop through the filter were measured continuously. The sampling equipment included a gas tank allowing sampling even without having access to a gas vehicle.
Several methods use coalescing filters. For example, the method developed by IGT (Institute of Gas Technology)9 comprises a high pressure and a low-pressure sample line, each sample line being equipped with a highly efficient coalescing filter. The oil as aerosol will adsorb on the high-pressure device while the oil as vapor will pass through. Thereafter, the pressure and temperature are lowered down to atmospheric pressure and −45 °C and the oil as vapor condense and become an aerosol adsorbing in the low-pressure device. Even through the method have shown to provide reliable results, it is not possible to adapt to onsite measurements because of its complexity.
However, in the same study,9 this method has been compared to the AGL gravimetric method described above. At low levels of oil carryover, the gravimetric method was found to overestimate the oil carryover probably due to the fact that a part of the increase of weight was not only due to oil. It may be caused by heavier hydrocarbons naturally present in natural gas. At higher level of oil carryover, the gravimetric method was found to underestimate oil carryover showing that this device is probably less effective in capturing oil vapours than the cryotrap/coalescing filter used in the method of reference (IGT).
Based on a similar principle that the method developed by IGT, RISE developed a portable sampler equipped with coalescing filters for onsite sampling.11–13 The sampler is described in detail elsewhere.11
Once a buffer tank has been filled at the pressure delivered at the station, a small part of the gas collected in the buffer tank is released through the chimney by opening a ball valve until the pressure in the tank reached 180 bar. This pressure has been chosen as it supposedly can be achieved in all stations even the ones working at slightly lower pressures than average. 1 Nm3 of the remaining gas in the buffer tank is then led through a hole located just before two coalescing filters mounted in series by opening two other ball valves. As the gas passes first through the hole, the pressure drops, resulting in a temperature drop and the oil is trapped on the filter. The second filter is used as control to check that oil has been quantitatively absorbed on the first filter.
The oil absorbed on the filters is then extracted to a solvent, preferably dichloromethane, and quantified using an appropriate analytical method. The buffer tank is then completely emptied and eventual oil that has condensed inside the buffer tank need to be removed by washing the buffer tank with for example pentane. Both fractions (dichloromethane and pentane fractions) must be analysed with regards to their oil content with an appropriate analytical method.
In this paper, three analytical methods for accurate quantification of the oil content are presented whereby two methods are based on gas chromatography and one on FTIR.
As discussed in literature,14 oils are generally composed of many compounds including saturated hydrocarbons that cannot be fully separated from each other with gas chromatography. With classical gas chromatographic techniques, it is not possible/practical to analyse individual components in such complex matrices, so the overall fingerprint/profile needs to be considered. This in turn implies a series of analytical challenges, mostly regarding selectivity and limit of detection. In the case of oil carryover, it is important to ensure the correct identification of eventual oil found in the gas as in some stations, several compressor oils are in use. The selectivity of a GC-system refers to its capacity to retain targeted components to a significantly greater or lower extent than other components. In other words, the GC-method shall be optimized to avoid coelution of the target compound with another component which also can be present in the sample to analyse (optimization of the temperature program of the column, the flow…). However, due to the complexity of the oils, the selectivity using only GC will be poor. Moreover, at very low concentrations, it may become difficult to distinguish between oil and the non-evitable background level of the instrument.
Some analytical techniques such as dimensional gas chromatography15 or high-resolution mass spectrometry16,17 have been applied to increase selectivity of complex matrices. However, these advance instrumentations are not common in laboratories. Therefore, in this study, we only consider classical analytical methods such as GC/FID, GC/MS or FTIR.
To better evaluate the level of complexity of the matrix, 10 different compressor oils in use at different refueling stations were collected after discussion with stakeholders in Sweden. The oils were analysed with GC and FTIR to identify their analytical traces. Their GC traces were mostly dominated by a large hump (also called unresolved complex mixture) with in some cases few resolved peaks. The GC traces could however be divided into three different profiles: oils exhibiting some well resolved peaks, oils exhibiting globally unresolved peaks with some dominant peaks on top of the hump and oils globally unresolved in GC.
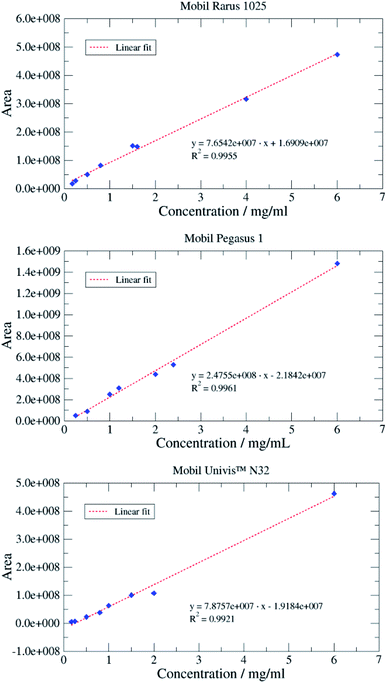
The FTIR and GC methods presented here have then been validated for the following parameters for three different oils; one from each different GC-profile types. The range of calibration standards; from 0.1 mg mL−1 to 5–6 mg mL−1 intended to cover oil carryover ranging from the low mg kg−1 (which is, in most cases, an acceptable level of carryover) up to almost 100 mg kg−1 (very high carryover indicating troubleshooting at the station). The following parameters were discussed: detection limits, working range, precision, trueness. Finally, measurement uncertainties were calculated.
2. Experimental
2.1 Chemicals
In this study, the three different oil brands used were Mobil Rarus SHC 1025,18 Mobil Univis™ N 32 (ref. 19) which is a hydraulic oil and Mobil Pegasus 1 (ref. 20) which is a synthetic gas engine oil. The samples were collected from three compressor stations using these oils. All the tests were performed from the same batch. The key characteristics of the compressor oils are listed in Table 1.All solvents were HPLC grade and purchased from Sigma Aldrich (St. Louis, Mo., USA).
2.2 GC/MS method
Oils were analysed by GC/MS (Gas Chromatography/Mass Spectrometry) after dilution in dichloromethane. The analyses of the oil solutions were performed on a gas chromatograph coupled with a mass spectrometer. The gas chromatograph (Agilent, 6890N) was equipped with a split/splitless injector (injector temperature 325 °C) and one fused-silica capillary column (HP-5MS Phenyl Methyl Siloxane, 30 m, 0.25 mm i.d., 0.25 μm film, Agilent Technologies). The initial oven temperature was 80 °C (hold 2 min). The temperature was then raised with a ramp rate of 12 °C min−1 up to 325 °C (hold 15 min); for the mass spectrometer detector (Agilent, 5975) the ion source temperature was set to 230 °C. The MS was operated in the electron impact (EI) ionization mode at 70 eV. When quantifying with the MS, two modes were used; the Total Ion Chromatogram (TIC) mode which represents the summed intensity across the entire range of masses being detected (in this case from m/z 29 to m/z 430) or an Selected Ion Chromatogram (SIC) mode where one m/z value characteristic for targeted compounds is recovered from the entire data set. For calibration, standard solutions with different levels of concentration from 0.2 to 6 mg mL−1 were prepared for each oil in dichloromethane.2.3 GC/FID method
Oils were analysed by GC/FID (Gas Chromatography/Flame Ionisation Detector) after dilution in hexane. The gas chromatograph (Varian, CP3800) was equipped with a PTV (Programmed Temperature Vaporizer) injector (Varian 1079) (injector temperature 50 °C for 0.1 min and then programmed to 320 °C, the injections were performed in splitless mode, injection volume: 1 μL) and a fused-silica capillary column (Rxi-5ms, 30 m, 0.25 mm i.d., 0.25 μm film, from Restek). The temperature program of the GC oven was programmed from 40 °C for 5 min and then increased at 10 °C min−1 to 300 °C (hold 20 min). The temperature of the detector was fixed at 300 °C.For calibration, six standard solutions with different levels of concentration from 0.2 to 6 mg mL−1 were prepared in n-hexane. The standard solutions used for the calibration curve were a mixture of three selected oils in equal proportions. In order to verify that the analytical system had correctly performed the injection, a known amount of n-decane was spiked in each standard solution. These standard solutions were used for the evaluation of the working range and the limit of quantification.
2.4 DI/FTIR method
The target oils were analysed by direct injection (DI) into the gas cell of a Fourier Transform InfraRed spectrometer (FTIR) (MAX Analytical Technologies “Crossmark” prototype). The FTIR gas cell was of a continuous flow “light pipe” type, with 10 cm pathlength and 1.6 mL internal volume. The gas cell was thermally insulated and maintained at a temperature of 300 °C. The spectrometer incorporated a Deuterated Triglycine Sulphate (DTGS) detector and spectra were obtained at 4 cm−1 resolution and at a rate of 2.5 seconds per scan.3. Field samples
The sampling method has been used in the field at several stations in Sweden using different oils. These tests demonstrated in all cases that the composition of the base oil was not significantly altered as there were no significant differences between the composition of the field samples and the calibration samples (unused oil) as it can be shown on Fig. 1 (Fig. 1a SIC (m/z 57) of a 3 mg mL−1 solution of unused oil, and Fig. 1b SIC (m/z 57) of the dichloromethane extract of a filter sampled at a station; the oil used at the station was Mobil Pegasus 1). Thereby, these tests confirmed that calibrating analytical instruments with solutions of unused oils collected at the station was relevant.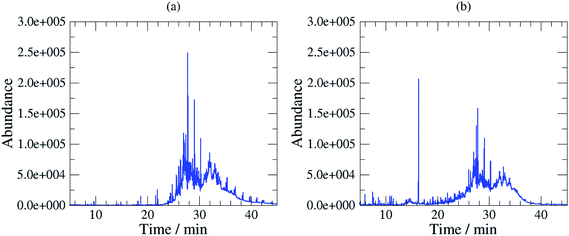 | ||
| Fig. 1 (a) SIC (m/z 57) of a calibration standard (3 mg unused oil per mL in dichloromethane), (b) SIC (m/z 57) of the dichloromethane extract of a filter sampled at a station. | ||
4. Results and discussions
The method validations in this study were performed according to the Eurachem guide “The Fitness for purpose of analytical methods”.21 Several parameters considered as performance characteristics were evaluated: selectivity, limit of detection (LOD) and limit of quantification (LOQ), working range, trueness (bias, recovery), precision (repeatability, intermediate precision and reproducibility) and robustness. The evaluation of these parameters was then used to calculate the measurement uncertainty. In FTIR, characteristic peaks were observed in the region from 2785 to 3050 cm−1 where the fundamental C–H stretching vibrations occur for aliphatic hydrocarbons. However, oils profiles showed some differences in the fingerprint region (650 to 1800 cm−1) that could be used to improve the selectivity. One oil for each GC type of profiles was then chosen to validate the analytical methods. To our knowledge, this study is the first study with a complete validation of analytical methods intended to estimate oil carryover at CNG/biomethane compressor stations.4.1 Validation of the GC/MS method
The selectivity of the MS-system is due to the fact that the detector gives structural information (i.e. a mass spectrum for each compound separated by GC). Compounds can be identified by comparing their mass spectrum to a database of mass spectra or if not present in the database, to pure substances.
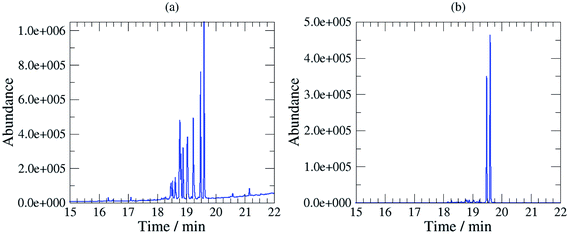
Chromatographically, the three selected oils exhibited different characteristic profiles. The chromatogram of Mobil Rarus SHC 1025 consists of relatively well separated peaks (Fig. 2a).
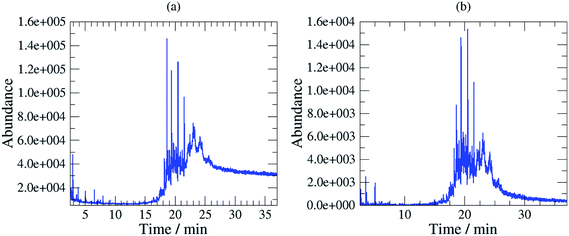
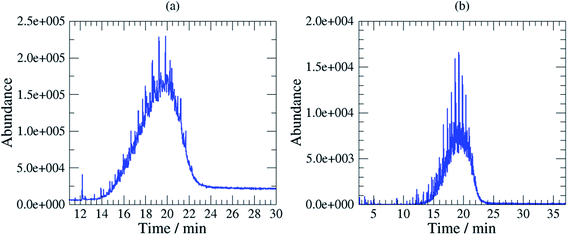
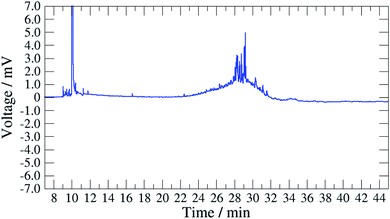
Mobil Pegasus 1 and Mobil Univis™ N32 were complex mixtures comprising many compounds including hydrocarbons and additives that were unresolvable in gas chromatography, however some GC-peaks (hydrocarbons) were clearly dominant (partially resolved) when analysing Mobil Pegasus 1 (Fig. 3a) and these peaks could be used for quantification whereas Mobil Univis™ N32 (Fig. 4a), compounds were globally not resolved in gas chromatography. For Mobil Pegasus 1, calculating the area ratio of the peaks used for quantification can help in the identification of the oil; for concentrations 0.5, 1, 3 and 6 mg mL−1, the area ratio of peaks at 21.4 min and 20.4 min was close to 4.8 ± 0.2. However, at the lower concentration of 0.1 mg mL−1, the area ratio was significantly different (5.5) probably to the interferences due to the background. The area ratio of peaks at 21.4 min and 19.3 min was close to 2.7 ± 0.2 at all tested concentrations.
To increase selectivity, some characteristic ions were selected for each oil: m/z 155 for Rarus 1025 and m/z 57 for Mobil Pegasus 1 and Mobil Univis™ N32. The m/z 155 chromatogram exhibited then two well separated peaks for Mobil Rarus 1025 (Fig. 2b). For the two other oils, the m/z 57 chromatogram exhibited peaks with an increased distinguishability from the hump (Fig. 3b and 4b).
For the DI/FTIR method, it was decided that it would be appropriate to identify a suitable surrogate compound that would have similar characteristics to the oils and oil mixtures that might be encountered. Moreover, a universal calibration reference would simplify the significant challenge of identifying a specific oil type or oil mixture, before applying the appropriate reference calibration from a series of calibration spectra.
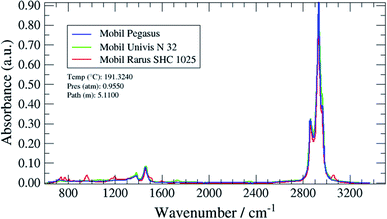
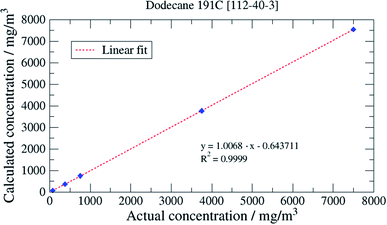
Spectra were acquired for each of the original set of 10 selected oils and comparisons made by calculating a “goodness of fit” between the normalised spectra for these oils and a series of pure aliphatic hydrocarbon spectra. As a result of this comparison, dodecane was selected as the hydrocarbon offering the closest match and a series of direct injection, recovery studies were used to confirm this choice.
![[thin space (1/6-em)]](https://www.rsc.org/images/entities/char_2009.gif) :
:![[thin space (1/6-em)]](https://www.rsc.org/images/entities/char_2009.gif) 1 for the LOD and to 10
1 for the LOD and to 10![[thin space (1/6-em)]](https://www.rsc.org/images/entities/char_2009.gif) :
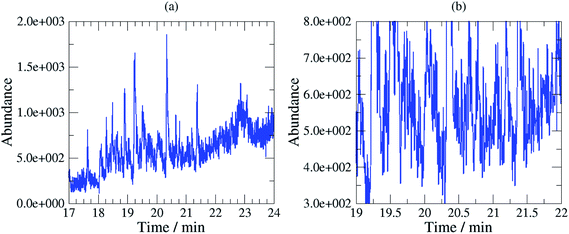
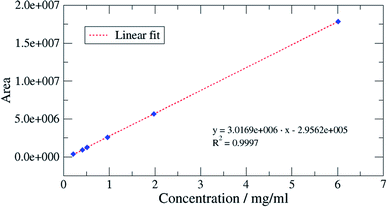
:![[thin space (1/6-em)]](https://www.rsc.org/images/entities/char_2009.gif) 1 for the LOQ was chosen; these values being typical values. Appropriate concentrations for this determination were 0.1 to 0.5 mg oil per mL dichloromethane. LOD and LOQ were estimated to be 0.02 respective 0.07 mg mL−1 for Mobil Rarus 1025, 0.1 respective 0.4 mg mL−1 for Mobil Pegasus 1 (Fig. 5) and 0.2 respective 0.6 mg mL−1 for Mobil Univis™ N32.
1 for the LOQ was chosen; these values being typical values. Appropriate concentrations for this determination were 0.1 to 0.5 mg oil per mL dichloromethane. LOD and LOQ were estimated to be 0.02 respective 0.07 mg mL−1 for Mobil Rarus 1025, 0.1 respective 0.4 mg mL−1 for Mobil Pegasus 1 (Fig. 5) and 0.2 respective 0.6 mg mL−1 for Mobil Univis™ N32.
 | (1) |
| U = 2 × uc | (2) |
The measurement uncertainties were found to be dependent of the chromatographic profiles. For oils exhibiting well resolved peaks, the measurement uncertainty U (k = 2) was estimated to be 12% relative. For oils exhibiting globally unresolved peaks with some dominant peaks on top of this profile, the measurement uncertainty U (k = 2) was estimated to be 15% relative. Finally, for oils globally unresolved in GC, the measurement uncertainty U (k = 2) was estimated to be 17.5% relative.
4.2 Validation of the GC/FID method
The characterization of the method was undertaken by applying two standards, initially published for water matrices, but also largely used for validation of analytical methods for other matrices:• The requirements of the NF T 90-210 (ref. 23) standard for the characterization of the calibration curve, the validation of the limit of quantification and the evaluation of accuracy at various levels of oil concentrations;
• The requirements of the EN ISO 11352 standard24 for the evaluation of uncertainties at various levels of oil concentrations.
| Concentration (mg mL−1) | 0.2 | 0.4 | 0.5 | 1 | 2 | 6 |
| Maximum allowed deviation (%) | 30 | 20 | 10 | 10 | 5 | 5 |
| Sequence 1 | −11.5% | 2.2% | 4.6% | −5.5% | 2.0% | −0.1% |
| Sequence 2 | 8.0% | −1.9% | 1.9% | −2.1% | −1.4% | 0.2% |
| Sequence 3 | 5.5% | 0.8% | 7.3% | −5.5% | −1.7% | 0.3% |
| Sequence 4 | −6.4% | 8.6% | −2.6% | −3.6% | 0.0% | 0.1% |
| Sequence 5 | 13.5% | 3.0% | −2.4% | 1.3% | −4.8% | 0.5% |
| Sequence 6 | 20.0% | 1.8% | 6.0% | −6.3% | −1.5% | 0.3% |
| Interpretation bias | Acceptable | Acceptable | Acceptable | Acceptable | Acceptable | Acceptable |
| Conclusion | Linear calibration accepted | |||||
| LOQ (0.2 mg mL−1) | 6 to 7 mg mL−1 | ||
|---|---|---|---|
| Control samples | SRw (rel.) | 10.03% | 0.17% |
| Routine replicate samples | sr (rel.) | 9.22% | 0.01% |
| Standard deviation | u(Rw) (rel.) | 13.62% | 0.17% |
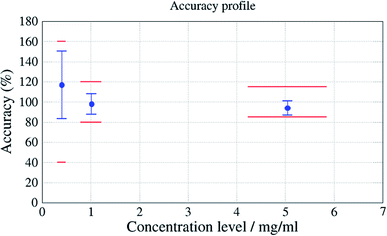
• 4 mg spiked onto coalescing filter (LOQ)
• 10 mg spiked/filter (corresponding after extraction and solvent evaporation to 20% of the highest level of the calibration curve)
• 50 mg spiked/filter (corresponding to 80% of the highest level of the calibration curve)
Six series of extraction in duplicates were performed on six different days.
This methodology evaluated trueness and precision of the results for the compressor oil at the studied concentrations. This test ensured that accuracy (trueness and precision) did not exceed ±20% of the spiked concentration for intermediate concentrations and ±15% of the spiked concentration for the highest concentration. Results are presented in Fig. 9.
The lack of selectivity of the FID detector induces that other components of the matrix can potentially be integrated within the oil signal leading to an overestimation of the measurement.
Finally, as for MS detection, as there is a choice of peaks to be integrated or fixed time interval to integrate, two different operators may take different decisions which may lead to slightly different estimates.
4.3 Validation of the DI/FTIR method
| Analysed oil | Fit quality to reference spectrum (%) | ||
|---|---|---|---|
| Mobil Univis™ N32 | Mobil Rarus SHC 1025 | Mobil Pegasus 1 | |
| Mobil Univis™ N32 | 0.99615 | 0.98874 | 0.99077 |
| Mobil Rarus SHC1025 | 0.98746 | 0.99945 | 0.99313 |
| Mobil Pegasus 1 | 0.99405 | 0.99737 | 0.99973 |
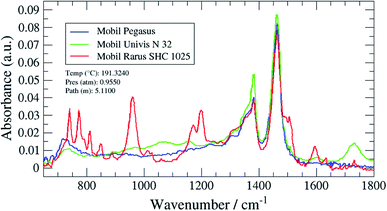
The selectivity of this technique was improved by using some of the smaller characteristic peaks in the fingerprint region for quantification.
A magnified section of the spectrum in the fingerprint region (650 to 1800 cm−1) with the three target oil spectra overlaid 1 is shown in Fig. 11 (Mobil Pegasus 1: blue spectrum, Mobil Rarus SHC 1025: red spectrum, Mobil Univis™ N 32: green spectrum).
The Mobil Rarus oil spectrum has characteristic C![[double bond, length as m-dash]](https://www.rsc.org/images/entities/char_e001.gif) C absorption peaks at 950 and 1600 cm−1, while the Mobil Univis™ oil spectrum has a characteristic C
C absorption peaks at 950 and 1600 cm−1, while the Mobil Univis™ oil spectrum has a characteristic C![[double bond, length as m-dash]](https://www.rsc.org/images/entities/char_e001.gif) O peak at 1730 cm−1. All three oils have a C–C absorption peak at around 1450 cm−1.
O peak at 1730 cm−1. All three oils have a C–C absorption peak at around 1450 cm−1.
| Compressor oil | Injection volume (μL) | Peak match | Density (ng μL−1) | Expected mass (ng) | Quantified mass (ng) | Recovery (%) |
|---|---|---|---|---|---|---|
| Mobil Pegasus 1 | 0.2 | Dodecane | 750![[thin space (1/6-em)]](https://www.rsc.org/images/entities/char_2009.gif) 000 000 |
150![[thin space (1/6-em)]](https://www.rsc.org/images/entities/char_2009.gif) 000 000 |
42![[thin space (1/6-em)]](https://www.rsc.org/images/entities/char_2009.gif) 200 200 |
28.1 |
| Mobil Rarus SHC 1025 | 0.2 | Dodecane | 750![[thin space (1/6-em)]](https://www.rsc.org/images/entities/char_2009.gif) 000 000 |
150![[thin space (1/6-em)]](https://www.rsc.org/images/entities/char_2009.gif) 000 000 |
39![[thin space (1/6-em)]](https://www.rsc.org/images/entities/char_2009.gif) 800 800 |
26.5 |
| Mobil Univis™ N32 | 0.2 | Dodecane | 740![[thin space (1/6-em)]](https://www.rsc.org/images/entities/char_2009.gif) 000 000 |
148![[thin space (1/6-em)]](https://www.rsc.org/images/entities/char_2009.gif) 000 000 |
124![[thin space (1/6-em)]](https://www.rsc.org/images/entities/char_2009.gif) 600 600 |
84.1 |
Measurements with an FTIR spectrometer may be affected by interferents absorbing in the same spectral regions as those used for primary quantification of the target analyte. Variations in other parameters such as temperature and pressure which also have a direct effect on analyte measurement, are monitored and corrected for using real-time algorithms. The selection of interferent-free spectral regions for quantification is configured in the analysis method and application-specific methods are developed to optimise performance and eliminate operator variance.
In terms of susceptibility to contamination as a result of repeated exposure to the analyte, the FTIR gas cell is the only component in direct contact with the analyte vapor. This gas cell consists of a stainless-steel light pipe assembly with a 10 cm pathlength. Which is maintained at a temperature of 300 °C. It is therefore resilient to the accumulation of contaminants and any performance degradation associated with this; however, it is possible to routinely assess the cleanliness of the gas cell by checking the peak signal intensity, which is part of recommended quality assessment procedures.
5. Measurement uncertainties
Measurement uncertainties for the analytical methods were calculated for the three methods using MUKit Measurement Uncertainty Kit.22 A coverage factor (k) of 2 was chosen leading to a confidence of about 95%. The measurement uncertainties (at level above 20% of the highest level) were 12 to 17% rel. for the GC/MS method, 32% rel. for the GC/FID method and 17% for the DI/FTIR method.6. Conclusions
This study presents the validation of three different methods to analyse compressor oils; one method based on FTIR, one method based on GC/MS and one method based on GC/FID. Measurement uncertainties were calculated for these three methods using three different types of oils (here called Mobil Rarus SHC 1025, Mobil Pegasus 1, Mobil Univis™ N32). These three oils exhibited three different profiles in gas chromatography: oils exhibiting some well resolved peaks, oils exhibiting globally unresolved peaks with some dominant peaks on top of the hump and oils globally unresolved. The DI/FTIR method and the GC/MS method both resulted in measurement uncertainties close to 20% rel. while the GC/FID method resulted in a higher measurement uncertainty (U = 30% rel.). In GC/MS, the measurement uncertainty was found to be dependent upon the type of oils; logically oils exhibiting some well resolved peaks gave rise to lower measurement uncertainties (U = 12.5% rel.) than oils with globally unresolved peaks. The mass spectrometer also presents the advantages of a better selectivity as it allows the section of specific ions from the total ion chromatogram mode. The selectivity of the DI/FTIR method is improved by using some of the smaller, characteristic peaks in the fingerprint region for quantification. The evaluation of the three measurement methods demonstrated that any of these three methods presented are suitable for the quantification of compressor oil for samples containing from 0.2 mg mL−1 to 6 mg mL−1 oil in an organic solvent. Consequently, the choice of the appropriate method will be determined by the resources available at the laboratory as well as the required measurement uncertainties. Overall, the GC/MS method presents several advantages: it allows a better identification of the oil in the carryover and has the lowest measurement uncertainty.Conflicts of interest
The authors declare that they have no conflict of interest.Acknowledgements
This work was supported by EURAMET (European Association of National Metrology Institutes) through the project EMPIR 16ENG05 “Metrology for biomethane”. The EMPIR initiative is co-founded by the European Union's Horizon 2020 research and innovation programme and the EMPIR Participating States.References
- E. Ryckebosch, M. Drouillon and H. Vervaeren, Techniques for transformation of biogas to biomethane, Biomass Bioenergy, 2011, 35(5), 1633–1645 CrossRef CAS.
- S. Cornot-Gandolphe, Global biomethane market: green gas goes global, Technical report, Cedigaz, March 2019 Search PubMed.
- N. Cui, Biomethane as Transport Fuel, A Study on Upgrading Technologies and Biomethane Potential in Finland, Bachelor's thesis, Novia UAS, Vaasa, Finland, 2015.
- T. Ren and J. Neels, Advantages of Non-lubricated CNG Compressors, Technical report, IMW Industries Ltd., 2002 Search PubMed.
- C. T. Billiet and R. M. Fielding, A Quantitative Method to Determine Oil Carry-over from High Efficiency Coalescing Filters in Compressed Gases Under Varying Dynamic Conditions and the Interpretation of Results to Assist Filter System Design, International Compressor Engineering Conference, 1998, pp. 398–407 Search PubMed.
- L. Thomason, The Achilles Heel of Natural Gas Vehicles: The Symptoms, Diagnosis and Prevention of Oil Carry-over, Technical report, Natural Gas Vehicle Institute (NGVi), Las Vegas, Nevada, USA, June 2018 Search PubMed.
- ASTM WK49305, New Practice for Determining Compressor Oil Carryover in Compressed Natural Gas Used as a Natural Gas Motor Vehicle Fuel, American Society for Testing and Materials (ASTM) draft standard, 2015 Search PubMed.
- S.-S. Hwang, et al., A Study on the Quantitative Measurement of Oil Carry-over in Natural Gas Vehicle fueling Station Using A Gravimetric Method, Journal of the Korean Institute of Gas, 2015, 19(1), 12–17 CrossRef.
- M. Czachorski and R. Kina, Validation Testing of a Gravimetric Method to Measure CNG Compressor Oil Carry-over, Technical report, GRI-98/0228, Institute of Gas Technology (IGT), Gas Research Institute, Chicago, IL, June 1998 Search PubMed.
- F. Graf, et al., Monitoring CNG quality in Germany, Proceedings of the 24th World Gas Conference, Buenos Aires, Argentina, October 2009, pp. 5–9 Search PubMed.
- K. Arrhenius, H. Yaghooby and P. Klockar, Development and Validation of Methods for Test of CNG Quality Inclusive of Oil Carryover, Technical report, Swedish Gas Technology Centre (SGC), SGC report 290, Malmö, Sweden, 2013 Search PubMed.
- K. Arrhenius, et al., Optimal oil concentration range in CNG/biomethane to minimize operational problems, Technical report, Energiforsk report 144, 2015 Search PubMed.
- K. Arrhenius, D. Podien, H. Yaghooby and N. Smajovic, Optimization of an Analytical Method for the Measurement of Oil Carryover from a Compressor in Compressed Natural Gas Refueling Stations, Energy Fuels, 2015, 29(4), 2416–2421 CrossRef CAS.
- Z. Wang, et al., 4 – Petroleum biomarker fingerprinting for oil spill characterization and source identification, in Standard Handbook Oil Spill Environmental Forensics, ed. S. A. Stout and Z. Wang, Academic Press, Boston, USA, 2nd edn, 2016, pp. 131–254 Search PubMed.
- F. Hilaire, E. Basset and R. Bayard, Comprehensive two-dimensional gas chromatography for biogas and biomethane analysis, J. Chromatogr. A, 2017, 1524, 222–232 CrossRef CAS PubMed.
- D. Ballesteros-Vivas, G. Alvarez-Rivera and E. Ibanez, A multi-analytical platform based on pressurized-liquid extraction, in vitro assays and liquid chromatography/gas chromatography coupled to high resolution mass spectrometry for food by-products valorisation. Part 2: Characterization of bioactive compounds from goldenberry (Physalis peruviana L.) calyx extracts using hyphenated techniques, J. Chromatogr. A, 2019, 1584, 144–154 CrossRef CAS PubMed.
- A. Romera-Torres, R. Romero-Gonzalez and J. L. Martinez Vidal, Analytical methods, occurrence and trends of tropane alkaloids and calystegines: an update, J. Chromatogr. A, 2018, 1564, 1–15 CrossRef CAS PubMed.
- ExxonMobil, Rarus SHC 1025, Safety Data Sheets (SDS) and Product Data Sheets (PDS), https://lubricants.mobil.com/en/industrial/lubricants/products/mobil-rarus-shc-1025, accessed 2020-01-13.
- ExxonMobil: Univis™ N 32, Safety Data Sheets (SDS) and Product Data Sheets (PDS), https://lubricants.mobil.com/en/industrial/lubricants/products/univis-n-32, accessed 2020-01-13.
- ExxonMobil: Mobil Pegasus 1, Safety Data Sheets (SDS) and Product Data Sheets (PDS), https://lubricants.mobil.com/en/industrial/lubricants/products/mobil-pegasus-1, accessed 2020-01-13.
- B. Magnusson and U. Örnemark, The Fitness for Purpose of Analytical Methods – A Laboratory Guide to Method Validation and Related Topics. Eurachem guide, 2nd edn, 2014, ISBN 978-91-87461-59-0, available at, http://www.eurachem.org, accessed: 2020-01-13 Search PubMed.
- B. Magnusson, et al., Handbook for calculation of measurement uncertainty in environmental laboratories, Nordtest technical report 537, 4th edn, 2017, available at, http://www.nordtest.info, accessed 2020-01-13 Search PubMed.
- NF T 90-210, Water quality – Protocol for the initial method performance assessment in a laboratory, Association Française de Normalisation (AFNOR) standard, November 2018 Search PubMed.
- EN ISO 11352, Water quality – Estimation of measurement uncertainty based on validation and quality control data standard, International Organization for Standardization (ISO) standard, June 2012 Search PubMed.
- D. Harvey, 12: Chromatographic and Electrophoretic Methods; 12.4: Gas Chromatography, in Analytical Chemistry 2.1, Chemistry LibreTexts, 2016, available at (webpage for digital textbook), https://chem.libretexts.org/Bookshelves/Analytical_Chemistry/Book%3A_Analytical_Chemistry_2.1_(Harvey)/12%3A_Chromatographic_and_Electrophoretic_Methods/12.04%3A_Gas_Chromatography, accessed 2020-01-13 Search PubMed.
| This journal is © The Royal Society of Chemistry 2020 |

