 Open Access Article
Thermodynamic investigation with chemical kinetic analysis on the reoxidation phenomenon of the Cr(III) in air†
Qining Liu ab,
Honghui Liuab,
Huixia Chen*ab,
Xinrun Wang*c,
Dahai Hud,
Xichuan Chenge and
Hongbin Xuab
aCAS Key Laboratory of Green Process and Engineering, Institute of Process Engineering, Chinese Academy of Sciences, Beijing 100190, China. E-mail: hxchen@ipe.ac.cn; Tel: +86 13426451886
bNational Engineering Laboratory for Hydrometallurgical Cleaner Production Technology, Institute of Process Engineering, Chinese Academy of Sciences, Beijing 100190, China
cState Key Laboratory of Environmental Criteria and Risk Assessment, Chinese Research Academy of Environmental Sciences, Beijing 100012, China
dYuhuan Environmental Technology Co. LTD, Shijiazhuang 050091, Hebei Province, China
eHubei Zhenhua Chemical Co. LTD, Huangshi 435001, Hubei Province, China
First published on 24th July 2020
Abstract
In this paper, the reoxidation behaviours of CrOOH and Cr(OH)3 are investigated as the major reduction products of Cr(VI). The atmosphere oxidation of Cr(III) is studied in the environment of soil without manganese and hydrogen peroxide. The influence of temperature and pH value on the oxidation rate of Cr(III) is examined by Experiment methods in details. According to the experimental results, the oxidation of Cr(III) is promoted in the environment with high pH value, however, the oxidation process is stable with temperature. The oxidation process of CrOOH and Cr(OH)3 are theoretically researched by thermodynamic calculation and density functional theory (DFT) simulation. The results of DFT indicate that both CrOOH and Cr(OH)3 are oxidized during the chemical adsorption process of O2 in alkaline environment. With the transformation from Cr(III) to Cr(VI), the Cr–O covalent bond forms in the adsorption process. The crystal structure difference between CrOOH and Cr(OH)3 leads to the different oxidation reaction between O2 and Cr(III). The significant alteration of oxidation process in (110), (310), (321) crystal planes is also observed indicating the crystal orientation dependence. Based on the chemical reaction kinetics, the chemical equivalent constant K of CrOOH is higher than Cr(OH)3, illustrating higher chemical stability in air. In summary, both experimental study and theoretical analysis on the reoxidation phenomenon of Cr(III) reduced from Cr(VI) in natural environment demonstrate that not only the external factors such as temperature and pH value but also the crystal structure of Cr(III) compound have dramatic influence on the oxidation process.
1. Introduction
With the development of industrial production, the contamination of chromium becomes more and more serious. Most of the polluted areas are distributed in the legacy site after the migration of the old factory. The maximum level of Cr(VI) in contaminated soil setting by the US Environmental Protection Agency is 1240 ppm.1 The maximum concentration of Cr(VI) in soil is: 100 mg kg−1 in Germany and 120 mg kg−1 in Canada.2 However, according to the results of sampling and analysis of the surrounding soil of contaminated area e.g. buried field, the total chromium content of sample points can reach to the values of 581.75–7060.00 mg kg−1 that is far beyond the requirement of the quality control standard. As far as the existence of valence state of chromium is concerned, Cr(III) and Cr(VI) are two common aerobic states in soil. Chromium is the essential trace element of human and animal in the stable form of Cr(III), however, is highly toxic and harmful in the easy-to-migrate form of Cr(VI).3 The feature of easy migration makes Cr(VI) not only expand the range of soil pollution, but also pollute surface water and groundwater. Nowadays, people usually use the FeSO4 and Na2S as the reduction to reduce the Cr(VI) that far above the standard. FeSO4 can reduce the Cr(VI) in acidic and neutral conditions, and generate CrOOH in weak acid or neutrally condition then precipitate Cr(OH)3 sediment in alkaline environment.4,5 Na2S can reduce Cr(VI) to Cr(III),6 producing SO42− (ref. 7) or S8 as the oxidize production, and mainly producing Cr(OH)3·nH2O in alkaline condition as the reduction of Cr(III).CrOOH and Cr(OH)3, slightly soluble in water, are usually known as the stable reduction product of Cr(III).9 From the evaluation results of short-term remediation effect, it is found that the reduction and remediation of Cr(VI) contaminated soil can basically reach the established standard, but there is a rebound in the concentration of Cr(VI) after reduction and restoration.10 Researchers make two kinds of arguments about this phenomenon after reduction and treatment of the soil. Unavoidable, the detection accuracy of Cr(VI) in soil is one of defect of the reason of “Reoxidation of Cr(III)”.11,12 The second view is that Cr(III) can be oxidized by Mn and H2O2.13 A large number of laboratory studies have shown that manganese oxide can oxidize Cr(III) to Cr(VI) Fandeur.14 It can easily trigger the oxidizing reaction with strong adsorption capacity and high oxidation potential.15 In addition, H2O2 is also a natural oxidant in soil environment.16 H2O2 can be produced by biological metabolic process, soil weathering process and photochemical process.15 Cr(III) can produce intermediate Cr(VI), Cr(V) and newly forming (–OH) with highly oxidation.17
However, no previous work has been done to study if oxygen is the contributing factor in the oxidation process of Cr(III) to Cr(VI), especially in the wet alkaline environment. Without the function of catalysis, oxygen has the possibility to become the potential oxide in theory. In this paper, we study the reoxidation of Cr(III) in the air without MnO2 and H2O2. By reducing the Cr(VI) with FeSO4 and Na2S, we can get CrOOH and Cr(OH)3·nH2O within different pH. A step further, we proceed condition experiment with Cr(III) exposed to air in different pH (6, 8, 10, 12, 14) and temperatures (20 °C, 40 °C, 60 °C, 80 °C, 100 °C). The Cr(III) samples before and after the oxidation process were characterized by SEM and XPS. Through quantitative analysis by spectrophotometric method, we can get Cr(VI) content at each 12 hours. In addition, kinetic models was used to described the oxidation process of Cr(III). Based on the thermodynamic investigation, the principle of Cr(III) oxidized to Cr(VI) could be acquired within different pH at certain temperature which is closed to the soil environment. In addition, we compute the adsorb energy of Cr(III) reacting with oxygen by DFT (density functional theory), with the results of DOS (density of state) and PDOS (partial density of state) before and after the Cr(III) reacting with oxygen.
2. Experiment and computational method
2.1 Experiment
CrOOH was prepared by the reaction of Na2CrO4 with FeSO4·7H2O (made by Aladdin company, analytically pure) in acid or neutral condition (pH = 5–7), and then filtered in alkaline condition (pH > 8). Meanwhile, Cr(OH)3 was obtained by the reaction of Na2CrO4 with Na2S·9H2O (made by Aladdin company, analytically pure) in alkaline condition (pH > 12), and then filtered in the same condition. Thoroughly clean the CrOOH and Cr(OH)3 with distilled water, and rinse completely so there is no residual Cr(VI). After the filtering process, the Cr(III) sample was dried in FD-1A-50 vacuum freeze dryer (manufactured by BIOCOOL company, vacuum value < 9 Pa) by 24 hours.The CrOOH and Cr(OH)3 were separated into four groups, studying the effects of temperature and pH on reoxidation of Cr(III) in air under different conditions. In the reoxidation process, 50 mg CrOOH and Cr(OH)3 was dissolved respectively in a certain amount of deionized water. In order to contrast the temperature, the samples of Cr(III) were exposed to the air at room temperature and placed in 40 °C, 60 °C, 80 °C and 100 °C DZF-6096 oven (manufactured by Shanghai YIHENG company) respectively. In addition, the pH value of Cr(III) was buffered in the solution (pH = 6, 8, 10, 12, 14). After each of 12 hours, the hexavalent chromium concentration in the solution was analysed by ultraviolet spectrophotometer (constructed by PERKINELMER company, measuring wavelength from 190 nm–900 nm).
The microstructure, compositions and chemical bonding states of the CrOOH and Cr(OH)3 were studied using scanning electron microscope (SEM), X-ray photoelectron spectroscopy (XPS). SEM analyses were performed using JSM-7001F + INCA X-MAX. The XPS measurements were performed using a Thermo Fisher ESCALAB 250 Xi instrument which equipped with a Mg Ka X-ray source (power of 300 W).
2.2 Computational method and model
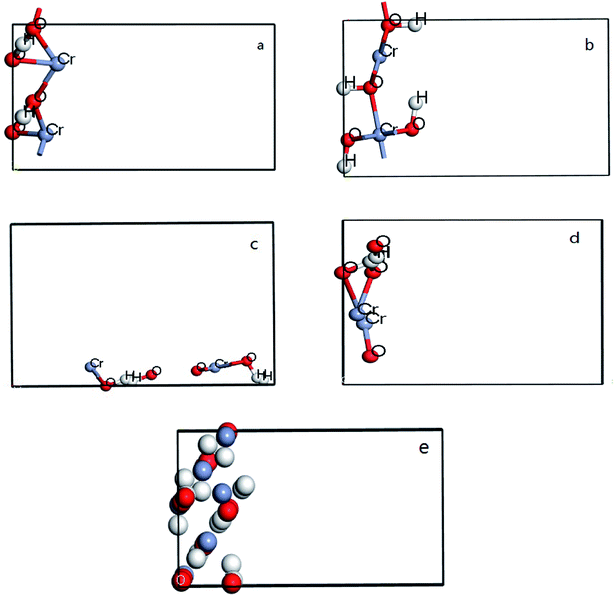
All DFT calculations are performed by using CASTEP code in Materials studio 8.0. In the calculation process, the periodic boundary condition is used to replace the ion potential with pseudo potential. And then the plane wave ultra-soft pseudo potential method is used, with the generalized gradient functional (GGA) utilized to deal with the exchange correlation potential. Plane-wave energy cutoff 300 eV and Monkhorst–Pack k-point gird of (3 × 4 × 1) were used. In addition, vacuum was entered between two surfaces of each model and the thickness is set of 8 Å to avoid the interaction. 5 × 2 groups were build in four crystal surfaces of CrOOH and one crystal bulk of Cr(OH)3, each model have two files, before and after the O2 adsorb at the surface. For each slabs, the bottom of atoms are fixed, allowing the Cr on the outermost relaxed to attached oxygen. The figure can be seen at Fig. 1 from (a–e).3. Results and discussion
3.1 Characterization and analysis
The crystal structure models of β-CrOOH and Cr(OH)3 were constructed and optimized was shown in Fig. 1. The chemical adsorption models of oxygen molecules on different surfaces by intercepting different crystal planes of (101), (310), (321), and (110) crystal planes was constructed, relating with X-ray diffraction result. By ICSD database,18 the crystal structure of β-CrOOH and Cr(OH)3 at the very start were created and optimized. The β-CrOOH is belong to Pnnm space group, while Cr(OH)3·nH2O is belong to P1m1 space group. With optimizing the crystal structure, we can get the most stable absorb model which has lowest internal energy. The figure can be seen at Fig. 10 from (a and b).In order to obtain information about the influence of temperature and pH in the process of Cr(III) be oxidized to Cr(VI), the morphology of CrOOH and Cr(OH)3 were studied before and after oxidation.
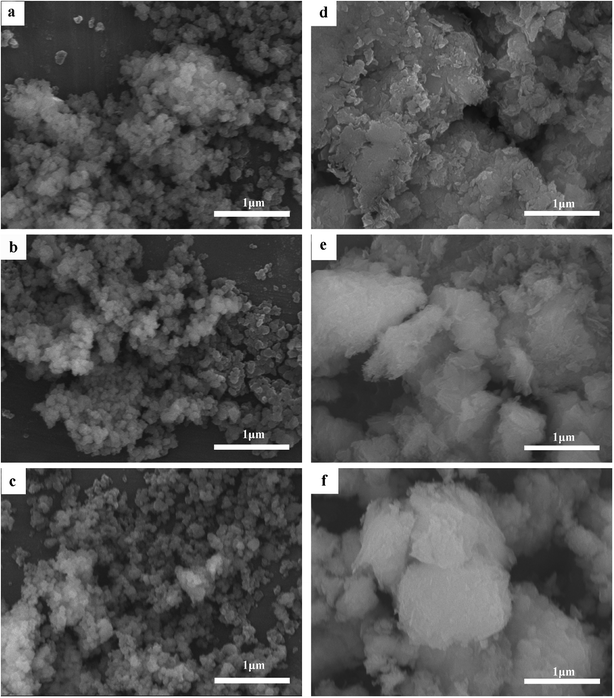
As can be seen in Fig. 2, the average particle size of Cr(OH)3 has change little whether in high temperature or in extreme alkaline environment. While the CrOOH particle is visualized to have a crystallized sheet structure before oxidation. It's appeared non-crystallised lumpy aggregates after the oxidation. The floccule has larger size than the particle before oxidation, and the origin of the new structure maybe have some relation with yellow chromate.
In order to further analyze the valence state, binding form, and relative content of chromium before and after the reaction, XPS narrow-band scanning for Cr (2p) orbit has been used in our study. After peaking separations and fitting, the result can be seen from Fig. 3, and the relative content of element can be seen from Table 1.
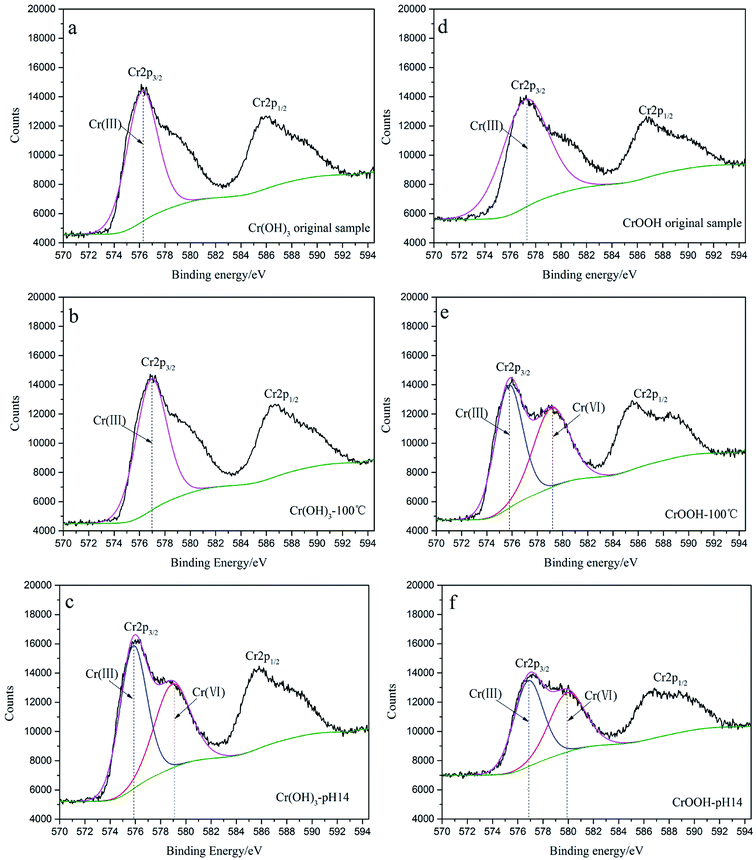 | ||
| Fig. 3 (a) The original Cr(OH)3 sample; (b) Cr(OH)3 at 100 °C; (c) Cr(OH)3 at pH = 14; (d) original CrOOH sample; (e) CrOOH at 100 °C; (f) CrOOH at pH = 14. | ||
| Condition | Element | Relative content/% |
|---|---|---|
| Cr(OH)3 original sample | O | 85.13 |
| Cr | 13 | |
| Na | 1.87 | |
| Cr(OH)3 in 100 °C | O | 85.25 |
| Cr | 13.15 | |
| Na | 1.6 | |
| Cr(OH)3 in pH 14 | O | 74.68 |
| Cr | 10.87 | |
| Na | 14.45 | |
| CrOOH original sample | O | 84.74 |
| Cr | 7.44 | |
| Na | 7.83 | |
| rOOH in 100 °C | O | 76.15 |
| Cr | 10.53 | |
| Na | 13.32 | |
| CrOOH in pH 14 | O | 73.77 |
| Cr | 5.17 | |
| Na | 21.06 |
As you can see in the Fig. 3, the Cr 2p spectra has separated into Cr 2p3/2 peak and Cr 2p1/2 peak because of spin splitting. By comparing the XPS spectra of chromium hydroxide under different conditions in Fig. 3(a–c), the Cr(VI) peak appeared within the high alkaline environment after 14 days. The binding energy is 579.05 eV which is closed to 579.8 eV of Na2CrO4 (the 1.3–1.4 eV fluctuation is because of the overlap with the multiplied splitting of Cr(III)). However, we can find Cr(VI) peak of hydroxy chromium both in high temperature and pH. And it has broader chemical shift between the Cr(III) to Cr(VI).
Comparing high temperatures with high pH environments From Fig. 3(e), (f), the peak fitting envelope of Cr(III) and Cr(VI) can illustrate the relative content of them. In alkaline environment, the Cr(III) is more likely to be oxidized obviously. Moreover, the Table 1 listed the relative contend of element. The content of Na increased after the oxidation of Cr(III), and the more content of Na represented the more CrO42− has been made. So the CrOOH which exposed to air in alkaline environment seemed to more lively in all of the sample.
3.2 Cr(III) reoxidation experiment and analysis of chemical reaction dynamics
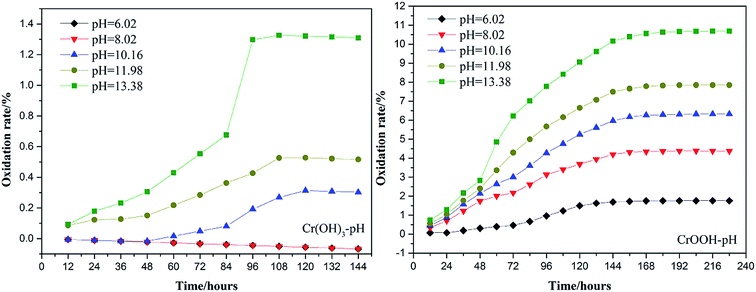
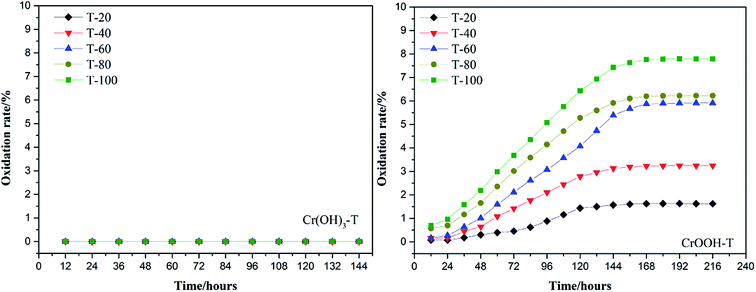
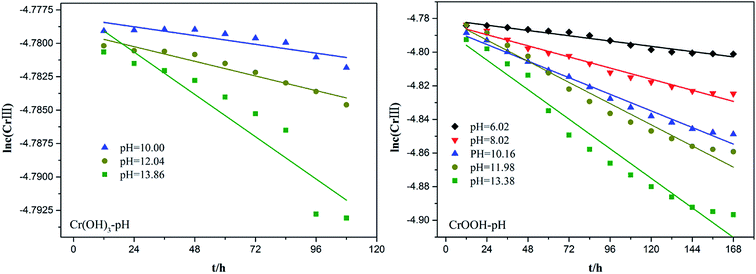
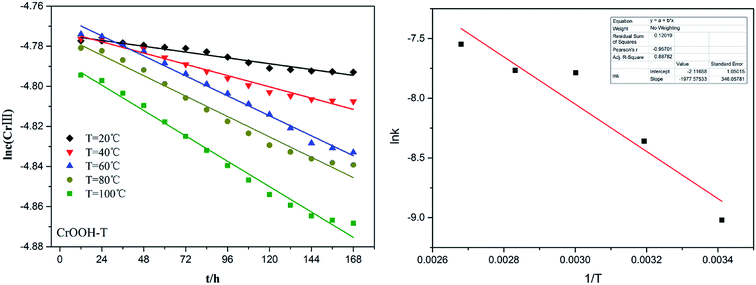
To explore the effects of temperature and pH on Cr(III) reoxidation, we measured the concentration of Cr(VI) by spectrometer. The Fig. 4 has showed the rule of Cr(III) oxidation with the effect of pH. As the pH increased, the Cr(VI) content in the CrOOH and Cr(OH)3 samples increased, while Cr(OH)3 does not occur oxidation under pH of 10. In addition, as time goes on, the reaction becomes closer to equilibrium, and CrOOH occurs longer than Cr(OH)3 in the oxidation process. As regards to the rule of Cr(III) oxidation with the effect of temperature, which can be seen in Fig. 5. Cr(OH)3 did not reoxidize with the increase of temperature. According to the previous thermodynamic analysis, Cr(OH)3 is not easy to be oxidized at lower pH, even at high temperature. But the Cr(VI) in CrOOH sample increases as the temperature rises. The oxidation rate is lower than the CrOOH in higher pH, which illustrates pH seemed has more effect on oxidation process than temperature.To make a deep understanding of the oxidation process from Cr(III) to Cr(VI), we have a dynamic fitting of the results on the reoxidation part. First, the effect of pH in the process can be seen in Fig. 6. Combining the results of the kinetic constant K values in Table 2, we find that the chemical reaction rate constant K increases as pH and temperature rise up. Through previous thermodynamic analysis, increased concentration of OH− reduces Gibbs free energy for reoxidation reaction of Cr(III). And the rate constant of CrOOH is one magnitude larger than the Cr(OH)3. Moreover, by fitting the Arrhenius equation of temperature and chemical reaction rate constants, the 1/T − ln![[thin space (1/6-em)]](https://www.rsc.org/images/entities/char_2009.gif) K has linear relationship as can be seen in Fig. 7, and the rate constant of CrOOH with different temperature is closed to the constant with different pH except pH = 14. Although the CrOOH in higher pH can be oxidated easier, the production of sodium hydroxide helps make reoxidation of Cr(III) easier within high temperature. Plus, molecular kinetic energy increases as the temperature rises, which greatly contribute to reaction (Table 3).
K has linear relationship as can be seen in Fig. 7, and the rate constant of CrOOH with different temperature is closed to the constant with different pH except pH = 14. Although the CrOOH in higher pH can be oxidated easier, the production of sodium hydroxide helps make reoxidation of Cr(III) easier within high temperature. Plus, molecular kinetic energy increases as the temperature rises, which greatly contribute to reaction (Table 3).
| Sample | pH | K (25 °C)/mol L−1 h−1 | R (fitting variance) |
|---|---|---|---|
| Cr(OH)3 | 10 | 2.74 × 10⁻⁵ | 0.8737 |
| 12.04 | 4.57 × 10⁻⁵ | 0.9323 | |
| 13.86 | 1.32 × 10⁻⁴ | 0.8529 | |
| 6.02 | 1.31 × 10⁻⁴ | 0.9555 | |
| 8.02 | 2.75 × 10⁻⁴ | 0.9761 | |
| CrOOH | 10.16 | 4.11 × 10⁻⁴ | 0.9847 |
| 11.98 | 5.25 × 10⁻⁴ | 0.9691 | |
| 13.38 | 7.35 × 10⁻⁴ | 0.9565 |
| Sample | T/K | K (pH = 6)/mol L−1 h−1 | R (fitting variance) |
|---|---|---|---|
| CrOOH | 293.15 | 1.21 × 10⁻⁴ | 0.9537 |
| 313.15 | 2.34 × 10⁻⁴ | 0.9727 | |
| 333.15 | 4.15 × 10⁻⁴ | 0.9864 | |
| 353.15 | 4.24 × 10⁻⁴ | 0.9909 | |
| 373.15 | 5.27 × 10⁻⁴ | 0.9794 |
3.3 Potential-PH diagrams of Cr(III)–H2O system at different ionic activity
All of the data we used in this part of thermodynamic calculation are obtained from ref. 19 and 20. By calculating Gibbs free energy of Cr(OH)3 and CrOOH oxidation reaction, we can evaluate the difficulty of the chemical reaction. The chemical reactions are as follows:So, the Nernst equation of the reactions can be listed as bellows:
After Cr(VI) is reduced to Cr(III), lime is added to neutralize to neutral or alkaline. Cr(III) combines with OH− to form Cr(OH)3 or transforms to CrOOH precipitation, Cr(OH)3 and CrOOH are oxidized to hexavalent chromium by oxygen in air under alkaline conditions. As the reaction are happened in alkaline environment, the standard electromotive force of the primitive cell can be converted to the change of standard Gibbs free energy value. So the final reaction equation and Gibbs free energy equation is as follows:
| Cr(OH)3 + 5OH− = CrO42− + 4H2O + 3e− |
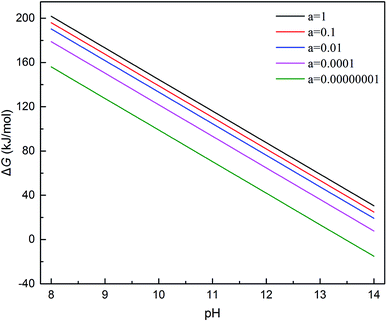
If the activity of  , ΔG1 = 430.07 − 28.54 pH kJ mol−1, the pH–ΔG diagram with different
  can be seen at Fig. 8.
While, as the CrOOH are oxidized to hexavalent chromium by oxygen in air under alkaline conditions. The reaction equation is as follows:
| CrOOH + 5OH− = CrO42− + 3H2O + e− |
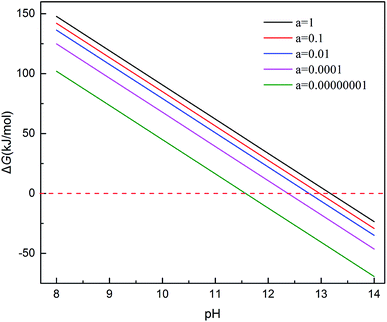
If the activity of  the pH–ΔG diagram with different
  can be seen at Fig. 9.
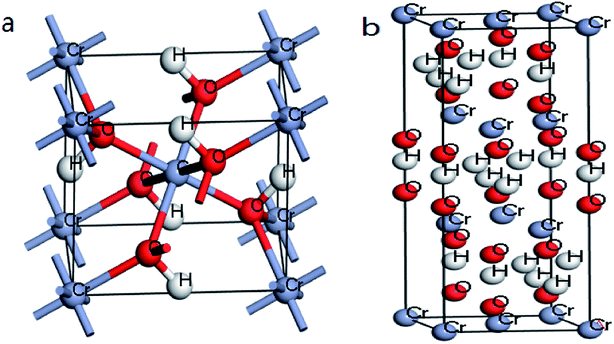 | ||
| Fig. 10 (a) Optimized structures of β-CrOOH in Pnnm space group; (b) Cr(OH)3·nH2O in P1m1 space group. | ||
Through the pH–ΔG diagram, the principle effects of pH within certain ionic activities of each reaction can be summarized as below: (a) as the  is lower, both the diagram of Cr(OH)3 and CrOOH will decline. It means the lower activity of CrO42− will correspond to lower equilibrium potential, promoting the CrO42− reduced to Cr(OH)3 or CrOOH; (b) the higher temperature will also decline the diagram of Cr(OH)3 and CrOOH, due to the Nernst equation; (c) in higher pH region, the negative energy potential illustrate both the Cr(OH)3 and CrOOH has the possibility to convert to CrO42−; (d) Cr(OH)3 required higher pH than CrOOH as oxidized to CrO42−.
3.4 Crystal structure analysis of trivalent chromium compound
After cleaving the surface of crystal structure, an vacuum space between two layers of atoms was slabbed, in order to input the oxygen between the surfaces. With relaxing the other atoms except the outermost Cr atom, we can simplify the operation process and ensure the optimal model. After optimization, the stable adsorption model of CrOOH and Cr(OH)3·nH2O can be used to do the next work. The oxygen molecular was input to finalize our computation of electronic density of states through the process. And the solid model adsorb energy is defined as:
| Ead(Cr3+ solid molecular) = −[E(O2/Cr3+ solid surface) − E(Cr3+ solid surface) − E(O2)]/Nfirst Cr3+ atom |
Ex means crystal internal energy, while N means the number of atoms which are connect to the oxygen molecular. The calculated data is put in Table 4. It can be seen that the CrOOH (101) surface require more adsorb energy than the other three surface of the CrOOH. While the (110) surface of CrOOH need relatively few energy than the other crystal surface. Moreover, the Cr(OH)3 structure has the most adsorb energy in all of computational model, reflecting the difficulties of chemical adsorption is higher than CrOOH model.
| Surface | E(O2)/eV | E(OPT model)/eV | E(adsorption model)/eV | ΔQ/eV |
|---|---|---|---|---|
| (101) | −867.78 | −6708.15 | −7579.32 | −3.39 |
| (110) | −867.78 | −6742.18 | −7610.28 | −0.32 |
| (310) | −867.78 | −6707.03 | −7577.81 | −3 |
| (321) | −867.78 | −6703.5 | −7574.21 | −2.93 |
| Cr(OH)3 bulk | −867.78 | −20250.68 | −21131.65 | −13.19 |
Through the bond distance which can be seen at Table 5, the stability of the optimized adsorption structure and the energy consumed by bonding can be reflected. In the surface of CrOOH, the (101) lattice plane has the shortest Cr–O chemistry bond with 1.689 Å, while Cr(OH)3 surface has longer Cr–O bond than the most cleaved surface of CrOOH. However, (110) surface of CrOOH has Cr–O bond of 4.16 Å which is greater than the length of the molecule van der Waals force described in the literature (3 Å),21 which indicates that the chromium atom on the crystal plane is less likely to be bound to the oxygen atom to form a covalent bond or electrovalent bond (and the lowest adsorb energy has well illustrated this weak interaction). Besides, the distance of O–O bonds from (101), (310), (321) surface and Cr(OH)3 model is higher than 1.26 Å, but lower than 1.49 Å (this two figures are the distance of O2− and O22−, computing by the MO theory),22,23 showing the atom of O are quiet possible combined with Cr in covalent bond with different electronic proportions.
| Adsorption surface | Cr–O/Å | O–O/Å |
|---|---|---|
| (101) | 1.689 | 1.313 |
| (110) | 4.11 | 1.26 |
| (310) | 1.702 | 1.289 |
| (321) | 1.679 | 1.288 |
| Cr(OH)3 | 1.747 | 1.316 |
Subsequently, the electron translation can be analyzed with the figure of electron density and differential charge density. The figure can be seen at Fig. 11 from (a and b).
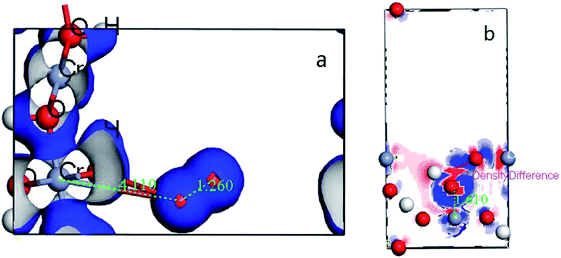 | ||
| Fig. 11 (a) the deformation charge density of (110) surface; (b) difference charge density of CrOOH (101) surface. | ||
It's clear to view the accumulation or depletion of electron within the optimize adsorption structure by the Fig. 11b (O2 adsorption on other systems is similar and thus not shown). The charge density difference is defined as:24 ρ(O2/Cr) − ρ(O2) − ρ(Cr), where ρ(O2/Cr), ρ(O2), and ρ(Cr) are the total charge densities of O2/Cr, a free O2 molecule, and Cr systems without changing their atomic positions. Most of the electron are accumulatd around O2, while the red area indicate the electron depletion of Cr, showing in the Fig. 11b. It is obvious that upon adsorption electrons accumulate on the O2 2π* orbitals. The electron density on Cr is highly polarized to maximize the electrostatic interaction between the negative O2 and the Cr cationic. In contrast, the deformation charge density of (110) surface, showing the independency electron cloud of Cr and O2. The non-electron cloud overlap indirectly illustrates the difficulty of forming a Cr–O covalent bond on the (110) crystal plane.
In order to best understand the nature of chemical adsorption and interatomic bonding theory, the DOS of each surface of CrOOH and Cr(OH)3 before and after adsorption of oxygen was calculated. The DOS can reflect the electronic states within the unit energy interval, as well as the PDOS can illustrate the way that the total energy separated in each electronic orbit.25
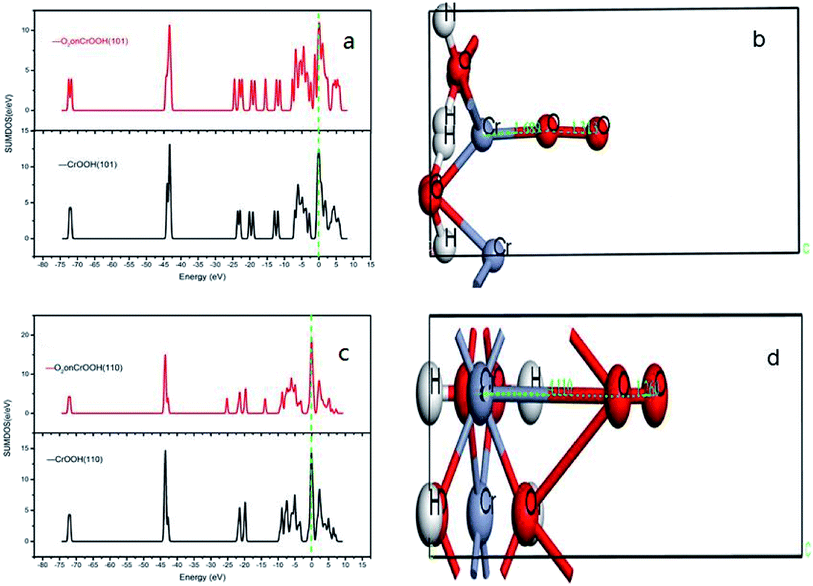
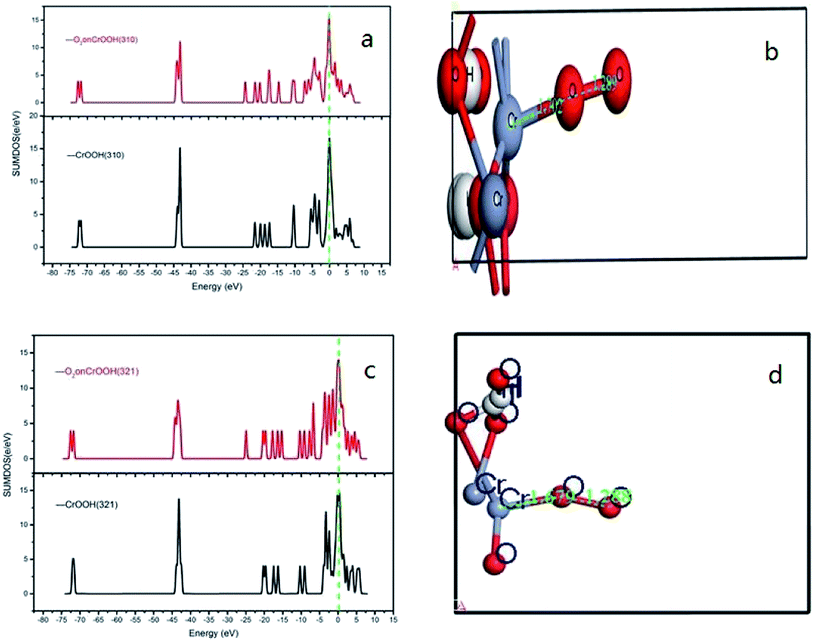
It can be vividly seen at the Fig. 12–14, that the total density of states of four kinds of crystal surface change before and after the oxygen molecule adsorb at four crystal surface. The electron on the surface of the crystal translates to the low energy level, and the surface energy decreases. At (101) surface, most of the electrons of −42 eV transition to the −18 eV and much lower energy level closed to the Fermi energy surface (the larger integral peak area close to Fermi surface indicates that more electrons gather around it). A little change at the (110) surface, showing a small amount of electrons aggregate at −18 eV and −12 eV. While at (310) surface, the electron transition from −45 eV to −15 eV and −8 eV in the distribution of electronic state density of chromium hydroxyl oxide on crystal plane after adsorption, and the electron transition from −45 eV to −8 eV and −5 eV at the (321) surface after the adsorption. However, the surface state density of chromium hydroxide with optimized structure is −73 eV, 43 eV, 20 eV, closely equal to the electronic state density of chromium hydroxide adsorbed on O2, which distributes at −73 eV, 43 eV and 18 eV. So, there is no obvious change in the density of electronic states of chromium hydroxide adsorbed on O2.
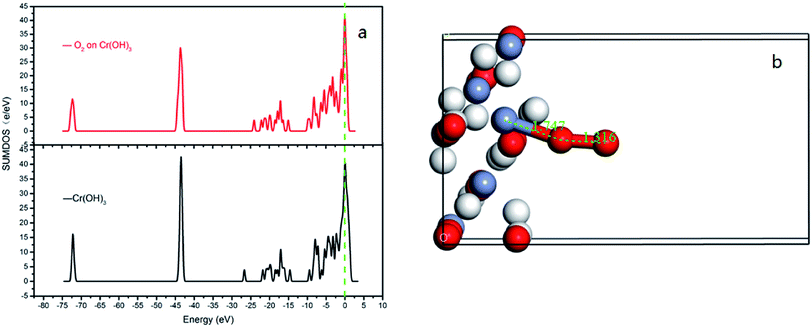 | ||
| Fig. 14 (a) the total density of states of Cr(OH)3 bulk adsorption model; (b) the side view of optimized Cr(OH)3 bulk adsorption model. | ||
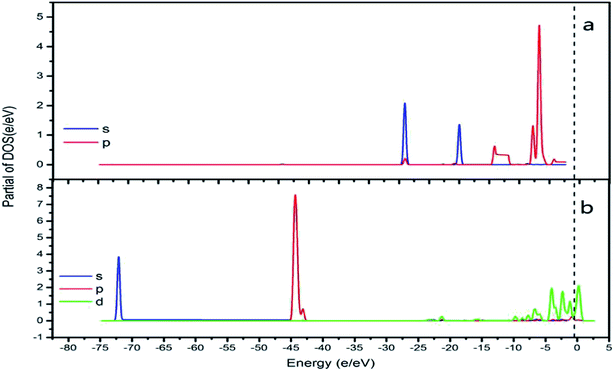
In addition, the relationship between oxide structure and newly formed covalent bond can be found by PDOS (projected density of states) which can be seen at the Fig. 15 and 16. Usually, there are three bonding principle to construct molecular orbital (MO) by atom orbital (AO):26 (1) symmetry matching; (2) closely energy level; (3) maximum overlap of atom orbital. In this paper, we calculate the PDOS of O2 on CrOOH (101) surface and O2 on Cr(OH)3 adsorption model. By Fig. 15, distributing the energy of O2 into three main regions:27 (a) O2-bonding region of σ and  orbital (−7.5 eV to −3 eV); (b) O2-antibonding region of
  orbital (−2.5 eV to 0.5 eV); (c)
  and
and  - antibonding region (0.5 eV to 5 eV). While, the individual O2 atom states of Cr(OH)3 is more narrow than CrOOH model. The resonance peaks of CrOOH and O2 model is concentrate on (−5 eV to −3 eV) closed to Fermi surface (from O2 (s) orbital collaborating with Cr (d) orbital), and the resonance peaks of Cr(OH)3 and O2 model is overlapped in (−7.5 eV to −5 eV) far away from Fermi surface illustrating more bonding energy than CrOOH.
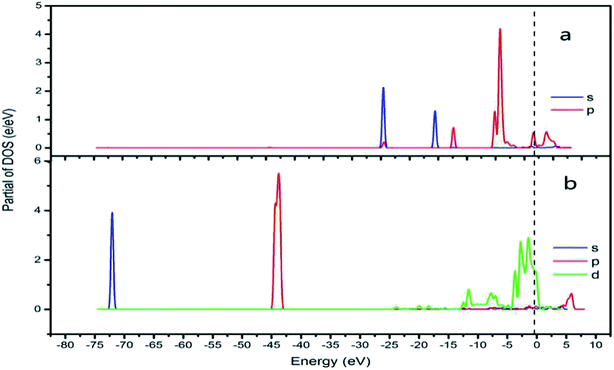 | ||
| Fig. 15 CrOOH (101) surface PDOS (a) O2 PDOS of s and p orbital; (b) Cr PDOS of s, p and d orbital). | ||
In adsorption process, adsorption electrons has accumulated on the O2 2π* orbitals.28 The highly density of electrons on Cr is polarized to maximize the electron interaction between the negative O2 and Cr interaction. With a few resonance peaks around Fermi level, which are found to be the mixing states between the d-Cr-O2 model and the O2  orbitals, we can see the d(Cr)–O2
  mixing orbitals possesses clear covalent bonding characteristics between Cr(OH)3/CrOOH and O2.
Furthermore, the empty d-states of the Cr (−5 eV of CrOOH surface and Cr(OH)3) is mixing with O2  orbitals, which further lower the O2
  orbitals energy level and improve the stability of adsorption process.
4. Conclusion
(1) Based on the reoxidation experiment and chemical kinetic analyze of Cr(III). The oxidation rate of Cr(III) in air without MnO2 and H2O2 was studied. As setting the reductive sample within different pH and temperature, both the CrOOH and Cr(OH)3 has the potential to be oxidized in wet alkaline environment while remain stable in neutral or acid condition. In addition, the chemical reaction equilibrium constant K of CrOOH is higher than Cr(OH)3. Besides, the SEM and XPS result of Cr(III) has illustrated that the CrOOH is more easily to be oxidized than Cr(OH)3.(2) Based on the thermodynamic computation, the pH–ΔG diagram of 298 K with certain ionic activity has showing the principle in oxidized reaction of CrOOH and Cr(OH)3. Both CrOOH and Cr(OH)3 can convert to CrO42− under alkaline environment, but CrOOH has more potential to be oxidized to CrO42− in pH (11.5–14). However, the Cr(OH)3 are more stable, and they have difficulty with oxidizing to CrO42− except in the pH (14) with lower CrO42− activity of 0.00000001.
(3) By using DFT method, we has constructed different crystal model of CrOOH and Cr(OH)3. Comparing with the adsorption energy and Cr–O bond, CrOOH are prone to react with oxygen than Cr(OH)3. While the distance between Cr and O in (110) adsorption surface is over 3 Å, which is more likely to occur a van der Waals' interaction. Moreover, the DOS and PDOS diagram illustrate the Cr–O covalent bond has been made through the process of adsorption, and the resonance peak of Cr and O atom closed to Fermi energy, vividly showing the mixing orbitals of Cr (d) and O2  has been made through the reaction between Cr(III) and oxygen.
Conflicts of interest
There are no conflicts to declare.Acknowledgements
This work was financially supported by the National Key R&D Program of China (Grant No. SQ2018YFC180012).Notes and references
- D. J. Paustenbach, B. L. Finley, F. S. Mowat and B. D. Kerger, J. Toxicol. Environ. Health, Part A, 2003, 66(14), 1295–1339 CrossRef CAS PubMed.
- K. Kitagishi and I. Yamane, J. Environ. Qual., 1981, 12, 426 Search PubMed.
- I. Aharchaou, M. Rosabal, F. Liu, E. Battaglia and C. Fortin, Aquat. Toxicol., 2016, 182, 49 CrossRef PubMed.
- A. Davis and R. L. Olsen, Groundwater, 2010, 33, 759–768 CrossRef.
- J. S. Geelhoed, J. C. L. Meeussen, D. G. Lumsdon, S. Hillier, M. J. Roe, R. P. Thomas, R. J. F. Bewley, J. G. Farmer and E. Paterson, Environ. Geochem. Health, 2001, 23, 261–265 CrossRef CAS.
- R. R. Patterson and S. Fendorf, J. Environ. Sci. Technol., 1997, 31, 2039–2044 CrossRef CAS.
- M. Pettine, F. J. Millero and R. Passino, Mar. Chem., 1994, 46, 335–344 CrossRef CAS.
- C. Kim, Q. Zhou, B. Deng, E. C. Thornton and H. Xu, Environ. Sci. Technol., 2001, 35, 2219–2225 CrossRef CAS PubMed.
- C. Kim, Y. Lan and B. Deng, Geochem. J., 2007, 41(6), 397–405 CrossRef CAS.
- A. R. Wadhawan, A. T. Stone and E. J. Bouwer, Environ. Sci. Technol., 2013, 47, 130724102802006 CrossRef PubMed.
- C. Oze, D. K. Bird and S. Fendorf, Proc. Natl. Acad. Sci. U. S. A., 2007, 104(16), 6544–6549 CrossRef CAS PubMed.
- M. Chrysochoou, D. R. Ferreira and C. P. Johnston, J. Hazard. Mater., 2010, 179, 650–657 CrossRef CAS PubMed.
- Z. Zhang, L. Rao, D. Rai and S. B. Clark, MRS Online Proc. Libr., 2004, 824, CC6.5 CrossRef.
- F. Dik, J. Farid, M. Guillaume, O. Luca, C. Andrea, S. M. Webb, A. Jean-Paul, F. Emmanuel, G. Fran?Ois and G. E. Brown, Environ. Sci. Technol., 2009, 43, 7384–7390 CrossRef PubMed.
- N. Miyata, Y. Tani, M. Sakata and K. Iwahori, J. Biosci. Bioeng., 2007, 104, 1–8 CrossRef CAS PubMed.
- R. Serramaia, M. Bellier, S. Chastka, K. Tranhuu, A. Subowo, J. D. Rimstidt, P. M. Usov, A. J. Morris and F. M. Michel, ACS Appl. Mater. Interfaces, 2018, 10, 21224–21234 CrossRef CAS PubMed.
- A. D. Bokare and W. Choi, J. Hazard. Mater., 2014, 275, 121–135 CrossRef CAS PubMed.
- R. Allmann and R. Hinek, Acta Crystallogr., 2010, 63, 412–417 CrossRef PubMed.
- J. Gmehling, Chem. Ing. Tech., 1978, 50, 933 CrossRef.
- M. Selleby, M. Hillert and J. Ågren, CALPHAD: Comput. Coupling Phase Diagrams Thermochem., 2011, 35, 342–345 CrossRef CAS.
- I. E. Dzyaloshinskii, E. M. Lifshitz and L. P. Pitaevskii, Adv. Phys., 1961, 10, 165–209 CrossRef.
- D. Rabinovich, J. Chem. Educ., 2003, 80, 1015–1020 CrossRef.
- D. Tudela and V. Fernández, J. Chem. Educ., 2003, 80, 1381 CrossRef CAS.
- H. Fukuyama, Phys. Rev. B: Solid State, 1978, 17, 535–541 CrossRef CAS.
- S. Chrétien and H. Metiu, J. Chem. Phys., 2008, 129, 074705 CrossRef PubMed.
- I. N. Levine, Quantum Chemistry: International Edition, Pearson Schweiz Ag, 2013 Search PubMed.
- M. D. Johannes, S. L. Karen and T. L. Corey, Solid State Ionics, 2016, 83–89 CrossRef CAS.
- A. Kistanov, Y. Cai, D. Kripalani, K. Zhou, S. Dmitriev and Y. W. Zhang, J. Mater. Chem. C, 2018, 4308–4317 RSC.
Footnote |
| † Electronic supplementary information (ESI) available. See DOI: 10.1039/d0ra01403f |
| This journal is © The Royal Society of Chemistry 2020 |

