 Open Access Article
Formation kinetics of Sr0.25Ba0.75Nb2O6 and Li2B4O7 crystals from 0.25SrO–0.75BaO–Nb2O5–Li2O–2B2O3 glass
Chang Gyu Baeka,
Young Hoon Rim*b,
Jae-Hyeon Koc,
Chang-Seok Kimd and
Yong Suk Yang *a
*a
aDepartment of Nanoenergy Engineering, College of Nanoscience and Nanotechnology, Pusan National University, Busan 46241, South Korea. E-mail: ysyang@pusan.ac.kr; Fax: +82-51-514-2358; Tel: +82-51-510-2796
bCollege of Liberal Arts, Semyung University, Chungbuk 27136, South Korea. E-mail: yrim@semyung.ac.kr
cDepartment of Physics, Nano Convergence Technology Center, Hallym University, Gangwondo 24252, South Korea
dDepartment of Cogno-Mechatronics Engineering, Pusan National University, Busan 46241, South Korea
First published on 7th April 2020
Abstract
We have investigated the transition kinetics of Sr0.25Ba0.75Nb2O6 (SBN) and Li2B4O7 (LBO) crystals from 0.25SrO–0.75BaO–Nb2O5–Li2O–2B2O3 (SBNLBO) glass under isothermal and non-isothermal processes. With increasing temperature, there are two consecutive steps of crystallization of SBN and LBO from the glass. The Johnson–Mehl–Avrami function indicates that the crystallization mechanism of SBN belongs to an increasing nucleation rate with diffusion-controlled growth. The crystallite size of SBN ranges from 40 to 140 nm but it is confined to within 30–45 nm for LBO during the whole crystallization process. The relationship between the nano size and strain of SBN based on the Williamson–Hall method, and the change of activation energies of SBN and LBO crystallization analyzed by using the isoconversional model are discussed. A comparison of phonon modes between as-quenched glass and fully transformed crystals clearly shows that the low dimensional vibration modes in the structurally disordered glass change to highly dimensional network units with the formation of crystals.
1. Introduction
Strontium barium niobate crystals normally exist in the form of the chemical compound (SrxBa1−x)Nb2O6 (xSBN) for 0.25 ≤ x ≤ 0.75 and the ferroelectric P4bm tetragonal form of xSBN at room temperature transforms to paraelectric tetragonal P4b2 at Tc = 60–250 °C, depending on x.1,2 xSBN ceramics have been especially developed for energy storage capacitors because of their high dielectric constant εr and relatively low dielectric loss tan![[thin space (1/6-em)]](https://www.rsc.org/images/entities/char_2009.gif) δ. At 10 KHz, these values are εr = 400 and 2700, and tan
δ. At 10 KHz, these values are εr = 400 and 2700, and tan![[thin space (1/6-em)]](https://www.rsc.org/images/entities/char_2009.gif) δ = 0.08 and 0.1 for x = 0.25 and 0.75, respectively.3,4 They have also been gaining interest as a thermoelectric material due to their low thermal conductivity and large thermoelectric power factor. Nonlinear-optical and electro-optical properties of xSBN with a high piezoelectric coefficient value can be applied for the commercialization of domain patterning.5–10 In spite of their excellent applicability, the synthesis of xSBN ceramics is known to be complicated by the hydrolysis and moisture of the niobium compound, with easy formation of an unexpected BaNb2O6 crystal phase for the Ba rich xSBN compound, and thus recent studies have been performed on the formation of thin films to avoid these difficulties.11–13
δ = 0.08 and 0.1 for x = 0.25 and 0.75, respectively.3,4 They have also been gaining interest as a thermoelectric material due to their low thermal conductivity and large thermoelectric power factor. Nonlinear-optical and electro-optical properties of xSBN with a high piezoelectric coefficient value can be applied for the commercialization of domain patterning.5–10 In spite of their excellent applicability, the synthesis of xSBN ceramics is known to be complicated by the hydrolysis and moisture of the niobium compound, with easy formation of an unexpected BaNb2O6 crystal phase for the Ba rich xSBN compound, and thus recent studies have been performed on the formation of thin films to avoid these difficulties.11–13
Li2B4O7 (LBO) crystal is a non-ferroelectric and piezoelectric material at room temperature, it belongs to a tetragonal symmetry 4 mm with a = b = 9.477, c = 10.286 Å. LBO crystal is a commonly used material in surface acoustic wave substrate, nonlinear devices for frequency conversion in the ultraviolet region, and piezoelectric actuator.14,15
One of the advantages of using a glass in synthesizing a crystalline composite material, which is considered to be any multiphase material made from constituents with different physical or chemical properties, is that the produced crystalline constituents are evenly formed in the sense of size and network structure because atoms or molecules in a glass state are isotropically distributed. Intensive studies on the formation of nanocrystals during crystallization of metallic glasses, such as the preparation of nanocrystalline alloy by devitrification, the preferential precipitation sequence of metastable phase during crystallization, and the self-organized nanocrystalline stripe patterns generated during early crystallization of a nonequilibrium metallic glass, have been reported.16–18 As is known, Ba-rich Sr0.25Ba0.75Nb2O6 crystal is not easily formed as a bulk and accompanies an undesired crystal phase such as BaNb2O6 during synthesis, caused by structural instability.
One of the aims of this study is to make a Ba-rich strontium niobate-contained glass with the addition of a glass former because the strontium niobate glass itself is rarely formed, and then obtain oxide composite from the glass. The other is the investigation of crystallization kinetics not only in the view of scientific importance but also because the size and volume fraction of crystallites can be easily controlled for application, once the crystallization mechanism is well understood.
The primary chemical composition chosen for our research is 0.25SrO–0.75BaO–Nb2O5–Li2O–2B2O3. The mixture is melted, rapidly cooled, and we finally obtain the glass. Both isothermal and non-isothermal methods for various measurements are carried out. Theoretical models are adopted to describe the transition mechanism from the glass to crystal. A comparison of local phonon modes between the glass and crystal is found to be so effective to understand the structural network ordering of crystal from a disordered glass state.
2. Experimental
SrCO3 (Sigma-Aldrich Chemistry, 99.9+%), BaCO3, Nb2O5 with the mole ratio 1![[thin space (1/6-em)]](https://www.rsc.org/images/entities/char_2009.gif) :
:![[thin space (1/6-em)]](https://www.rsc.org/images/entities/char_2009.gif) 3
3![[thin space (1/6-em)]](https://www.rsc.org/images/entities/char_2009.gif) :
:![[thin space (1/6-em)]](https://www.rsc.org/images/entities/char_2009.gif) 4 were well mixed for 1 h. This mixture and Li2B4O7 powder together were melted in a platinum crucible in an electric furnace at 1000 °C for 0.5 h and rapidly quenched onto a copper plate to produce a glass. The obtained sample was transparent with a yellow color. The formation of the glass was confirmed by using X-ray diffraction (XRD, Rigaku, Japan) with CuKα (λ = 1.5406 Å), differential scanning calorimetry and differential thermal analysis (DSC & DTA, Mac Sci., Japan). The crystal structures and grain sizes obtained from the crystallization of the glass were determined from the XRD Bragg peak measured with the step scan mode after 5 times repetition, in which the scan step width and the count time were 0.05° and 5 s. The non-isothermal crystallization kinetics of the glass was carried out by DTA and DSC under a pure argon atmosphere with the gas flow rate 100 cm3 min−1 and heating rates 4, 5, 6, 7, 8 and 10 °C min−1. TEM measurements were conducted with the applied voltage of 200 kV. The average crystallite sizes were calculated by using the Scherrer equation with XRD data and the image calculation of TEM. Raman spectroscopy (LabRAM HR Evolution, Horiba Jobin Yvon) measurements, with the 532 nm laser beam source in the wave number range 100 to 1100 cm−1, were conducted to investigate the phonon mode change between the glass and crystal phases.
4 were well mixed for 1 h. This mixture and Li2B4O7 powder together were melted in a platinum crucible in an electric furnace at 1000 °C for 0.5 h and rapidly quenched onto a copper plate to produce a glass. The obtained sample was transparent with a yellow color. The formation of the glass was confirmed by using X-ray diffraction (XRD, Rigaku, Japan) with CuKα (λ = 1.5406 Å), differential scanning calorimetry and differential thermal analysis (DSC & DTA, Mac Sci., Japan). The crystal structures and grain sizes obtained from the crystallization of the glass were determined from the XRD Bragg peak measured with the step scan mode after 5 times repetition, in which the scan step width and the count time were 0.05° and 5 s. The non-isothermal crystallization kinetics of the glass was carried out by DTA and DSC under a pure argon atmosphere with the gas flow rate 100 cm3 min−1 and heating rates 4, 5, 6, 7, 8 and 10 °C min−1. TEM measurements were conducted with the applied voltage of 200 kV. The average crystallite sizes were calculated by using the Scherrer equation with XRD data and the image calculation of TEM. Raman spectroscopy (LabRAM HR Evolution, Horiba Jobin Yvon) measurements, with the 532 nm laser beam source in the wave number range 100 to 1100 cm−1, were conducted to investigate the phonon mode change between the glass and crystal phases.
3. Results and discussion
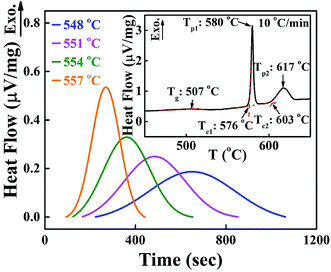
Fig. 1 shows the isothermal exothermic curves at 548, 551, 554 and 557 °C as a function of time duration, measured with DTA during the crystallization of the 0.25SrO–0.75BaO–Nb2O5–Li2O–B2O3 (SBNLBO) glass. The inset of the figure represents the non-isothermal crystallization curve with the heating rate of 10 °C min−1. Two exothermic peaks in the inset are originated from the latent heat release caused by the phase transition from the glass to crystals. As shown in Fig. 5, the 1st and 2nd exothermic peaks in the inset are correspondent to the occurrence of Sr0.25Ba0.75Nb2O6 (SBN) and Li2B4O7 (LBO) crystallization, respectively. The specific temperatures of the glass transition Tg, the onset of crystallization Tc and the maximum rate of crystallization Tp, are represented in the figure. The temperatures for carrying out isothermal measurements are selected in the supercooled liquid region which is defined as the temperature interval between Tg and Tc because the system's viscosity is low in this region and the atomic or molecular movements are active, and thus crystallization time can be short enough to detect heat release with thermal measurement equipment such as DTA and DSC.Fig. 2(a) shows the integrated exothermic heat of the DTA curve at each isothermal temperature as a function of time duration, obtained from Fig. 1, which is proportional to the transformed crystalline SBN volume fraction from the SBNLBO glass. The transformation kinetics under isothermal condition can be described with the Johnson–Mehl–Avrami (JMA) equation written as follows,19,20
| x(t) = 1 − exp [−(t/τ)n] | (1) |
 | (2) |
![[thin space (1/6-em)]](https://www.rsc.org/images/entities/char_2009.gif) t = −ln(fo/v(x)) + E/kBT, where v(x) is the integration of rate equation and fo the pre-exponential frequency factor, and we can obtain E from the slope of the plot ln
t = −ln(fo/v(x)) + E/kBT, where v(x) is the integration of rate equation and fo the pre-exponential frequency factor, and we can obtain E from the slope of the plot ln![[thin space (1/6-em)]](https://www.rsc.org/images/entities/char_2009.gif) t vs. 1/T at each x. The isothermal process to obtain E from the slope mentioned above at x = 0.4, for the different 4 isothermal temperatures, is shown in the inset of Fig. 2(b). The energy values in the figure, through the whole process of SBN crystallization of the SBNLBO glass, range 5.3–5.7 eV within 10% against the average value of 5.5 eV, indicating that the crystallization time–temperature-transition relationship from the glass is relatively well kept through the entire crystallization process. In the case of the JMA model of thermally activated reaction kinetics in homogeneous systems, written in eqn (1) and (2), the activation energy E and pre-exponential factor ko are assumed not to vary during phase transition. But it is known that those parameters may vary with the progressive change of x, caused by complex reactions, the heterogeneity of the samples, defect formation, reactivity change, and the variation of those characteristics can be recognized by the isoconversion E variation.23,24 Although E do not change drastically through the whole process of transformation, yet the result of a little E change indicates that the SBN crystallization kinetics in the SBNLBO glass involves one or more minor effects mentioned above.
t vs. 1/T at each x. The isothermal process to obtain E from the slope mentioned above at x = 0.4, for the different 4 isothermal temperatures, is shown in the inset of Fig. 2(b). The energy values in the figure, through the whole process of SBN crystallization of the SBNLBO glass, range 5.3–5.7 eV within 10% against the average value of 5.5 eV, indicating that the crystallization time–temperature-transition relationship from the glass is relatively well kept through the entire crystallization process. In the case of the JMA model of thermally activated reaction kinetics in homogeneous systems, written in eqn (1) and (2), the activation energy E and pre-exponential factor ko are assumed not to vary during phase transition. But it is known that those parameters may vary with the progressive change of x, caused by complex reactions, the heterogeneity of the samples, defect formation, reactivity change, and the variation of those characteristics can be recognized by the isoconversion E variation.23,24 Although E do not change drastically through the whole process of transformation, yet the result of a little E change indicates that the SBN crystallization kinetics in the SBNLBO glass involves one or more minor effects mentioned above.
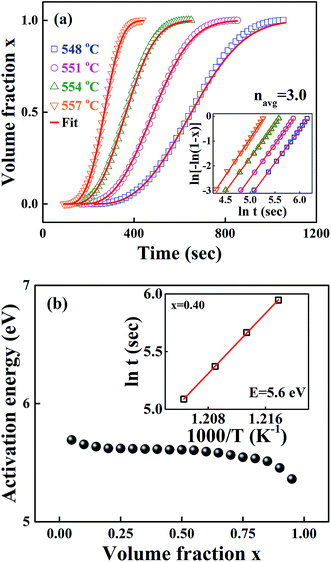 | ||
Fig. 2 (a) Normalized integrated heat flow of each exothermic peak at different temperatures from Fig. 1, which is directly proportional to the SBN crystal volume fraction transformed from the SBNLBO glass. The symbols are data and the lines are the fit with the JMA model of eqn (1). (b) Isothermal isoconversion plot during the SBN crystallization. Crystallization activation energy E through the entire transition is shown within 10% change with the average value of 5.5 eV. The inset of the figure shows the process to obtain E from the slope of the plot ln![[thin space (1/6-em)]](https://www.rsc.org/images/entities/char_2009.gif) t vs. 1/T at crystallized volume fraction x = 0.4. t vs. 1/T at crystallized volume fraction x = 0.4. | ||
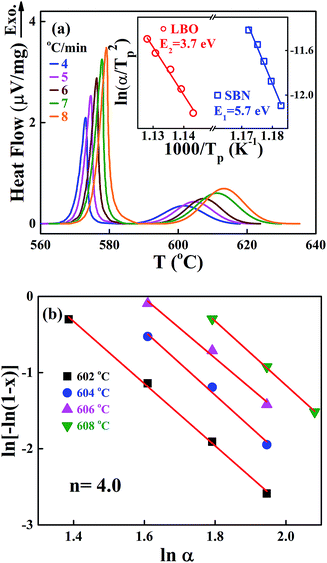
We also performed non-isothermal DTA measurements on the crystallization of the SBNLBO glass. The result of exothermic heat flow with the heating rates of 4, 5, 6, 7, 8 °C min−1 is shown in Fig. 3(a), where the first and second exothermic curves correspond to the occurrence of SBN and LBO crystallization, respectively. The inset of the figure shows the process to obtain crystallization activation energy E with the Kissinger model. The Kissinger equation of non-isothermal application with a constant heating rate is written as d(ln![[thin space (1/6-em)]](https://www.rsc.org/images/entities/char_2009.gif) α/Tp2)/d(1/Tp) = −E/R,25,26 where, the exothermic peak temperature Tp is the temperature when crystallization rate becomes maximum and R is the gas constant, α is the heating rate, and activation energy E is obtained from the slope of plotting ln
α/Tp2)/d(1/Tp) = −E/R,25,26 where, the exothermic peak temperature Tp is the temperature when crystallization rate becomes maximum and R is the gas constant, α is the heating rate, and activation energy E is obtained from the slope of plotting ln![[thin space (1/6-em)]](https://www.rsc.org/images/entities/char_2009.gif) α/Tp2 vs. 1/Tp. The activation energy 5.7 eV for SBN crystallization is very close to the value 5.6 eV obtained from the isothermal process at x = 0.4 and to the values through the wide range of x as well in Fig. 2(b), suggesting the validity of application of this equation to describe transition kinetics from the SBNLBO glass. The JMA model of eqn (1) is originally derived for isothermal reaction kinetics and the exponent n reflects the nature of the transformation mechanism concerning nucleation and growth. Nevertheless, the isothermal method is often limited by restrictions on the temperature regions experimentally available because of time duration or detection limit. The non-isothermal method can overcome these measurement difficulties and allow us to elucidate reaction parameters E and n. Fig. 3(b) is the plot to obtain the Avrami exponent n using the modified Ozawa equation, one of the non-isothermal models, for the second crystallization of LBO with the heating rates of 4, 5, 6, 7, 8 °C min−1. The model27 is written as ln[−ln(1 − x)] = −1.052 mE/RT − n
α/Tp2 vs. 1/Tp. The activation energy 5.7 eV for SBN crystallization is very close to the value 5.6 eV obtained from the isothermal process at x = 0.4 and to the values through the wide range of x as well in Fig. 2(b), suggesting the validity of application of this equation to describe transition kinetics from the SBNLBO glass. The JMA model of eqn (1) is originally derived for isothermal reaction kinetics and the exponent n reflects the nature of the transformation mechanism concerning nucleation and growth. Nevertheless, the isothermal method is often limited by restrictions on the temperature regions experimentally available because of time duration or detection limit. The non-isothermal method can overcome these measurement difficulties and allow us to elucidate reaction parameters E and n. Fig. 3(b) is the plot to obtain the Avrami exponent n using the modified Ozawa equation, one of the non-isothermal models, for the second crystallization of LBO with the heating rates of 4, 5, 6, 7, 8 °C min−1. The model27 is written as ln[−ln(1 − x)] = −1.052 mE/RT − n![[thin space (1/6-em)]](https://www.rsc.org/images/entities/char_2009.gif) ln
ln![[thin space (1/6-em)]](https://www.rsc.org/images/entities/char_2009.gif) α + const, where α is the heating rate and m is the dimension-related constant, and the plot ln[−ln(1 − x)] vs. ln
α + const, where α is the heating rate and m is the dimension-related constant, and the plot ln[−ln(1 − x)] vs. ln![[thin space (1/6-em)]](https://www.rsc.org/images/entities/char_2009.gif) α gives n. The value n = 4.0 shown in the figure indicates that the system is in a constant nucleation with the interface controlled growth.21
α gives n. The value n = 4.0 shown in the figure indicates that the system is in a constant nucleation with the interface controlled growth.21
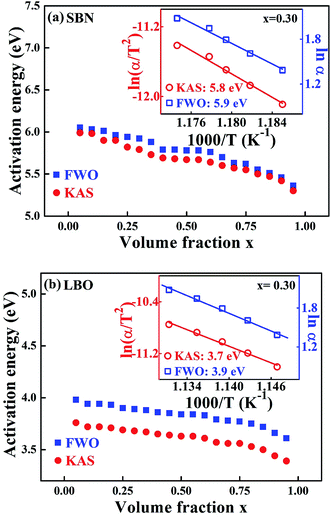
Fig. 4 is the non-isothermal isoconversional plot of E for SBN and LBO crystallization as a function of crystallized volume fraction, obtained from the measured data in Fig. 3(a) with Kissinger–Akahira–Sunose (KAS) and Flynn–Wall–Ozawa (FWO) models. The KAS and FWO models are described as ln(αi/Tx,i2) = const − Ex/RTx,i and ln![[thin space (1/6-em)]](https://www.rsc.org/images/entities/char_2009.gif) αi = const – 1.052Ex/RTx,i, respectively. Ex is obtained as a slope of the linear plot ln
αi = const – 1.052Ex/RTx,i, respectively. Ex is obtained as a slope of the linear plot ln![[thin space (1/6-em)]](https://www.rsc.org/images/entities/char_2009.gif) αi against 1/Tx,i for the FWO model and ln(αi/Tx,i2) against 1/Txi for KAS model, where subscript i is the ordinal number of an experiment carried out at a given heating rate.28,29 By repeating the procedure for a set of different x we obtain a dependence of Ex on x. Activation energies in Fig. 4(a), 5.3–6.1 eV for the SBN crystallization, are very close to the values obtained from the isothermal process in Fig. 3(b). The non-isothermal isoconversion result for the second crystallization of LBO in Fig. 4(b) exist in the range 3.4–4.0 eV. The activation energies as a function of x obtained by using the isoconversional model, whether the process is isotherm or non-isotherm, do not much deviate from the average values within 10%, indicating that nucleation and growth keep their processes without drastic change through the whole crystallization interval.
αi against 1/Tx,i for the FWO model and ln(αi/Tx,i2) against 1/Txi for KAS model, where subscript i is the ordinal number of an experiment carried out at a given heating rate.28,29 By repeating the procedure for a set of different x we obtain a dependence of Ex on x. Activation energies in Fig. 4(a), 5.3–6.1 eV for the SBN crystallization, are very close to the values obtained from the isothermal process in Fig. 3(b). The non-isothermal isoconversion result for the second crystallization of LBO in Fig. 4(b) exist in the range 3.4–4.0 eV. The activation energies as a function of x obtained by using the isoconversional model, whether the process is isotherm or non-isotherm, do not much deviate from the average values within 10%, indicating that nucleation and growth keep their processes without drastic change through the whole crystallization interval.
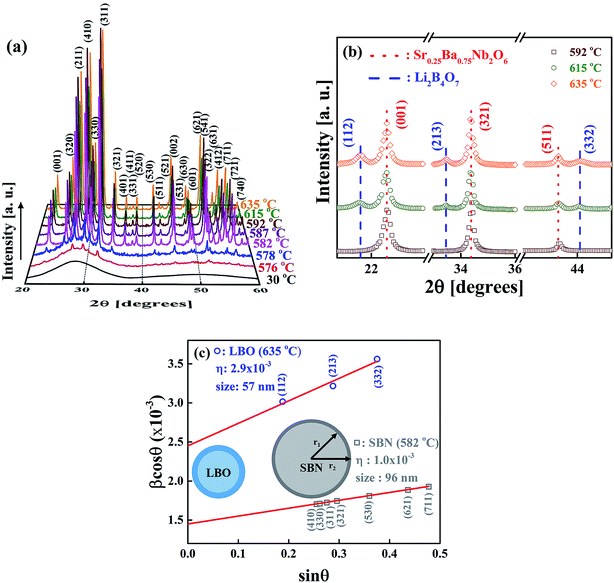
Fig. 5(a) shows the XRD patterns measured at room temperature for the rapidly cooled samples when temperatures of the as-quenched SBNLBO glass reach to 576, 578, 582, 587, 592, 615, 635 °C with the heating rate 10 °C min−1. The XRD pattern at 30 °C is from the SBNLBO glass. At the first crystallization in the temperature range 576–592 °C (ref. the inset of Fig. 1), a tetragonal SBN with the lattice parameters a = 12.508 Å, c = 3.957 Å appears. At the second stage of crystallization from the onset temperature 603 °C (ref. the inset of Fig. 1), a tetragonal LBO with the lattice parameters a = 9.486 Å, c = 10.328 Å starts to appear and the XRD peak intensities of LBO increase, while the XRD patterns of SBN remain without change with the increase of temperature. This indicates that the 0.25SrO–0.75BaO–Nb2O5–Li2O–B2O3 (SBNLBO) glass stoichiometrically transforms into Sr0.25Ba0.75Nb2O6 (SBN) and Li2B4O7 (LBO) crystals. The whole phase transformation process can be simply written as SBNLBO glass → SBN crystallization + LBO glass → LBO crystallization + SBN crystal, and all the glass compositions fully participate in crystallization. Finally, the SBN and LBO crystal phases coexist as a composite. In Fig. 5(a), we only show the Miller indices corresponding to the Bragg peaks of SBN crystal. The scattering intensity of SBN crystal is much pronounced compared with those of LBO crystal and the Bragg peaks of LBO crystal in Fig. 5(a) are hardly seen, caused by the small atomic scattering factors for low atomic numbers constituting LBO crystal. The experimental condition of XRD measurements of Fig. 5(a) was the step scan mode with the scan step width 0.05° and the count time 5 s. We improved the XRD intensity and statics by increasing the measurement time to find the XRD patterns for LBO crystal. Fig. 5(b) is the XRD patterns after 5 times repetition of measurement with the same condition described in Fig. 5(a). The LBO Bragg peaks (112), (213) and (332) at the diffraction angles 21.7°, 33.5° and 44.0°, respectively, clearly appear at the elevated temperatures of 615 and 635 °C. In the figure, it is observed that LBO crystallization still doesn't occur at 592 °C, as can also be recognized from the thermal measurement on the inset of Fig. 1. It is normally accepted that the broadening of XRD Bragg peak width at different Miller indices is originated from the scattering of small grains. Strain gives rise to the distortion of lattice parameters and it increases with the decrease of grain size because the surface tension is larger for smaller crystallites. And thus X-ray scattering from the strain effect also contributes to the XRD peak broadening. One of the models to separate the size and strain effects is Williamson–Hall analysis.30,31 In the model the full width at half maximum of the Bragg peak β is written as β = βsize + βstrain = λ/(D![[thin space (1/6-em)]](https://www.rsc.org/images/entities/char_2009.gif) cos
cos![[thin space (1/6-em)]](https://www.rsc.org/images/entities/char_2009.gif) θ) + η
θ) + η![[thin space (1/6-em)]](https://www.rsc.org/images/entities/char_2009.gif) tan
tan![[thin space (1/6-em)]](https://www.rsc.org/images/entities/char_2009.gif) θ, where βsize and βstrain are the size and strain effects, respectively, and η is the apparent strain. By plotting β
θ, where βsize and βstrain are the size and strain effects, respectively, and η is the apparent strain. By plotting β![[thin space (1/6-em)]](https://www.rsc.org/images/entities/char_2009.gif) cos
cos![[thin space (1/6-em)]](https://www.rsc.org/images/entities/char_2009.gif) θ against sin
θ against sin![[thin space (1/6-em)]](https://www.rsc.org/images/entities/char_2009.gif) θ for different Bragg peaks, we can obtain the grain size λ/D from the intercept of a linear extrapolation and the strain η from the slope. The Williamson–Hall plot, for the SBN and LBO crystallites quenched at 582 °C and 635 °C respectively, is shown in Fig. 5(c). As can be seen in the figure, the size and strain of SBN are 96 nm and 1.0 × 10⁻³ (0.1%) and those values of LBO are 57 nm and 2.9 × 10⁻³. In the case when the strain effect is not considered for XRD peak broadening, as depicted in Fig. 6, the grain sizes of SBN and LBO are 86 nm and 42 nm at the same conditions in Fig. 5(c). This indicates that more than 10% of XRD peak broadening is originated from strain effect. It is also observed that the value of strain, from the size–strain relationship of the SBN and LBO, becomes larger for the smaller grain size. We can figure out the strain ratio for the small particles having different grain sizes. In the case when a grain shape is spherical, a strain can be set as proportional to 1/R32 with R the radius of particle, then the total strain is
θ for different Bragg peaks, we can obtain the grain size λ/D from the intercept of a linear extrapolation and the strain η from the slope. The Williamson–Hall plot, for the SBN and LBO crystallites quenched at 582 °C and 635 °C respectively, is shown in Fig. 5(c). As can be seen in the figure, the size and strain of SBN are 96 nm and 1.0 × 10⁻³ (0.1%) and those values of LBO are 57 nm and 2.9 × 10⁻³. In the case when the strain effect is not considered for XRD peak broadening, as depicted in Fig. 6, the grain sizes of SBN and LBO are 86 nm and 42 nm at the same conditions in Fig. 5(c). This indicates that more than 10% of XRD peak broadening is originated from strain effect. It is also observed that the value of strain, from the size–strain relationship of the SBN and LBO, becomes larger for the smaller grain size. We can figure out the strain ratio for the small particles having different grain sizes. In the case when a grain shape is spherical, a strain can be set as proportional to 1/R32 with R the radius of particle, then the total strain is  . We apply this method to experimental results. If we choose the integration intervals a and b to be the half of the grain sizes with and without considering strain effects in the experimental results mentioned above, 21–28.5 nm for LBO and 43–48 nm for SBN, we can obtain the integrated value of ∼2.8 times higher for LBO compared to that of SBN, which is very close to the experimental result of 2.9. Schematic spherical shapes are presented in Fig. 5(c) where the outer sphere corresponds to the case when the strain effect is considered.
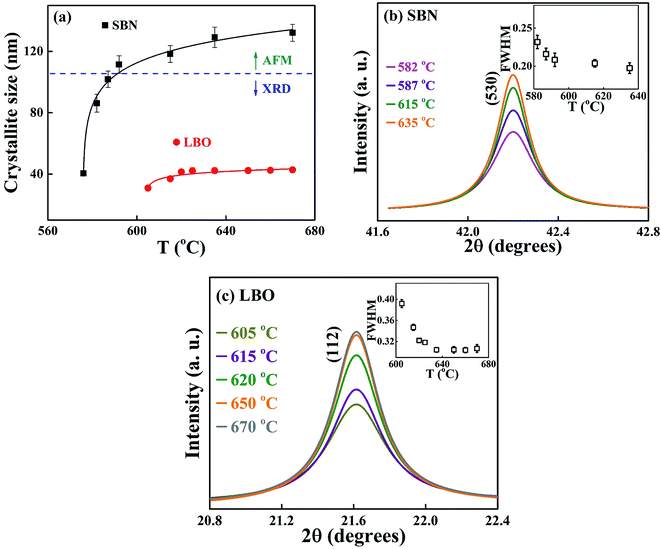
Fig. 6(a) shows the change of the grain sizes of SBN and LBO crystals as a function of annealing temperature. Fig. 6(b) and (c) are the magnified Bragg XRD patterns for SBN(530) and LBO(112) to show the evolution of peak narrowing with increasing temperature, caused by the growth of SBN and LBO crystallites, respectively. The size of small crystal grains appearing in the XRD Bragg patterns can be calculated using the Scherrer equation D = pλ/β![[thin space (1/6-em)]](https://www.rsc.org/images/entities/char_2009.gif) cos
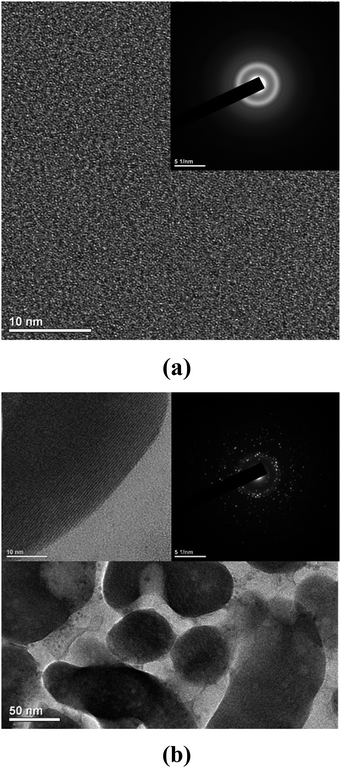
cos![[thin space (1/6-em)]](https://www.rsc.org/images/entities/char_2009.gif) θ, where D is the crystallite size, λ the X-ray wavelength, p the shape factor and is set as 1.0, β the full width half maximum (FWHM) of Bragg peak and θ the scattering angle. The instrumental XRD peak broadening is corrected in calculating grain size using the relation β = [βM2 + βI2]1/2, where βM and βI are the measured and instrumental values of FWHM, respectively. As indicated as a horizontal dotted line in Fig. 6(a), for the large crystallites of the SBN phase above 590 °C, TEM is used because the accuracy determining the grain size using the Scherrer equation with XRD patterns normally deviates over ∼100 nm. As can be seen in the figure, the small 40 nm crystallite of SBN at 576 °C grows up to 140 nm at 670 °C. Meanwhile, the LBO crystallites remain as small sizes within 30–45 nm in the temperature range 605–670 °C. The change of the grain size in Fig. 6(a) indicates that the SBN crystallization process from the SBNLBO glass is governed by nucleation and growth, but the growth process of LBO is restricted and nucleation is dominant on its crystallization.
θ, where D is the crystallite size, λ the X-ray wavelength, p the shape factor and is set as 1.0, β the full width half maximum (FWHM) of Bragg peak and θ the scattering angle. The instrumental XRD peak broadening is corrected in calculating grain size using the relation β = [βM2 + βI2]1/2, where βM and βI are the measured and instrumental values of FWHM, respectively. As indicated as a horizontal dotted line in Fig. 6(a), for the large crystallites of the SBN phase above 590 °C, TEM is used because the accuracy determining the grain size using the Scherrer equation with XRD patterns normally deviates over ∼100 nm. As can be seen in the figure, the small 40 nm crystallite of SBN at 576 °C grows up to 140 nm at 670 °C. Meanwhile, the LBO crystallites remain as small sizes within 30–45 nm in the temperature range 605–670 °C. The change of the grain size in Fig. 6(a) indicates that the SBN crystallization process from the SBNLBO glass is governed by nucleation and growth, but the growth process of LBO is restricted and nucleation is dominant on its crystallization.
Fig. 7 shows the transmission electron microscope (TEM) images and the selected area electron diffraction (SAED) patterns for the (a) as quenched glass and (b) partially crystallized sample with nanograins.
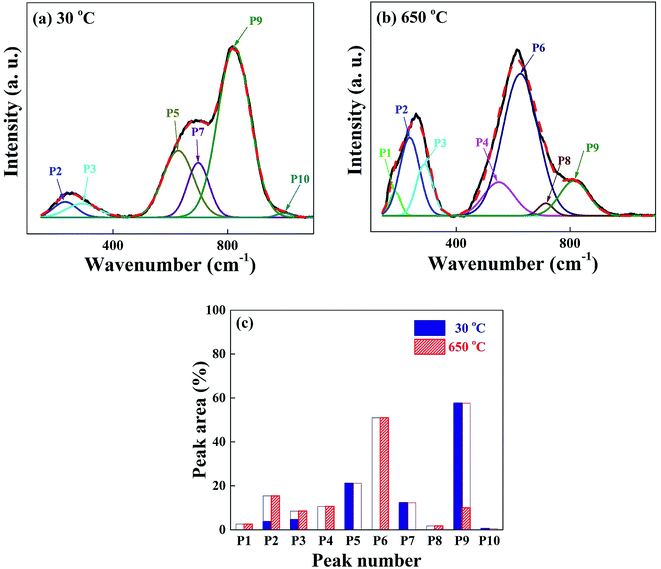
We have carried out Raman spectroscopy measurements to investigate the change of phonon modes between the glass at 30 °C and the crystal at 650 °C, and the spectra are shown in Fig. 8(a) and (b). The wave number scanned in each figure is in the same range 150–1100 cm−1 and the scattering intensities are normalized for the easy comparison of different spectra. The spectra are investigated in detail with the deconvolution of 10 peaks as labelled in the figure as P1–P10. The vibration modes corresponding to those peaks are assigned as follows; P1 (centered at 190 cm−1): bending vibration of the BO4 tetrahedra,33 P2 and P3 (240 and 290 cm−1): O–Nb–O bending vibration of distorted NbO6 octahedra,34 P4 (550 cm−1): Nb–O stretching of NbO6 octahedra,35 P5 (620 cm−1): Nb–O stretching of less distorted NbO6 octahedra with non-bridging oxygen,36 P7 (690 cm−1): Nb–O stretching of less distorted NbO6 octahedra with non-bridging oxygen,36 P8 (710 cm−1): B–O stretching of BO3 asymmetric planar deformation,33 P10 (995 cm−1): stretching of Nb![[double bond, length as m-dash]](https://www.rsc.org/images/entities/char_e001.gif) O double bond.35 The spectral line shape of as-quenched glass in Fig. 8(a) is very different from the crystalline one in Fig. 8(b). Various vibrational modes existing in the disordered glass network structures originated from the low dimensional arrangement or distorted units of atoms and molecules are overlapped and the spectral line shape is appeared broad in Fig. 8(a). The largest intensity peak P9 centered at 820 cm−1 in the glass state can be mostly assigned to the vibration of Nb–O stretching mode of much distorted NbO6 octahedra.37 With the formation of SBN + LBO crystals at 650 °C, the intensity of P9 in the glass phase drastically decreases, meanwhile, the peak P6 centered at 640 cm−1 which is assigned as symmetric Nb–O stretching vibration of NbO6 octahedra with 3-dimensional network strongly increases.38 This indicates that Nb–O branch is very Raman scattering sensitive in the system during crystallization and the change in vibration energy and intensity can be a direct representation of transition from the disordered glass network to high dimensional crystal structure. It is observed that the Raman scattering intensity from both Li2O–2B2O3 glass and LBO crystal are so weak compared with the scattering from Nb–O, and it is hardly seen in the spectra. But we can still identify the occurrence of the LBO crystalline modes of P1 and P8 at 650 °C. The simplified view of the intensity changes of Raman spectra P1–P10 for the glass and crystal phases is shown in Fig. 8(c) as a bar graph, and the drastic change in vibration modes can be easily found.
O double bond.35 The spectral line shape of as-quenched glass in Fig. 8(a) is very different from the crystalline one in Fig. 8(b). Various vibrational modes existing in the disordered glass network structures originated from the low dimensional arrangement or distorted units of atoms and molecules are overlapped and the spectral line shape is appeared broad in Fig. 8(a). The largest intensity peak P9 centered at 820 cm−1 in the glass state can be mostly assigned to the vibration of Nb–O stretching mode of much distorted NbO6 octahedra.37 With the formation of SBN + LBO crystals at 650 °C, the intensity of P9 in the glass phase drastically decreases, meanwhile, the peak P6 centered at 640 cm−1 which is assigned as symmetric Nb–O stretching vibration of NbO6 octahedra with 3-dimensional network strongly increases.38 This indicates that Nb–O branch is very Raman scattering sensitive in the system during crystallization and the change in vibration energy and intensity can be a direct representation of transition from the disordered glass network to high dimensional crystal structure. It is observed that the Raman scattering intensity from both Li2O–2B2O3 glass and LBO crystal are so weak compared with the scattering from Nb–O, and it is hardly seen in the spectra. But we can still identify the occurrence of the LBO crystalline modes of P1 and P8 at 650 °C. The simplified view of the intensity changes of Raman spectra P1–P10 for the glass and crystal phases is shown in Fig. 8(c) as a bar graph, and the drastic change in vibration modes can be easily found.
4. Conclusions
We have studied the crystallization mechanism, the change of phonon modes and activation energies and the relationship of strain and size for nano grains during the formation of Sr0.25Ba0.75Nb2O6 (SBN) and Li2B4O7 (LBO) crystals from 0.25SrO–0.75BaO–Nb2O5–Li2O–2B2O3 (SBNLBO) glass.We have found that a two step consecutive crystal formation of SBN and LBO occurs by heating the glass and the crystallization mechanism of SBN is governed by an increasing nucleation rate with the diffusion controlled growth. The growth of crystal grains is restricted with the average sizes of 40–140 nm and 30–45 nm for SBN and LBO, respectively, through the whole crystallization process and the strain of these nano crystals becomes stronger with the smaller size. The change of the activation energies of SBN and LBO with respect to the crystal volume fraction obtained using the isothermal and non-isothermal isoconversional plot exists within narrow values through the entire crystallization interval, indicating nucleation and growth keep their process without drastic change.
Our specific interest on the connection between the macroscopic feature of crystallization and the microscopic molecular vibration suggests that the population of the phonon density can be directly proportional to the crystal volume fraction and the low dimensional and distorted vibration modes in the glass state change into the high dimensional units with crystal formation.
Conflicts of interest
There are no conflicts to declare.Acknowledgements
This work was supported by the National Research Foundation of Korea (NRF) grant funded by the Korea government (MSIT) (NRF-2017R1D1A1B03029540, NRF-2017R1A4A1015627, 2018R1A2B5A01023772), and by Basic Research Program through the NRF funded by the Ministry of Education (2019R1I1A3A01063420), South Korea.References
- P. V. Lenzo, E. G. Spencer and A. A. Ballman, Appl. Phys. Lett., 1967, 11, 23–24 CrossRef CAS.
- Y. Q. Qu, A. D. Li, Q. Y. Shao, Y. F. Tang, D. Wu, C. L. Mak, K. H. Wong and N. B. Ming, Mater. Res. Bull., 2002, 37, 503–513 CrossRef CAS.
- M. H. Francombe, Acta Crystallogr., 1960, 13, 131–140 CrossRef CAS.
- C. J. Huang, K. Li, X. Q. Liu, X. L. Zhu and X. M. Chen, J. Am. Ceram. Soc., 2014, 97, 507–512 CrossRef CAS.
- Y. Li, J. Liu, Y. Hou, Y. Zhang, Y. Zhou, W. Su, Y. Zhu, J. Li and C. Wang, Scr. Mater., 2015, 109, 80–83 CrossRef CAS.
- V. Y. Shur, V. A. Shikhova, D. O. Alikin, V. A. Lebedev, L. I. Ivleva, J. Dec, D. C. Lupascu and V. V. Shvartsman, Sci. Rep., 2017, 7, 1–7 CrossRef CAS PubMed.
- P. Molina, M. O. Ramirez and L. E. Bausa, Adv. Funct. Mater., 2008, 18, 709–715 CrossRef CAS.
- K. Dorywalski, B. Andriyevsky, M. Piasecki and I. Kityk, J. Appl. Phys., 2017, 122, 115110 CrossRef.
- M. Aftabuzzaman, M. A. Helal, R. Paszkowski, J. Dec, W. Kleemann and S. Kojima, Sci. Rep., 2017, 7, 11615 CrossRef CAS PubMed.
- G. Martinez-Criado, B. Alen, J. A. Sans, A. D. Lozano-Gorrin, P. Haro Gonzalez, I. R. Martin and V. Lavin, Opt. Mater. Express, 2017, 7, 2424–2431 CrossRef CAS.
- P. K. Patro, A. R. Kulkarni and C. S. Harendranath, Ceram. Int., 2004, 30, 1405–1409 CrossRef CAS.
- H. Chen, S. Guo, C. Yao, X. Dong, C. Mao and G. Wang, Ceram. Int., 2017, 43, 3610–3615 CrossRef CAS.
- Y. S. Yang, M. K. Ryu, H. J. Joo, S. H. Lee, S. J. Lee, K. Y. Kang and M. S. Jang, Appl. Phys. Lett., 2000, 76, 3472–3474 CrossRef CAS.
- S. Wan, X. Tang, Y. Sun, G. Zhang, J. You and P. Fu, CrystEngComm, 2014, 16, 3086–3090 RSC.
- M. G. Moustafa and M. Y. Hassaan, J. Alloys Compd., 2017, 710, 312–322 CrossRef CAS.
- J. M. Li, Y. W. Du, D. Feng, M. X. Quan and Z. Q. Hu, Adv. Eng. Mater., 1999, 1, 137–140 CrossRef CAS.
- J. M. Li, M. X. Quan and Z. Q. Hu, Appl. Phys. Lett., 1996, 69, 2356 CrossRef CAS.
- J. M. Li, Appl. Phys. Lett., 2007, 90, 041913 CrossRef.
- C. G. Baek, H. W. Choi and Y. S. Yang, J. Alloys Compd., 2014, 615, 745–748 CrossRef CAS.
- F. Liu and G. Yang, Acta Mater., 2007, 55, 1629–1639 CrossRef CAS.
- J. W. Christian, The theory of transformation in metals and alloys, Pergamon Press, Oxford, 2nd edn, 1975 Search PubMed.
- C. G. Baek, M. Kim, O. H. Kwon, H. W. Choi and Y. S. Yang, Cryst. Growth Des., 2017, 17, 5684–5690 CrossRef CAS.
- S. Vyazovkin, J. Comput. Chem., 2001, 22, 178–183 CrossRef CAS.
- J. H. Flynn, J. Therm. Anal., 1983, 27, 95–102 CrossRef CAS.
- H. E. Kissinger, J. Res. Natl. Bur. Stand., 1956, 57, 217–221 CrossRef CAS.
- H. Li, S. Dey and R. H. R. Castro, Acta Mater., 2018, 150, 394–402 CrossRef CAS.
- T. Ozawa, J. Therm. Anal., 1970, 2, 301–324 CrossRef CAS.
- H. E. Kissinger, Anal. Chem., 1957, 29, 1702–1706 CrossRef CAS.
- M. Vankatesh, P. Ravi and S. P. Tewari, J. Phys. Chem. A, 2013, 117, 10162–10169 CrossRef PubMed.
- G. K. Williamson and A. E. Ersundu, Acta Metall., 1953, 1, 22–31 CrossRef CAS.
- L. Xiang, L. Sheng, C. Wang, L. Zhang, Y. Pan and Y. Li, Adv. Mater., 2017, 29, 1606999 CrossRef PubMed.
- S. Ali, V. S. Myasnichenko and E. C. Neyts, Phys. Chem. Chem. Phys., 2016, 18, 792–800 RSC.
- G. L. Paul and W. Taylor, J. Phys. C: Solid State Phys., 1982, 15, 1753–1764 CrossRef CAS.
- G. S. Murugan and Y. Ohishi, J. Appl. Phys., 2004, 96, 2437 CrossRef CAS.
- J. M. Jehng and I. E. Wachs, Chem. Mater., 1991, 3, 100–107 CrossRef CAS.
- K. Fukumi and S. Sakka, J. Mater. Sci., 1988, 23, 2819–2823 CrossRef CAS.
- J. Ozdanova, H. Ticha and L. Tichy, Opt. Mater., 2010, 32, 950–955 CrossRef CAS.
- Y. Takahashi, N. Fujie, M. Osada, H. Masai, R. Ihara and T. Fujiwara, J. Appl. Phys., 2010, 108, 103519 CrossRef.
| This journal is © The Royal Society of Chemistry 2020 |

