 Open Access Article
Hydrotalcite–PLGA composite nanoparticles for loading and delivery of danshensu
Lihui Pu ,
Haiyan Yu,
Juan Du,
Yanyan Zhang and
Sihao Chen*
College of Chemistry and Chemical Engineering, Shanghai University of Engineering Science, Shanghai 201620, People's Republic of China. E-mail: chensh@sues.edu.cn; Fax: +21 67791239; Tel: +86 21 67791239
First published on 9th June 2020
Abstract
As one of the main pharmacodynamic components present in the water-soluble components of Salvia miltiorrhiza (Danshen), danshensu (DSS) is applicable to treating cardiovascular diseases. Nevertheless, such drawbacks as low water solubility and short half-life could reduce its bioavailability and restrict its clinical applicability. Therefore, it can be integrated into drug-carrying polymer microspheres, which is effective in improving the bioavailability of drugs. In this study, DSS was first embedded in a hydrotalcite (LDH) layer. Then, polylactic acid (PLGA) with excellent biocompatibility and biodegradability was coated on the surface. PLGA/DSS–LDH composite nanoparticles were prepared using the double emulsion (w/o/w) solvent evaporation method. As revealed by XRD and FTIR studies, success was achieved in embedding the drug DSS in the LDH layer, with the drug loading capacity of the LDH reaching 32.6%. A study was conducted on the encapsulation efficiency, surface morphology and in vitro drug release characteristics of PLGA/DSS–LDH. PLGA/DSS–LDH composite nanoparticles exhibited not only a high encapsulation efficiency but also a sustained release profile. The hemolysis assays demonstrated that the PLGA/DSS–LDH composite nanoparticles were ineffective in the induction of hemolysis, suggesting that PLGA/LDH composite nanoparticles can provide an effective controlled release drug system for pharmaceutics.
1. Introduction
Nowadays, cardiovascular disease remains the leading cause of death, accounting for about 35 per cent of global deaths each year.1 In recent years, danshensu (SDSS) has attracted increasing attention due to its desirable effect in treating cardiovascular diseases. As one of the main pharmacodynamic components contained in the water-soluble components of Salviae miltiorrhiza,2 SDSS is the sodium salt of danshensin and is capable of producing various pharmacological effects, for example, protecting cardiovascular and cerebrovascular systems, inhibiting tumors and reducing inflammation.3 According to the relevant experimental results, DSS could repair hyperlipidemia and liver injury in mice by regulating the level of mRNA expression. DSS is able to suppress the development, migration and invasion of liver cancer cells by regulating the pi3k-akt signaling pathway. Moreover, DSS can inhibit adipogenesis through signaling pathways, thus reducing bone formation damage.4Due to the high solubility and low permeability of DSS, however, its bioavailability is merely 11.09% and the oral elimination half-life lasts as little as 45.37 ± 9.23 min, which imposes a severe constraint on the clinical applicability of DSS.5 At present, most Salvia miltiorrhiza preparations on the market are quick-release formulations, which require patients to take medication more than three times per day, thus increasing the risk of side effects posed to the patients while making the long-term medication inconvenient for them. Therefore, it is absolutely necessary to design an effective method to extend the release time of danshensu, enhance its bioavailability, reduce its side effects on patients, and increase the convenience for patients to take medication. In order to extend the release time of DSS, there have been various methods proposed so far. For example, DSS sustained-release pellets were prepared to treat angina pectoris using the preparation method suggested by Panpan Yu et al. The ratio of DSS to sodium decanoate (SC) was optimized by single intestinal perfusion in rats. The DSS–SC-loaded pellet cores were prepared by means of extrusion–spheronization.6 Nevertheless, this method is not only time-consuming but also less than satisfactory in producing the slow release effect. DSS capsules were prepared using a method devised by Danqing Wang et al. Tanshinone IIA (TA), tanshinol (TS), protocatechuic aldehyde (PD), salvianolic acid B (Sal B) sustained-release microspheres were first prepared and packed into capsules at their original weight ratio in pure Salvia miltiorrhiza extract.7 However, it is inevitable for this approach to material decomposition to result in a certain degree of side effect on the human body. Therefore, it is imperative to find a way of extending the drug release time and reducing the potential side effects of medication on the human body.
In this study, it is proposed to prepare DSS as a controlled release drug. DSS was first combined with LDH to obtain DSS–LDH, which was then combined with PVA and PLGA to derive drug-carrying polymer microspheres. The drug-loaded polymer microspheres enable DSS to achieve multi-stage sustained release and extend the release time of the drug, thus enhancing the bioavailability of DSS and improving clinical outcomes. Compared with other DSS drug slow-release systems, LDH is classed as a naturally-derived substance in our drug carrier materials, experiments designed by Lins et al., MgAl/LDH-activated carbon composites. According to the experimental results, LDH performs well in loading the drug and leads to few side effects on human body.8 A variety of polyester materials, such as polylactic acid and PLGA, demonstrate excellent stability and biocompatibility, which allows them to be metabolized by human body as normal and end up degrading into CO2 and H2O.9,10 Therefore, controlled-release drugs are capable to reduce the side effects of drugs on human body. In line with Brzezinski design of experiment, PLA drug-loaded microspheres were prepared. According to experimental results, PLA is especially suitable for material, and the size of the drug-loading PLA microspheres is controllable.11 Bode design of experiment demonstrated PLGA/PLA swelling orchestrates drug release. With regard to HME implants, the experimental results indicated that polymer swelling orchestrates the involved mass transport phenomena. It enables drug release after a certain lag time by making a significant change to the conditions for drug dissolution and coursing simultaneously.12 These experimental results show that PLA and PLGA are good drug carrier materials and can play a role of drug slow release.
The layered structure of LDH contributes to high chemical versatility and anion exchange capacity, which makes LDH commonly used as adsorbents, catalysts, anion exchangers, flame retardants, polymer stabilizers, and so on.13,14 In addition, LDH has also been applied as a delivery carrier in various medical and pharmaceutical applications.15 The drugs that have been reported to use the drug-LDH sustained-release system include anti-inflammatory analgesics,16,17 antitumor drugs,18 cardiovascular drugs19,20 and so on. LDH, as a new variety of drug carrier material, exhibits good safety, high biocompatibility and excellent biodegradability, which makes it effective in improving drug stability and curative effect, reducing the potential side effects, and achieving the delivery of sustained-release drug.21 Compared with other DSS drug slow-release systems, LDH represents a naturally-derived substance in our drug carrier material. PLA and PLGA have good stability and biocompatibility, such polyester materials as PLA and PLGA can be metabolized as normal by human body and end up with degradation into CO2 and H2O,22,23 which allows the controlled-release drugs to reduce the potential side effects of drugs on human body.
Therefore, this work is aimed at developing the PLGA/LDH composite nanoparticles loaded with DSS as an extended drug delivery system. DSS was first embedded in the LDH layer, and then PLGA/DSS–LDH composite nanoparticles were prepared using double emulsion (w/o/w) solvent evaporation method.
2. Experimental
2.1 Materials
PLGA (Mw = 100![[thin space (1/6-em)]](https://www.rsc.org/images/entities/char_2009.gif) 000 g mol−1, PLA
000 g mol−1, PLA![[thin space (1/6-em)]](https://www.rsc.org/images/entities/char_2009.gif) :
:![[thin space (1/6-em)]](https://www.rsc.org/images/entities/char_2009.gif) PGA 50
PGA 50![[thin space (1/6-em)]](https://www.rsc.org/images/entities/char_2009.gif) :
:![[thin space (1/6-em)]](https://www.rsc.org/images/entities/char_2009.gif) 50) was purchased from Jinan Daigang Biotechnology Co., Ltd. (China). SDSS was supplied by Xi'an Honson Biotechnology Co., Ltd (China). Mg(NO3)2·6H2O, Al(NO3)3·9H2O, NaOH, formamide and dichloromethane were obtained from Sinopharm Chemical Reagent Co. Ltd (Shanghai, China). All other chemicals required for the experiment were used as received.
50) was purchased from Jinan Daigang Biotechnology Co., Ltd. (China). SDSS was supplied by Xi'an Honson Biotechnology Co., Ltd (China). Mg(NO3)2·6H2O, Al(NO3)3·9H2O, NaOH, formamide and dichloromethane were obtained from Sinopharm Chemical Reagent Co. Ltd (Shanghai, China). All other chemicals required for the experiment were used as received.
2.2 Preparation of LDH
LDH with a 3![[thin space (1/6-em)]](https://www.rsc.org/images/entities/char_2009.gif) :
:![[thin space (1/6-em)]](https://www.rsc.org/images/entities/char_2009.gif) 1 Mg/Al molar ratio was synthesized using co-precipitation method. Mg(NO3)2·6H2O and Al(NO3)3·9H2O were dissolved into CO2-free deionized water, with the total metal cation concentration of the mixed salt solution set to 0.6 mol L−1. The mixed salt solution was vigorously stirred under N2 atmosphere at 40 °C. In the meantime, 1.2 mol L−1 NaOH solution was slowly dropped to maintain the pH value of the solution at about 10.0. Then, stirring was continued for 2 h under a N2 atmosphere prior to aging for 8 h at 80 °C. Afterwards, the solution was cooled, filtered and washed with CO2-free water to pH = 7. Finally, the obtained product was vacuum dried at 80 °C for 24 h. The resulting carrier was denoted as Mg3Al–LDH–NO3 (LDH).
1 Mg/Al molar ratio was synthesized using co-precipitation method. Mg(NO3)2·6H2O and Al(NO3)3·9H2O were dissolved into CO2-free deionized water, with the total metal cation concentration of the mixed salt solution set to 0.6 mol L−1. The mixed salt solution was vigorously stirred under N2 atmosphere at 40 °C. In the meantime, 1.2 mol L−1 NaOH solution was slowly dropped to maintain the pH value of the solution at about 10.0. Then, stirring was continued for 2 h under a N2 atmosphere prior to aging for 8 h at 80 °C. Afterwards, the solution was cooled, filtered and washed with CO2-free water to pH = 7. Finally, the obtained product was vacuum dried at 80 °C for 24 h. The resulting carrier was denoted as Mg3Al–LDH–NO3 (LDH).
2.3 LDH exfoliation and preparation of DSS–LDH hybrids
0.3 g of LDH powder was dissolved into 100 mL of formamide, for 30 minutes of ultrasonic treatment to obtain a translucent colloidal suspension, which was centrifuged at 12![[thin space (1/6-em)]](https://www.rsc.org/images/entities/char_2009.gif) 000 rpm for 10 minutes to remove the nonexfoliated LDH. 0.5 g of SDSS was dissolved into 20 mL of deionized water prior to dropwise addition into the above-mentioned LDH colloidal suspension under slow magnetic stirring. The mixed colloidal suspension was stirred at room temperature for 12 h (N2 protection). Then, the mixed colloidal suspension was centrifuged at 8000 rpm for 5 minutes and washed with deionized water for 3 times. Finally, the obtained solid was freeze-dried and was labeled as DSS–LDH hybrids.
000 rpm for 10 minutes to remove the nonexfoliated LDH. 0.5 g of SDSS was dissolved into 20 mL of deionized water prior to dropwise addition into the above-mentioned LDH colloidal suspension under slow magnetic stirring. The mixed colloidal suspension was stirred at room temperature for 12 h (N2 protection). Then, the mixed colloidal suspension was centrifuged at 8000 rpm for 5 minutes and washed with deionized water for 3 times. Finally, the obtained solid was freeze-dried and was labeled as DSS–LDH hybrids.
2.4 Preparation of PLGA composite drug-loadednanoparticles
In this study, double emulsion (w/o/w) solvent evaporation method was applied to prepare PLGA composite nanoparticles. 0.5 g of SDSS or DSS–LDH compounds were dissolved into 9.1 mL of 1% PVA solution for the development of internal aqueous phase. 0.25 g of PLGA was weighted and dissolved into 5 mL of dichloromethane to develop an oil phase. Under the context of ice bath, 0.5 mL of internal water phase was added to the oil phase, while the ultrasonic probe was emulsified for 1 minute to obtain the primary emulsion. The primary emulsion (w/o) was added dropwise to 35 mL of 0.1% PVA aqueous solution with external water phase for further emulsification before a double emulsion (w/o/w) was obtained by mechanical stirring at 2000 rpm for 15 minutes. The resulting double emulsion was further stirred (400 rpm) for 4 h at room temperature until the organic solvent was completely evaporated. Then, it was centrifuged, washed with water for 3–5 times, and freeze dried. The resulting nanoparticles were stored at low temperatures and they were denoted as PLGA–DSS and PLGA/DSS–LDH, respectively.2.5 Characterization
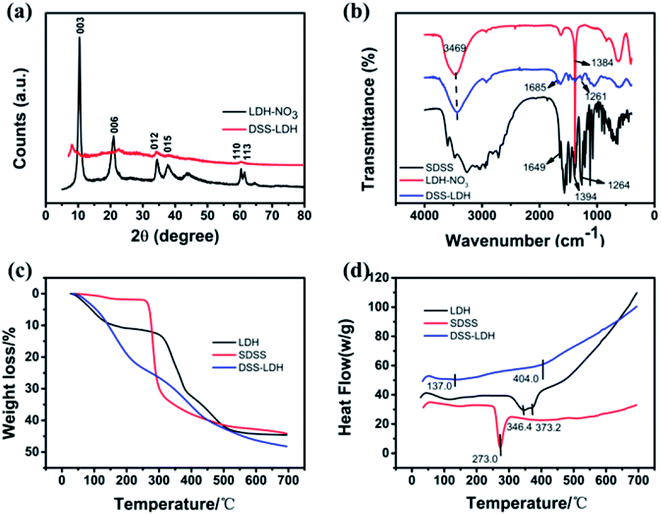
The change in interlayer structure of LDH and DSS–LDH were measured by X-ray diffraction (XRD) conducted on a wide-angle analyzer (D/max-2500 PC, Bruker) with a Cu Kα radiation (λ = 0.154 nm) at a scanning rate of 10° min−1 and the diffraction patterns were collected from 5 to 80° (2θ).FTIR analysis of LDH, DSS and DSS–LDH was conducted by means of FTIR spectroscopy (Nicolet Nexus 370 FTIR). Spectra were taken in a range of 400–4000 cm−1.
A TA SDT Q600 thermal analysis system was applied to collect thermogravimetric data, while the sample was heated from room temperature to 650 °C at a rate of 10 °C min−1 under a flowing stream of nitrogen.
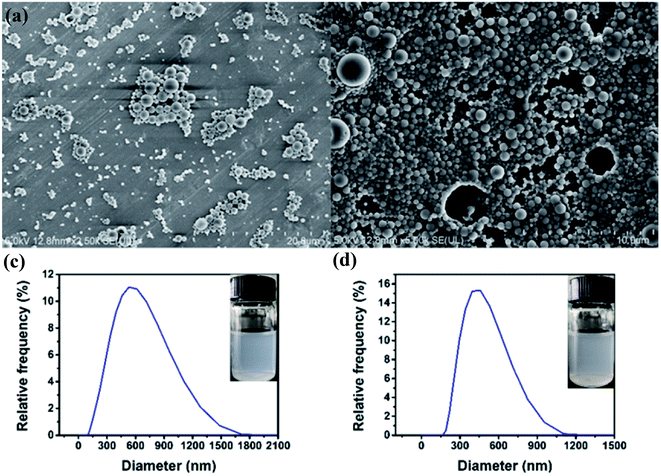
The mean volume diameter, the size distribution of PLGA–DSS nanoparticles and PLGA/DSS–LDH nanoparticles were determined using a nanoparticle size potentiometer (ZETASIZER Nano-S90).
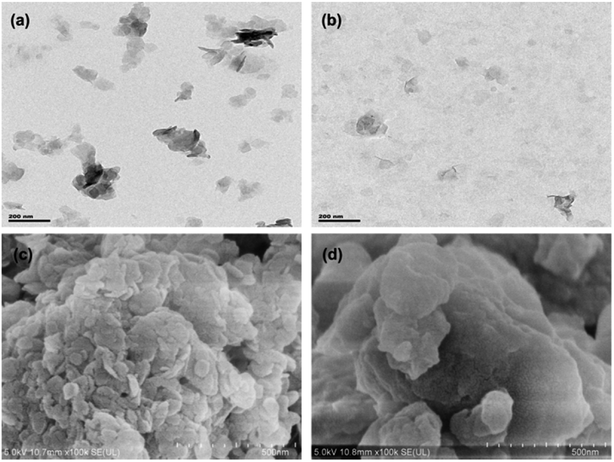
The morphologies of samples were observed using a scanning electron microscope (SEM) (SU8010, Hitachi, Japan) and a transmission electron microscope (TEM) (Tecnai G2 F20, FEI, USA).
2.6 Loading of DSS on LDH
The drug loading of DSS–LDH nanohybrid was determined by spectrophotometer. 0.005 g of DSS–LDH was weighed and dissolved into 0.5 mL of 5 mol L−1 HCl solution. Then, the volume was fixed at 50 mL with deionized water. The absorbance was measured by TU-1901 UV-Vis spectrophotometer at 280 nm. After the concentration of DSS was determined according to the standard curve of the solution, the drug loading capacity of the LDH was determined to be 32.6%.2.7 Drug loading and encapsulation efficiency of nanoparticle
15.0 mg of nanoparticles was weighed and dissolved using ultrasound into 0.5 mL of dichloromethane. Then, a certain amount of deionized water was added and sonicated until the dichloromethane was completely volatilized, which means polymer material was completely precipitated. Subsequently, the volume was fixed at 10 mL with deionized water, and the supernatant solution was filtered using 0.22 μm Millipore filters. The filtered solutions were analyzed for drug content with the assistance of a UV-Vis spectrophotometer at λmax = 280 nm. Encapsulation efficiency and loading efficiency were calculated according to eqn (1) and (2), respectively.
 | (1) |
 | (2) |
2.8 In vitro drug release
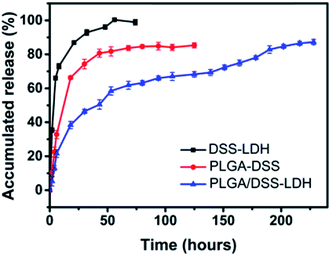
The release of DSS from DSS–LDH, PLGA–DSS and PLGA/DSS–LDH was constructed in PBS at pH 7.4 and pH 4.7, the absorbance of DSS at 280 nm using a 752N UV-Vis spectrophotometer (Jingke Industrial Co., Ltd., Shanghai, China). A sample weighing 20 mg was placed in a dialysis bag containing 1 mL of PBS. The dialysis bag was immersed in centrifuge tube containing 50 mL of PBS, which was incubated in an incubator shaker at a shaking speed of 100 rpm with the temperature range of 37 ± 0.5 °C. 10 mL of the samples was taken out at regular intervals and the same amount of fresh PBS was added promptly. The cumulative release of DSS (W) was calculated using eqn (3):| W% = m/M × 100 | (3) |
2.9 Hemolysis assays
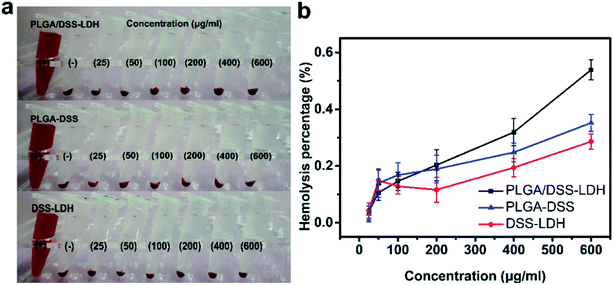
The in vitro hemolytic behavior of the samples was measured to determine their biocompatibility, which plays a significant role in the circulation and distribution of PLGA/DSS–LDH nanoparticles in human body. Fresh blood collected from rabbits was anticoagulated with heparin for further use to evaluate the blood compatibility of all samples collected. The plasma was removed by centrifugation (3000 rpm, 10 min). Then, the red blood cells (RBCs) were washed 3 times with PBS at pH 7.4, before the RBCs collected by centrifugation were diluted with PBS to a concentration of 10% (v/v). Afterwards, 0.3 mL of the diluted RBCs was mixed with 1.2 mL of the samples at different concentrations (25–600 μg mL−1). Distilled water and PBS were taken as positive and negative controls, respectively. The mixtures were incubated at 37 °C for 2 h. Finally, the samples were centrifuged (3000 rpm, 10 min) and the absorbance of supernatant at 541 nm was obtained using a microplate reader. The percentage of hemolysis of the samples was calculated by the following formula:
 | (4) |
2.10 Rabit boold
Rabbit blood was obtained from 7–8 weeks old rabbits provided by Zhongshan Hospital affiliated to Fudan University. All animal procedures were performed in accordance with the Guidelines for Care and Use of Laboratory Animals of Fudan University and approved by the Animal Ethics Committee of Fudan University.3. Results and discussion
3.1 Exfoliation behavior
The delamination process of LDH in formamide consists of two steps, which are rapid swelling and slow exfoliation. When LDH is added to formamide, the interlayer water molecules are rapidly replaced with formamide, and the interlayer spacing is enlarged for a swelling phase to develop.24 Due to oscillation, mechanical agitation or ultrasonication, a transverse sliding force was imposed on the swollen phase and the LDH host layers were split up. The transparent colloidal solution (Fig. 3a) obtained by the treatment of Mg3Al–LDH–NO3 with formamide, and the obvious Tyndall effect was observed with a side incident beam, suggesting that the presence of exfoliated LDH layers (nanosheets) in formamide.25 After the addition of DSS to the LDH colloidal suspension, the Tyndall effect dissipated, as shown in Fig. 3b. It is thus speculated that the electrostatic interaction between the carboxylate of the DSS and the LDH nanosheet is stronger than the hydrogen bonding interaction between the carbonyl of the formamide and the LDH nanosheet. DSS anion and LDH nanosheet were restacked to generate DSS–LDH.3.2 Intercalation of DSS into LDH layers
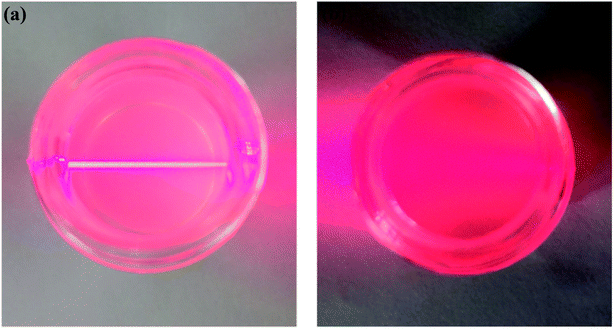 | ||
| Fig. 3 Photographs of (a) colloidal suspensions of the exfoliated LDH and (b) the colloidal containing LDH and DSS. | ||
3.3 Drug-loaded PLGA composite nanoparticles
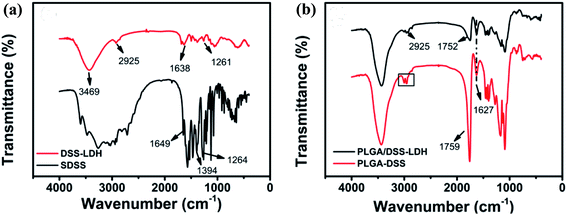
![[double bond, length as m-dash]](https://www.rsc.org/images/entities/char_e001.gif) O stretching vibration peaks of PLGA.31 The absorption peak of nanoparticles at 1627 cm−1 is the anti-symmetric stretching vibration absorption peak of –COO−, which is potentially ascribed to the introduction of SDSS, and the absorption peak at 2925 cm−1 is observed in the FTIR spectra of PLGA/DSS–LDH and DSS–LDH, implying the success in the encapsulation of SDSS and DSS–LDH in the nanoparticles.
O stretching vibration peaks of PLGA.31 The absorption peak of nanoparticles at 1627 cm−1 is the anti-symmetric stretching vibration absorption peak of –COO−, which is potentially ascribed to the introduction of SDSS, and the absorption peak at 2925 cm−1 is observed in the FTIR spectra of PLGA/DSS–LDH and DSS–LDH, implying the success in the encapsulation of SDSS and DSS–LDH in the nanoparticles.
| Vinternal/mL | Voil/mL | LE/% | EE/% | |
|---|---|---|---|---|
| DSS–LDH | 0.1 | 5 | 0.54 ± 0.02 | 84.5 ± 3.1 |
| 0.3 | 5 | 0.84 ± 0.01 | 45.5 ± 0.7 | |
| 0.5 | 5 | 1.73 ± 0.05 | 60.5 ± 2.1 | |
| DSS | 0.1 | 5 | 0.5 ± 0.01 | 78.6 ± 1.6 |
| 0.3 | 5 | 0.79 ± 0.07 | 42.1 ± 3.6 | |
| 0.5 | 5 | 1.32 ± 0.04 | 40.7 ± 2.3 |
4. Conclusions
In this study, an attempt was made to develop an oral delivery system for the highly water-soluble drug danshensu. A combination of LDH–PLGA-based controlled drug delivery system for oral administration of DSS was first proposed using the double emulsion (w/o/w) solvent evaporation method. The encapsulation efficiency, surface morphology and drug release characteristics of LDH–PLGA on drug DSS were examined and compared against PLGA–DSS nanoparticles. As indicated by XRD and FTIR studies, the drug SDSS was embedded in the LDH layer with success, with the drug loading capacity of the LDH reaching 32.6%. The presence of LDH in the PLGA matrix contributes to a longer path for the drug to be transferred from the interior of the nanoparticles to the external PBS buffer solution, thus reducing burst effects and leading to the sustained release behavior within 10 days. Therefore, it was demonstrated in the preliminary studies that the incorporation of LDH into the polymer biomaterial is effective in extending drug delivery, which contributed to a significant reduction in the frequency of administration and an improved patient compliance.Conflicts of interest
The authors declare there are no conflicts of interest.Acknowledgements
This work was supported by Capacity Building Project of Some Local Colleges and Universities in Shanghai (No. 17030501200), Talent Program of Shanghai University of Engineering Science (No. 2017RC422017).References
- B. S. Schluter, B. Masquelier, C. J. E. Metcalf and A. Rasoanomenjanahary, Glob. Health Action, 2020, 13, 13 CrossRef PubMed.
- X. Y. Yuan, F. H. Fei, H. M. Sun, C. N. Xiao, X. F. Zhao, Y. J. Zhang and X. H. Zheng, Int. J. Nanomed., 2018, 13, 2265–2274 CrossRef CAS PubMed.
- T. Y. Li, Y. Chu, K. J. Yan, S. M. Li, X. Y. Wang, Y. Wang, W. Li, X. H. Ma, J. Yang and C. X. Liu, Biomed. Chromatogr., 2017, 31, 9 Search PubMed.
- Y. T. Li, Y. X. Chen, X. J. Huang, D. N. Huang, H. N. Gan, N. Yao, Z. X. Hu, R. Y. Li, X. Y. Zhan, K. F. Xie, J. Y. Jiang and D. K. Cai, Lipids, 2020, 55, 127–140 CrossRef CAS PubMed.
- L. Zhou, M. S. Chow and Z. Zuo, Int. J. Pharm., 2009, 379, 109–118 CrossRef CAS PubMed.
- P. P. Yu, S. S. Zhang, W. L. Zhang, J. K. Yang, J. Lu and J. P. Liu, Drug Dev. Ind. Pharm., 2017, 43, 1093–1102 CrossRef CAS PubMed.
- D. Q. Wang, S. S. Zhang, H. Tang, C. P. Jiang, B. W. Wang and J. P. Liu, Phytomedicine, 2019, 58, 9 Search PubMed.
- P. V. S. Lins, D. C. Henrique, A. H. Ide, J. L. D. Duarte, G. L. Dotto, A. Yazidi, L. Sellaoui, A. Erto, C. Zanta and L. Meili, Colloids Surf., A, 2020, 586, 8 CrossRef.
- R. Rojas and C. E. Giacomelli, J. Mater. Chem. B, 2015, 3, 2778–2785 RSC.
- C. Han, N. Cai, V. Chan, M. M. Liu, X. J. Feng and F. Q. Yu, Colloids Surf., A, 2018, 559, 104–114 CrossRef CAS.
- M. Brzezinski, B. Kost, S. Wedepohl, M. Socka, T. Biela and M. Calderon, Colloids Surf., B, 2019, 184, 8 CrossRef PubMed.
- C. Bode, H. Kranz, A. Fivez, F. Siepmann and J. Siepmann, J. Controlled Release, 2019, 306, 97–107 CrossRef CAS PubMed.
- Z. P. Xu, G. S. Stevenson, C.-Q. Lu, G. Q. M. Lu, P. F. Bartlett and P. P. Gray, J. Am. Chem. Soc., 2006, 128, 36–37 CrossRef CAS PubMed.
- Y. Yuan and W. Shi, Appl. Clay Sci., 2012, 67–68, 83–90 CrossRef CAS.
- V. Rives, M. del Arco and C. Martín, Appl. Clay Sci., 2014, 88–89, 239–269 CrossRef CAS.
- S. B. Khan, K. A. Alamry, N. A. Alyahyawi and A. M. Asiri, Int. J. Nanomed., 2018, 13, 3203–3222 CrossRef CAS PubMed.
- X. Lu, L. Meng, H. Li, N. Du, R. Zhang and W. Hou, Mater. Res. Bull., 2013, 48, 1512–1517 CrossRef CAS.
- Y. F. Zhang, X. W. Wu, Y. W. Mi, H. P. Li and W. G. Hou, J. Phys. Chem. Solids, 2017, 108, 125–132 CrossRef CAS.
- A. I. Khan, L. Lei, A. J. Norquist and D. O’Hare, Chem. Commun., 2001, 2342–2343, 10.1039/b106465g.
- H. S. Panda, R. Srivastava and D. Bahadur, J. Phys. Chem. B, 2009, 113, 15090–15100 CrossRef CAS PubMed.
- D. Li, Y. T. Zhang, M. Yu, J. Guo, D. Chaudhary and C. C. Wang, Biomaterials, 2013, 34, 7913–7922 CrossRef CAS PubMed.
- R. Rojas and C. E. Giacomelli, J. Mater. Chem. B, 2015, 3, 2778–2785 RSC.
- C. Han, N. Cai, V. Chan, M. M. Liu, X. J. Feng and F. Q. Yu, Colloids Surf., A, 2018, 559, 104–114 CrossRef CAS.
- D. J. Liang, X. Peng, Y. N. Li, H. L. Wang and X. J. Yang, Adv. Mater. Interfaces, 2017, 4, 8 Search PubMed.
- R. Ma, Z. Liu, L. Li, N. Iyi and T. Sasaki, J. Mater. Chem., 2006, 16, 3809–3813 RSC.
- J. Wang, J. Zhou, Z. Li, Y. Song, Q. Liu, Z. Jiang and M. Zhang, Chemistry, 2010, 16, 14404–14411 CrossRef CAS PubMed.
- J. L. Milagres, C. R. Bellato, R. S. Vieira, S. O. Ferreira and C. Reis, J. Environ. Chem. Eng., 2017, 5, 5469–5480 CrossRef CAS.
- R. Djaballah, A. Bentouami, A. Benhamou, B. Boury and E. H. Elandaloussi, J. Alloys Compd., 2018, 739, 559–567 CrossRef CAS.
- X. Wu, S. Wang, N. Du, R. Zhang and W. Hou, J. Solid State Chem., 2013, 203, 181–186 CrossRef CAS.
- P. Gunawan and R. Xu, J. Pharm. Sci., 2008, 97, 4367–4378 CrossRef CAS PubMed.
- G. Mohammadi, A. Nokhodchi, M. Barzegar-Jalali, F. Lotfipour, K. Adibkia, N. Ehyaei and H. Valizadeh, Colloids Surf., B, 2011, 88, 39–44 CrossRef CAS PubMed.
- M. D. Seema, Appl. Clay Sci., 2013, 80–81, 85–92 CrossRef CAS.
- G. Wu, L. Chen, H. Li and Y. J. Wang, Bio-Med. Mater. Eng., 2014, 24, 751–756 CAS.
- H. Gasmi, F. Danede, J. Siepmann and F. Siepmann, J. Controlled Release, 2015, 213, 120–127 CrossRef CAS PubMed.
- Z. He and L. Xiong, J. Macromol. Sci., Part B: Phys., 2011, 50, 1154–1161 CrossRef CAS.
- M. R. Farag and M. Alagawany, Chem.-Biol. Interact., 2018, 279, 73–83 CrossRef CAS PubMed.
| This journal is © The Royal Society of Chemistry 2020 |


