 Open Access Article
Fabrication of a magnetic ternary ZnFe2O4/TiO2/RGO Z-scheme system with efficient photocatalytic activity and easy recyclability†
Yuwei Sun ab,
Jiashuang Leib,
Yizhu Wangb,
Qian Tangb and
Chunli Kang
 *a
*a
aKey Lab of Groundwater Resources and Environment, Ministry of Education, Jilin University, Changchun 130012, Jilin, China. E-mail: kangcl@jlu.edu.cn
bCollege of Environmental Science and Engineering, Jilin Normal University, Siping 136000, Jilin, China
First published on 5th May 2020
Abstract
A magnetic composite based on TiO2 nanosheets, ZnFe2O4 and reduced graphene oxide (RGO) was synthesized by a one-step hydrothermal synthesis method, which possessed the band structure of a Z-scheme photocatalytic system. The properties and structures of the samples were characterized by XRD, UV-Vis DRS, Raman spectroscopy, SEM, EDS, XPS and PL spectroscopy. Compared with TiO2 nanosheets and the TiO2/RGO composite, the obtained ternary composite with 3 wt% RGO exhibited a significant enhancement in photocatalytic activities, attributed to the efficient charge separation induced by the fabricated Z-scheme system. About 99.7% of p-nitrophenol (p-NP) degraded within 60 min under simulated solar irradiation. Trapping experiments showed that superoxide anions (˙O2−) and hydroxyl radicals (˙OH) were the main active species in the p-NP photocatalytic degradation. Finally, a possible photocatalytic mechanism of Z-scheme ZnFe2O4/TiO2/RGO was proposed based on the results of trapping experiments and the energy bands of TiO2 and ZnFe2O4.
1. Introduction
Para-nitrophenol (p-NP), as an organic pollutant, is frequently used to produce pesticides, dyes and other chemicals.1 It is considered a toxic organic pollutant when the concentration of p-NP exceeds 20 ppb in water.2 Unfortunately, p-NP is hard to degrade using traditional biochemical treatments and the intermediates produced during treatment may maintain toxicity.3,4 Photocatalytic oxidation technology has been considered to be an effective route because of its strong mineralization ability, lack of secondary pollutants and flexible operation.5,6TiO2 nanomaterials is a kind of widely used photocatalyst to degrade organic pollutants, due to its good stability, low price and high photocatalytic efficiency.7,8 However, TiO2 with high band gap energy (3.0–3.2 eV) can only use the narrow ultraviolet region of sunlight, which limits its practical application.9,10 In general, there are two strategies to overcome this problem. One strategy is to regulate the crystal phase structure or morphology of TiO2. Compared with ordinary TiO2 or P25, TiO2 nanosheets with high exposure (001) facets exhibit better performance in photocatalytic oxidation and reduction.11 The other strategy is to composite with carbon materials.12–15 Graphene with a 2D structure and excellent conductivity, always act as electron acceptors in photocatalytic reactions in order to increase the separation rate of photogenerated e− and h+ pairs.16–18 It has been already proven that combination of TiO2 and graphene can reduce the band gap energy and improve the photocatalytic efficiency.19,20 Furthermore, Z-scheme systems are considered as very promising strategies to improve the photocatalytic degradation activity, in which photogenerated e− and h+ can be effectively separated.21
Unfortunately, TiO2 and graphene composites are mostly in powder forms, which are not conducive to recovery from sewage. The introduction of magnetic materials into composite so that the new formed materials are magnetic and can be separated under the action of external magnetic force is considered to be an effective method for separating photocatalysts.22 Accordingly, magnetic ZnFe2O4 with narrow bandgap energy (1.90 eV) has received extensive attention in the field of photocatalysis.23,24 Zhu et al. studied a magnetic separable ZnFe2O4/TiO2 composite, which exhibited an improved photocatalytic degradation.25 The MB photodegradation rate was 93.2%.
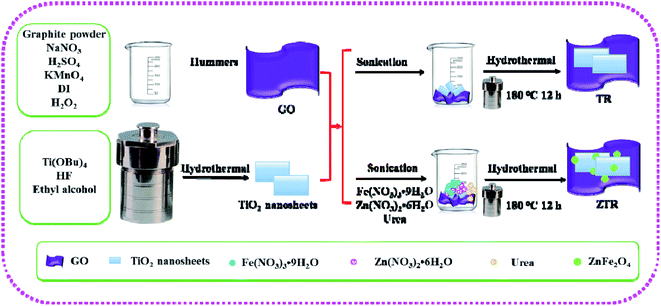
In this work, the ZnFe2O4/TiO2/RGO Z-scheme system was prepared by one step hydrothermal method and investigated for removal of p-NP solution. The phase composition and morphology of prepared composites were studied by XRD, Raman, UV-Vis DRS, PL, XPS and SEM and EDS analysis in details, the mass fraction of RGO in the ternary composite was optimized. The stability and reusability of the ZnFe2O4/TiO2/RGO Z-scheme were measured by 5 times cycles of photocatalytic experiments. The possible removal mechanism of p-NP on the composites was provided based on the photocatalytic degradation experiments and the trapping experiments.
2. Experiments
2.1 Materials
Graphite powder was obtained from Alfa Aesar (the purity is over 99.8%). All chemicals used in the experiments were purchased from Sinopharm Chemical Reagent Co. Ltd., (Shanghai) and used without any further purification. Detailed calculation methods, active species trapping experiments and preparation of GO can be found in the ESI.†2.2 Instrumental measurements
The prepared composites were characterized by X-ray diffraction (XRD) (Rigaku D-max/3C) with Cu Kα radiation (40 kV and 200 mA, in the range of 5–80°). The SEM and EDS were measured by scanning electron microscopy (JEOL-JSM-6510) fitted out an energy disperse spectroscopy. The UV-Vis diffuse reflectance spectrum (UV-Vis DRS) were measured by spectrophotometer (Shimadzu UV-3600). The X-ray photoelectron spectroscopy (XPS) (ESCALAB 250XI) were tested with the binding energies at 284.6 eV from adventitious carbon referenced by C 1s line. The photoluminescence properties (PL) (Hitachi F4500) were operated by the photoluminescence detector with an excitation wavelength at 310 nm.2.3 Photocatalytic efficiency evaluation
The photocatalytic efficiency of the prepared composites were evaluated by degradation of p-NP. Concretely, 20 mg photocatalyst was dispersed into p-NP solution (10 mg L−1, 100 mL) with stirring for 0.5 h in dark to reach an adsorption–desorption equilibrium of p-NP on the photocatalyst. As a source of simulated solar irradiation, a 300 W xenon lamp was installed above the reactor. For comparison, we also tested the photocatalytic efficiency of the prepared composites in visible light irradiation. And the visible light irradiation source was the 300 W xenon lamp which installed filters to filter ultraviolet light (k > 420 nm).The concentration and total organic carbon (TOC) of p-NP were monitored by high performance liquid chromatography (HPLC, CTO-6A) and TOC analyzer (Analytic Jena, Germany), respectively. The photocatalytic data were averaged from three replicates experiments.
3. Results and discussion
3.1 Characterization of composites
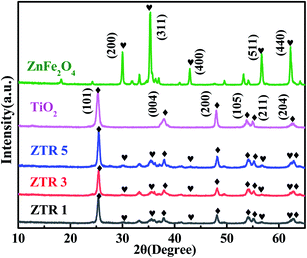
Fig. 1 shows XRD patterns of ZnFe2O4, TiO2 and ZTR 1, ZTR 3, ZTR 5 composites. The peaks of TiO2 nanosheets are located at 2θ of 25.3°, 37.8°, 48°, 53.9°, 55.1° and 62.7°, corresponding to the (101), (004), (200), (105), (211) and (204) of anatase TiO2 (JCPDS 21-1272), respectively. Compared to the peaks of TiO2 nanosheets, there are new five diffraction peaks at 2θ of 29.9°, 35.3°, 42.8°, 56.6° and 62.4°, which corresponded to (220), (311), (400), (511) and (440) crystal planes of ZnFe2O4 (JCPDS 82-1049), respectively. The two sets of diffraction peaks of ZTR 1, ZTR 3 and ZTR 5 composites reveal that the ZnFe2O4/TiO2/RGO composites were successfully synthesized. Notably, the diffraction peaks of RGO are not obvious, which maybe due to the low content of RGO.27 Furthermore, we calculated the grain sizes of TiO2 in ZTR 1, ZTR 3 and ZTR 5 composites by using the Scherrer equation (D = Kλ(B![[thin space (1/6-em)]](https://www.rsc.org/images/entities/char_2009.gif) cos
cos![[thin space (1/6-em)]](https://www.rsc.org/images/entities/char_2009.gif) θ)−1). The grain sizes of TiO2 in ZTR 1, ZTR 3 and ZTR 5 composites are 21.3, 20.2 and 19.8 nm, respectively. The grain sizes of TiO2 decreased slightly with the increase of RGO content in the composite.
θ)−1). The grain sizes of TiO2 in ZTR 1, ZTR 3 and ZTR 5 composites are 21.3, 20.2 and 19.8 nm, respectively. The grain sizes of TiO2 decreased slightly with the increase of RGO content in the composite.
The UV-Vis diffuse reflectance spectra (UV-Vis DRS) was used to investigate the optical properties and energy band features of the composites. In Fig. 2a, TiO2 nanosheets mainly respond to UV light and have absorption edge at about 400 nm. In addition, pure ZnFe2O4 displays a strong absorption in UV and visible regions, indicating ZnFe2O4 possesses excellent light absorption property. Compared with TiO2 nanosheets, the optical response range of TR composite is enhanced in the visible light region, which may be attributed to electronic interactions between of TiO2 and RGO.28 Moreover, ZTR 1, ZTR 3 and ZTR 5 composites all have the higher absorbances from 350 nm to 560 nm than TiO2 and TR, indicating a more efficient utilization of the solar light could be achieved in ZTR composites, because of the effective synergistic effects among TiO2, ZnFe2O4 and RGO.25,28 As illustrated in Fig. 2b and S2,† the band gap energies (Eg) of the prepared samples are listed in Table 1. The calculated EVB and ECB of TiO2 are 2.785 eV and −0.165 eV, respectively. Correspondingly, the EVB and ECB of ZnFe2O4 are 1.505 eV and −0.405 eV, respectively. The details of the calculation are shown in the ESI.†
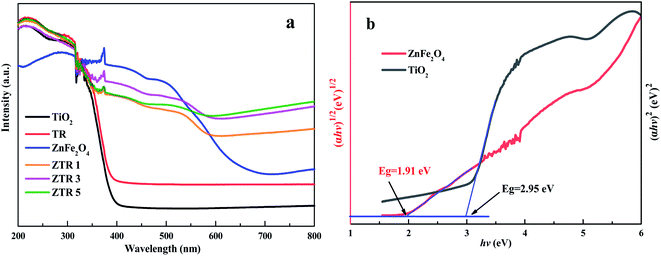 | ||
| Fig. 2 (a) UV-Vis DRS spectrum of the prepared composites and (b) calculation on the band gap energies of ZnFe2O4 and TiO2. | ||
| Photocatalyst | Eg (eV) | k1 (min−1) | k2 (min−1) |
|---|---|---|---|
| a k1 is the first-order rate constant values under simulated solar irradiation. k2 is the first-order rate constant values under visible light irradiation. | |||
| ZnFe2O4 | 1.91 | 1.89 × 10⁻³ | 1.52 × 10⁻³ |
| TiO2 | 2.95 | 5.28 × 10⁻³ | 2.16 × 10⁻³ |
| TR | 2.87 | 12.89 × 10⁻³ | 7.52 × 10⁻³ |
| ZTR 1 | 2.06 | 23.09 × 10⁻³ | 12.78 × 10⁻³ |
| ZTR 3 | 1.94 | 36.85 × 10⁻³ | 20.65 × 10⁻³ |
| ZTR 5 | 1.99 | 26.65 × 10⁻³ | 15.11 × 10⁻³ |
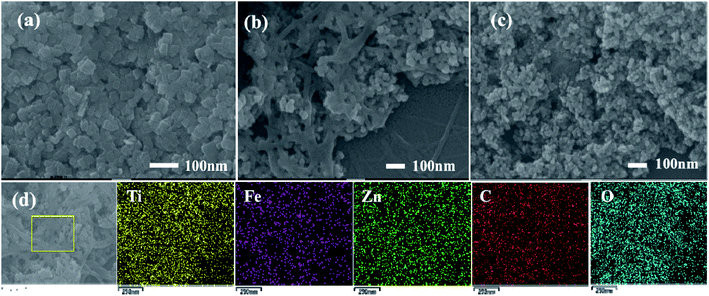
The morphologies of the composites were investigated using SEM microscopy. Fig. 3a shows the SEM image of TiO2 nanosheets, in which TiO2 is a sheet shaped structure with a uniform size. According to the symmetries, two flat and square surfaces in the crystal structure in TiO2 nanosheets may be attributed to (001) facets.29 As shown in Fig. 3b, RGO exhibits a radioactive folded morphology features after undergoing hydrothermal treatment. TiO2 nanosheets distribute on the surface and fold of RGO. The SEM image of ZTR 3 composite shows in Fig. 3c, the existence of well dispersed TiO2 nanosheets and ZnFe2O4 nanoparticles with uniform size on the surface and fold of RGO. Moreover, the element composition of ZTR 3 (Fig. 3d) composite was analyzed by energy dispersive X-ray spectroscopy (EDS). As shown in Fig. S3,† elements of C, O, Ti, Fe, Zn are detected in the ZTR 3 composite, which further confirms that the successful synthesis of the ternary composite.
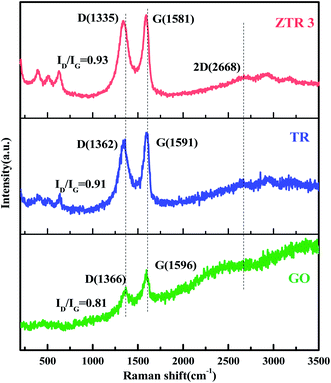
Fig. 4 presents Raman scattering spectra of GO, TR and ZTR 3 composites. It shows two Raman peaks at 1366 and 1596 cm−1 for GO, which correspond to the positions of D and G bands, respectively. As for TR and ZTR 3 composites, several characteristic bands between 100–1000 cm−1 correspond to the TiO2 and ZnFe2O4, respectively.30,31 Notably, the redshift of G band from GO (1596 cm−1) to TR (1591 cm−1) and ZTR 3 (1581 cm−1) can be considered as the reduction of GO to RGO after hydrothermal reaction. In addition, two-dimensional (2D) band at 2668 cm−1 and is also observed in ZTR 3 composites, indicating the presence of monolayer graphene.32 In addition, the ID/IG value of GO, TR and ZTR 3 composites are 0.81, 0.91 and 0.93, respectively. Compared with GO, the high ID/IG intensity ratios of TR and ZTR 3 composites indicate that the addition of TiO2 and ZnFe2O4 increased the structural disorder of graphene.33,34
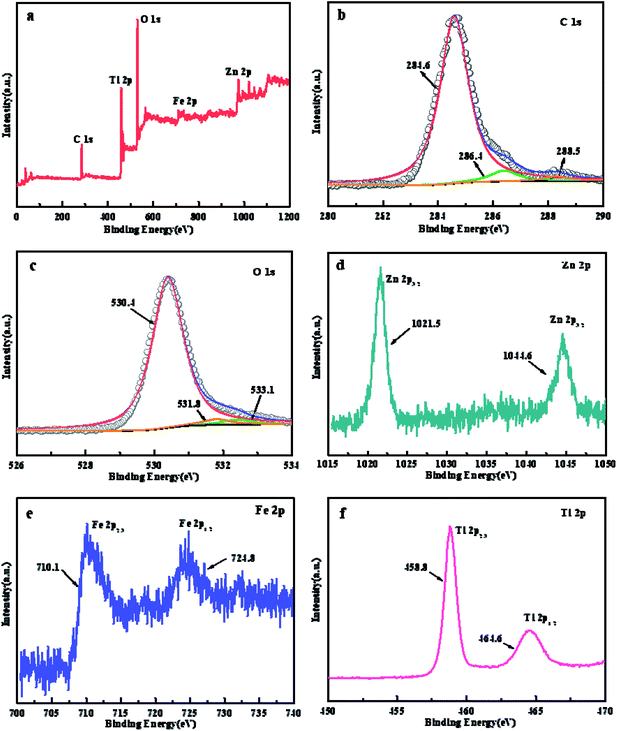 | ||
| Fig. 5 XPS spectrum of (a) full spectra scan, (b) C 1s, (c) O 1s, (d) Zn 2p, (e) Fe 2p and (f) Ti 2p for ZTR 3 composite. | ||
To further analyze the elemental components and chemical valence state, XPS measurement of ZTR 3 composite is investigated. Fig. 5a shows the elemental of C, Ti, O, Fe and Zn elements in ZTR 3 composite, which is consistent with experimental theoretical value. As displayed in Fig. 5b, the C 1s peaks can be divided into three different peaks located at 284.6 eV, 286.5 eV, and 288.3 eV, which are associated with C=C, C–O, and C=O coordination, respectively.33 Fig. 5c displays the O 1s XPS spectrum, the peak of O 1s centered at the binding energy of 530.4 eV corresponds to the metal–oxygen bonds from the ZnFe2O4 and TiO2.35 While the peaks with the binding energies of 531.9 eV and 533.1 eV relate to oxygen bonded to contaminated carbon (C–O, C=O).36 In Fig. 5d, it can be clearly observed that the Zn 2p spectrum shows peaks at 1021.5 eV and 1044.6 eV, which could be assigned to Zn 2p3/2 and Zn 2p1/2, respectively.35 The Fe 2p spectrum in Fig. 5e can be fitted into two peaks, corresponding to the binding energies of Fe 2p3/2 (710.1 eV) and Fe 2p1/2 (724.8 eV), respectively. The Zn 2p and Fe 2p photoelectron peaks are consistent with the peaks reported for Zn2+ and Fe3+ in the ZnFe2O4.34 The XPS spectrum of Ti 2p (Fig. 5f) shows two peaks at 458.8 eV and 464.6 eV, which are assigned to Ti 2p3/2 and Ti 2p1/2 of Ti4+ in anatase TiO2, suggesting the valence of Ti is four.37
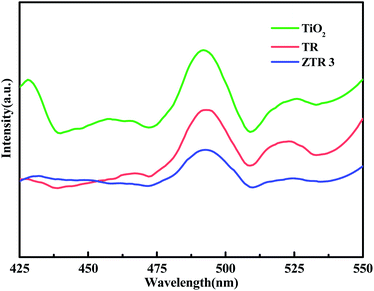
As we known, the fluorescence intensity of photocatalyst is positively correlated with the recombination rate of e− and h+ pairs.38 In Fig. 6, we can see that all samples show a strong peak locate at 491 nm. When combined with RGO and ZnFe2O4, all peaks of TR and ZTR 3 are decreased significantly. Compared with TiO2 and TR, ZTR 3 composite has the lowest PL intensity, which indicates that the lowest e− and h+ pairs recombination rate and the strongest photocatalytic efficiency.39
3.2 Photocatalytic activity
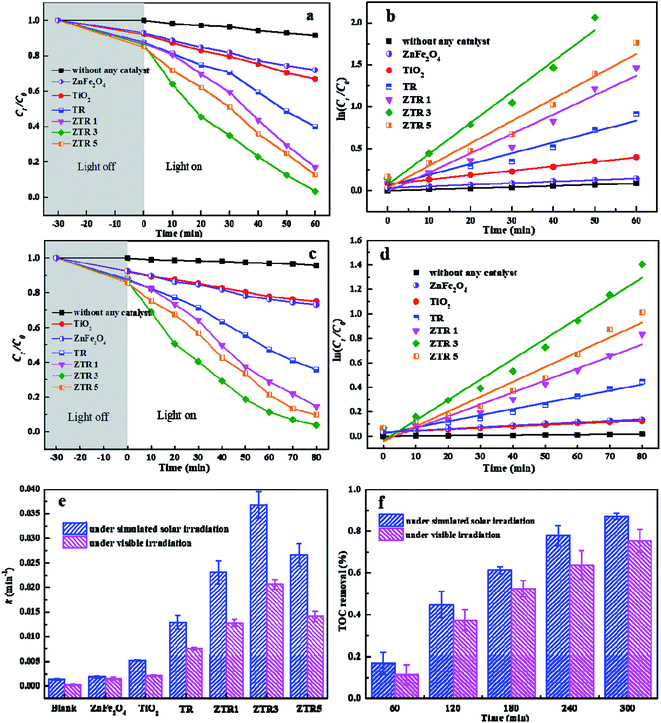
Fig. 7a and c show that in the absence of photocatalysts, the concentration of p-NP almost unchanged on both simulated solar irradiation and visible light irradiation. However, the concentration of p-NP gradually decreases with the addition of photocatalysts. In dark reaction, the concentration of p-NP decreased after adding the photocatalysts, which due to the adsorption on the catalyst surface. With the increase of RGO ratio in the photocatalyst, the adsorption capacity of p-NP on the surface of photocatalyst is stronger. Compared with ZnFe2O4 and TiO2 nanosheets, TR shows the higher photocatalytic degradation efficiency for p-NP under both simulated solar irradiation (from 28.9% and 33.1% to 60% in 60 min) and visible light irradiation (from 23.5% and 22.1% to 53.7% in 80 min), which mainly attribute to the lower recombination rate of e+ and h− pairs in TR composite. In addition, the adsorption of p-NP on RGO is also benefit to the improvement of photocatalytic activity.40 Furthermore, ZTR 1, ZTR 3 and ZTR 5 composites exhibit the enhanced photocatalytic activity than TR composite. When the percentage of RGO in composite reach from 3% to 5%, the photocatalytic degradation of p-NP decreases from 99.7% to 98.8% under simulated solar irradiation, the same trend is observed under visible light irradiation. This phenomenon may be due to higher black RGO contents may lead to a shield of the active sites on the photocatalyst surface sites.33Fig. 7b and d show that the plots of −ln(Ct/C0) vs. time are linear for all composites, confirming that the photodegradation of p-NP obeys pseudo first-order kinetics under simulated solar irradiation and visible light irradiation, respectively. The slope linear is apparent rate constant (k), which are calculated in Fig. 7e. The k values of the prepared composites are listed in Table 1. The fitting parameters reveal that reaction rate of ZTR 3 composite is faster than that of other composites, indicating it has an excellent photodegradation on p-NP pollutants.
The mineralization efficiency of p-NP was tested by total organic carbon (TOC) analysis. As seen in Fig. 7f, TOC degradation rates of p-NP are 87.6% and 75.3% in 300 min catalyzed by the ZTR 3 composite under simulated solar irradiation and visible light irradiation, respectively. TOC concentration decrease from 6.86 mg L−1 to 0.85 mg L−1 and 1.69 mg L−1. This means that most of organic carbon in p-NP change to inorganic carbon in the solution.
Table 2 lists the comparisons of photocatalytic efficiencies of the ZTR 3 composite with other nanocomposites reported for degradation of p-NP. ZTR 3 composite showed enhanced pollutant degradation efficiency of p-NP.
| Photocatalyst | Light | Concentration | Time | Degradation | Ref. |
|---|---|---|---|---|---|
| W–TiO2/SiO2 | UV light | 25 mg L−1 | 240 min | 99% | 41 |
| ZnO–N/CF | UV light | 20 mg L−1 | 150 min | 98% | 42 |
| H3PW12O40/TiO2–g-C3N4 | Visible light | 20 mg L−1 | 120 min | 98.6% | 43 |
| Sr2+/Ag–TiO2@rGO | Visible light | 15 mg L−1 | 180 min | 99.9% | 44 |
| ZTR 3 | UV-Vis light | 10 mg L−1 | 60 min | 99.7% | This work |
| ZTR 3 | Visible light | 10 mg L−1 | 80 min | 99.6% | This work |
3.3 Reusability of the ZTR 3 composite
In Fig. 8a, the stability and reusability of ZTR 3 composite was researched by photodegradation of p-NP for 5 cycles. The photodegradation of p-NP decreases to 88.1% after five recycling runs, illustrating that ZTR 3 composite exhibits a relatively stable photocatalytic activity. Magnetic hysteresis loops of ZnFe2O4 and ZTR 3 composite displayed in Fig. 8b, which reveal that ZnFe2O4 and ZTR 3 composite equipped the magnetic material characteristic. The magnetic saturation (Ms) of ZnFe2O4 (26.2 emu g−1) is higher than ZTR 3 (9.2 emu g−1) composite, which may be attributed to a small proportion of ZnFe2O4 in ZTR 3 composite. The inset of Fig. 8b confirms that the ZTR 3 composite can be separated by an external magnetic field in p-NP solution.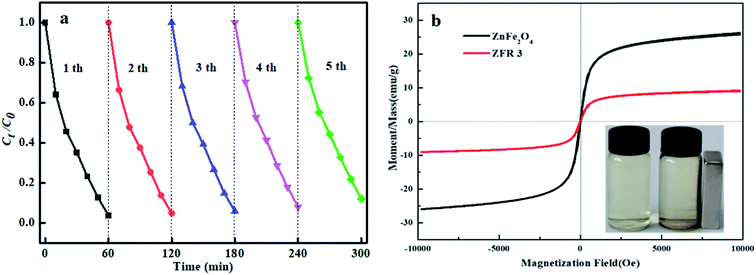 | ||
| Fig. 8 (a) Reusability of ZTR 3 composite for five recycling runs and (b) magnetic hysteresis loops of ZnFe2O4 and ZTR 3 composites under an external magnetic field. | ||
3.4 Possible photocatalytic mechanism
The active species trapping experiments were investigated to analyze the photocatalytic mechanism of ZTR 3 composite. As shown in Fig. 9, when AO (a quencher of h+) is added, the degradation rate of p-NP is slightly improved, which due to promotion of photogenerated e−/h+ pairs separation.45 The degradation rates of p-NP decrease to 38.2% and 66.4% with addition of BQ (a quencher of ˙O2−) and IPA (a quencher of ˙OH), respectively. Therefore, we can draw a conclusion that ˙O2− and ˙OH are the main active species in photocatalytic degradation of p-NP by ZTR 3 composite.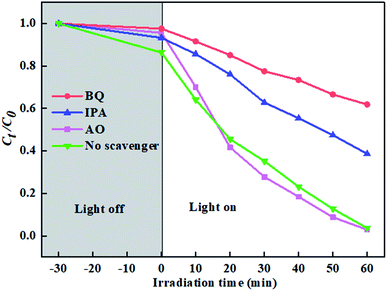 | ||
| Fig. 9 Active species trapping experiments over ZTR 3 composite alone, and with addition of AO, IPA and BQ. | ||
According to formulas (2) and (3) (in SI), the calculated EVB and ECB of TiO2 are 2.785 eV and −0.165 eV, and for control ZnFe2O4 they are 1.505 eV and −0.405 eV, respectively. Under the simulated solar irradiation, both TiO2 and ZnFe2O4 can be excited to generate photogenerated e− and h+. However, the potential of the –OH/˙OH and H2O/˙OH couples are 2.7 eV and 2.4 eV vs. NHE,46 which locate lower than the VB of ZnFe2O4 (1.505 eV). This indicates that ZnFe2O4 cannot react with –OH/H2O to produce ˙OH, which is not consistent with the trapping experiments. Thus, the photogenerated e−/h+ pairs of ZTR 3 composite form a Z-scheme photocatalytic system. As shown in Fig. 10, photogenerated h+ still leave the VB of TiO2, and the photogenerated e− in TiO2 migrate to VB of ZnFe2O4. The Z-scheme mechanism promote an efficient separation space between the photogenerated e− and h+.21 As another main component in the ZTR 3 composite, RGO act as the receiver and transmitter of photogenerated e−, which further reduce the recombination of e− and h+.47 Accordingly, photogenerated h+ in VB of TiO2 oxidize the –OH or H2O to ˙OH, and photogenerated e− in CB of ZnFe2O4 react with O2 to produce ˙O2−. Eventually, these highly active species degrade the p-NP.
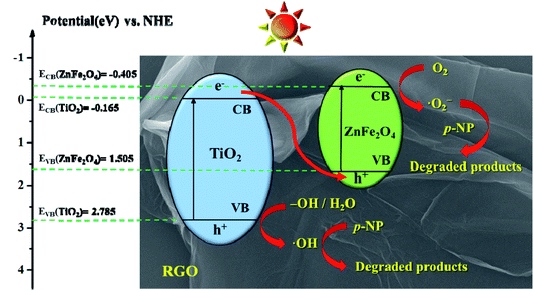 | ||
| Fig. 10 Schematic illustration of possible photocatalytic mechanism of ZTR 3 composite under simulated solar irradiation. | ||
4. Conclusions
A magnetic separable Z-scheme system of ZnFe2O4/TiO2/RGO composite was successfully synthesized by one-step hydrothermal method. The ZTR 3 composite exhibited the highest k value (36.85 × 10⁻³ min−1), which was 6.98 and 2.86 times higher than TiO2 (5.28 × 10⁻³ min−1) and TiO2/RGO (12.89 × 10⁻³ min−1). The photocatalytic degradation of p-NP reached to 99.7% under simulated solar irradiation within 60 min and the TOC degradation of p-NP was 87.6% in 300 min. Furthermore, 5 time cycles of photocatalytic experiments revealed an excellent stability and reusability of ZTR 3 composite. Finally, the excellent photocatalytic activity of ZTR 3 composite was mainly attributed to the rapid charge transfer of the Z-scheme system. In conclusion, the magnetic separable ZnFe2O4/TiO2/RGO composite with an excellent photocatalytic efficiency displayed great prospects in the degradation of p-NP wastewater.Conflicts of interest
There are no conflicts to declare.Acknowledgements
This work was supported by the Development and Reform Commission of Jilin Province (No. 2015Y049), the National Natural Science Foundation of China (51708250), the Project of Department of Science and the Technology of Jilin Province (20180623042TC).References
- B. Boruah, R. Gupta, J. M. Modak and G. Madras, J. Photochem. Photobiol., A, 2019, 373, 105–115 CrossRef CAS.
- N. San, A. Hatipoğlu, G. Koçtürk and Z. Çınar, J. Photochem. Photobiol., A, 2002, 146, 189–197 CrossRef CAS.
- Y. L. Luo, W. S. Guo, H. H. Ngo, L. D. Nghiem, F. I. Hai, J. Zhang, S. Liang and X. C. C. Wang, A review on the occurrence of micropollutants in the aquatic environment and their fate and removal during wastewater treatment, Sci. Total Environ., 2014, 473, 619–641 CrossRef PubMed.
- N. H. Tran, M. Reinhard and K. Y. H. Gin, Occurrence and fate of emerging contaminants in municipal wastewater treatment plants from different geographical regions-a review, Water Res., 2018, 133, 182–207 CrossRef CAS.
- K. Ravi, B. S. Mohan, R. B. Anjaneyulu, G. S. Sree and K. Basavaiah, Phys. B, 2019, 553, 190–194 CrossRef.
- Y. C. Wu, Z. M. Liu, Y. R. Li, J. T. Chen, X. X. Zhu and P. Na, Chin. J. Catal., 2019, 40, 60–69 CrossRef CAS.
- Z. Y. Jiang, X. Z. Liang and Y. Y. Liu, Appl. Catal., B, 2017, 211, 252–257 CrossRef CAS.
- K. X. Wang, C. L. Shao and X. H. Li, Materials, 2016, 9, 90 CrossRef PubMed.
- J. Tian, Y. Sang, G. Yu, H. Jiang, X. Mu and H. Liu, Adv. Mater., 2013, 25, 5075–5080 CrossRef CAS PubMed.
- G. H. Moon, D. H. Kim and H. I. Kim, Environ. Sci. Technol., 2014, 1(2), 185–190 CAS.
- Y. R Li, Z. M. Liu, Y. C. Wu, J. T. Chen, J. Y. Zhao, F. M. Jin and P. Na, Appl. Catal., B, 2018, 224, 508–517 CrossRef.
- K. Nakata, T. Ochiai, T. Murakami and A. Fujishima, Electrochim. Acta, 2012, 84, 103–111 CrossRef CAS.
- H. Tong, S. X. Ouyang, Y. P. Bi, N. Umezawa, M. Oshikiri and J. H. Ye, Adv. Mater., 2012, 24, 229–251 CrossRef CAS PubMed.
- N. M. Gupta, S. Kelkar and P. Korake, Photochem. Photobiol. Sci., 2016, 15(6), 758–766 RSC.
- N. K. Eswar, P. C. Ramamurthy and G. Madras, Photochem. Photobiol. Sci., 2015, 14, 1227–1237 RSC.
- J. Q. Qin, X. Y. Zhang, C. W. Yang, M. Cao, M. Z. Ma and R. P. Liu, Appl. Surf. Sci., 2017, 392, 196–203 CrossRef CAS.
- S. Bellamkonda, N. Thangavel, H. Y. Hafeez, B. Neppolian and G. R. Rao, Catal. Today, 2017, 321–322, 120–127 Search PubMed.
- H. Xu, M. M. Ding, W. Chen, Y. Li and K. Wang, Sep. Purif. Technol., 2018, 195, 70–82 CrossRef CAS.
- M. Faraldos and A. Bahamonde, Catal. Today, 2017, 285, 13–28 CrossRef CAS.
- S. Y. Pu, R. X. Zhu, H. Ma, D. L. Deng, X. J. Pei, F. Qi and W. Chu, Appl. Catal., B, 2017, 218, 208–219 CrossRef CAS.
- H. N. Che, C. B. Liu, W. Hu, H. Hu, J. Q. Li, J. Y. Dou, W. D. Shi, C. M. Li and H. J. Dong, Catal. Sci. Technol., 2018, 8, 622 RSC.
- L. Zhu, X. Q. Kong, C. W. Yang, B. X. Ren and Q. Tang, J. Hazard. Mater., 2020, 381, 12910 Search PubMed.
- Y. F. Jia, J. Liu, S. W. Cha, S. Choi, Y. C. Park and C. L. Liu, J. Ind. Eng. Chem., 2016, 47, 303–314 CrossRef.
- A. H. Mady, M. L. Baynosa, D. Tuma and J. J. Shim, Appl. Catal., B, 2017, 203, 416–427 CrossRef CAS.
- X. D. Zhu, F. Zhang, M. J. Wang, J. J. Ding, S. Sun, J. Bao and C. Gao, Appl. Surf. Sci., 2014, 83–89 CrossRef CAS.
- Y. H. Cao, Q. Y. Li, C. Li, J. L. Li and J. J. Yang, Appl. Catal., B, 2016, 198, 378–388 CrossRef CAS.
- J. Q. Qin, X. Y. Zhang, C. W. Yang, M. Cao, M. Z. Ma and R. P. Liu, Appl. Surf. Sci., 2017, 392, 196–203 CrossRef CAS.
- X. D Tang, Z. R. Wang and Y. Wang, Appl. Surf. Sci., 2018, 427, 123–132 CrossRef.
- X. L. Hu, S. C. Lu, J. Tian, N. Wei, X. J. Song, X. Z. Wang and H. Z. Cui, Appl. Catal., B, 2019, 241, 329–337 CrossRef CAS.
- Y. S. Fu and X. Wang, Ind. Eng. Chem. Res., 2011, 50, 7210–7218 CrossRef CAS.
- T. Y. Liu, B. Liu, L. F. Yang, X. L. Ma, H. Li, S. Yin, T. Sato, T. Sekino and Y. H. Wang, Appl. Catal., B, 2017, 204, 593–601 CrossRef CAS.
- Y. S. Fu, H. Q. Chen, X. Q. Sun and X. Wang, AIChE J., 2012, 58, 3298–3305 CrossRef CAS.
- H. Atout, M. G. Álvarez, D. Chebli, A. Bouguettoucha, D. Tichit, J. Llorca and F. Medina, Mater. Res. Bull., 2017, 95, 578–587 CrossRef CAS.
- S. Banerjee, P. Benjwal, M. Singh and K. K. Kar, Appl. Surf. Sci., 2018, 439, 560–568 CrossRef CAS.
- X. J. Chen, Y. Z. Dai and T. H. Liu, Catal. Commun., 2015, 71, 21–27 CrossRef.
- Q. C. Chen and Q. S. Wu, J. Hazard. Mater., 2015, 283, 193–201 CrossRef CAS PubMed.
- X. F. Meng, Y. Zhuang, H. Tang and C. H. Lu, J. Alloys Compd., 2018, 761, 15–23 CrossRef CAS.
- M. J. Zhou, J. Z. Li, Z. F. Ye, C. C. Ma, H. Q. Wang, P. W. Huo, W. D. Shi and Y. S. Yan, ACS Appl. Mater. Interfaces, 2015, 7, 28231 CrossRef CAS.
- Y. W. Sun, Q. Tang, T. Tian and C. L. Kang, ChemistrySelect, 2019, 4, 9476–9482 CrossRef CAS.
- J. J. Zhang, X. Liu, T. Ye, G. P. Zheng, X. C. Zheng, P. Liu and X. X. Guan, J. Alloys Compd., 2017, 698, 819–827 CrossRef CAS.
- U. A. Sánchez, L. C. Chen, J. A. Wang, L. E. Noreña, M. Asomoza, S. Solis, X. L. Zhou, Y. Q. Song and J. Liu, Int. J. Photoenergy, 2019, 5748586 Search PubMed.
- J. A. Allen, D. Murugesan and C. Viswanathan, Superlattices Microstruct., 2019, 125, 159–167 CrossRef CAS.
- L. J. Li, L. Li, T. T. Sun, X. M. Yu, L. Long, L. Xu and J. H. Yan, J. Solid State Chem., 2019, 274, 152–161 CrossRef CAS.
- X. Wei, J. Cao and F. Fang, RSC Adv., 2018, 8, 31822–31829 RSC.
- J. G. Yu, S. H. Wang, J. X. Low and W. Xiao, Phys. Chem. Chem. Phys., 2013, 15, 16883–16890 RSC.
- J. H. Lia, Y. L. Liu, H. M. Li and C. Chen, J. Photochem. Photobiol., A, 2016, 317, 151–160 CrossRef.
- H. Safajou, H. Khojasteh, M. S. Niasari and S. M. Derazkola, J. Colloid Interface Sci., 2017, 498, 423–432 CrossRef CAS PubMed.
Footnote |
| † Electronic supplementary information (ESI) available. See DOI: 10.1039/d0ra01880e |
| This journal is © The Royal Society of Chemistry 2020 |

