 Open Access Article
Water-soluble gold nanoparticles: recyclable catalysts for the reduction of aromatic nitro compounds in water
Gustavo A. Montiab,
N. Mariano Correa ab,
R. Darío Falcone
 ab,
Gustavo F. Silbestri
 *c and
Fernando Moyano
 *ab
*ab
aInstituto para el desarrollo agroindustrial y de la salud, IDAS, (CONICET – UNRC), Argentina
bDepartamento de Química, Universidad Nacional de Río Cuarto, Agencia Postal # 3., Río Cuarto, C.P. X5804BYA, Argentina. E-mail: fmoyano@exa.unrc.edu.ar
cInstituto de Química del Sur (INQUISUR), Departamento de Química, Universidad Nacional del Sur (UNS), CONICET, Av. Alem 1253, B8000CPB, Bahía Blanca, Argentina. E-mail: gsilbestri@uns.edu.ar
First published on 16th April 2020
Abstract
A structure/catalytic activity study of water-soluble gold nanoparticles, stabilized by zwitterionic ligands derived from imidazolium salts, in the reduction of aromatic nitro compounds in pure water at different temperature, as well as their recyclability, was performed. Our studies indicate that the nanoparticles synthesized by an easy, fast and reproducible process, need a short characteristic induction time to restructure the surfaces and make them active. The differences observed in the catalytic activity of the nanoparticles, determined by using the typical Langmuir–Hinshelwood model, are strongly based on the degree of coverage and spatial arrangement of the imidazolium salts on them. Finally, we demonstrate that gold nanoparticles stabilized by non-traditional ligands can be an excellent choice for nitro compound degradation.
Introduction
In recent years, many books and reviews about the application of gold in homogeneous catalysis have appeared. Normally, Au1+ or Au3+ organic complexes are used as catalysts.1,2 However, recently, Wang et al.3 conducted a detailed review of the synthetic methods and functional properties of various nanostructured materials of noble metals (especially Au and Ag). Also, they present and discuss the applications of nanomaterials for chemical systems and biosensors. The interest in metallic nanoparticles (M–NPs) has increased due to their numerous applications such as in medicine,4,5 optics,6,7 electronics,8 luminescence9 and especially because of their potential use in catalysis.10–12It is well known that, when the size of a system is reduced to the nanometer scale, matter exhibits some specific properties that may be significantly different from the physical properties of the massive material. These properties depend on several factors, such as the shape, size and functionalization of the surface of the NPs and, they can be adapted if you have control over the morphology and size of the system, which can be achieved by manipulating the synthesis conditions of the NPs.
In the field of catalysis, one of the fasted growing areas in nanoscience, different stabilizers not only avoid the undesired aggregation and coalescence but can act as active spectators that may attend the catalytic properties of the metal.13,14 At the same time, the stabilization of M–NPs by the coordinating capping ligands, results in a change of the surface properties and the surface accessibility of the nanoparticles particularly with regard to applications in catalysis.15 Catalysis by transition-metal NPs dispersal in water allows the development of synthesis procedures with low environmental impact, easy catalyst recycling, and separation from products.16,17
It is known that, due to their high surface energy, M–NPs tend to aggregate. To avoid it, ligands such as thiols, amines, disulfures, thioethers, phosphines, N-heterocyclic carbenes (NHCs) or imidazolium salts are uses.3 An alternative way for stabilizing metal nanoparticles can be the use of ionic liquids (ILs); the well-established and probably most studied ILs contain an imidazolium cation (e.g. 1-ethyl-3-methylimidazolium or 1-butyl-3-methylimidazolium) and weakly-coordinating anions such as tetrafluoroborate [BF4]−, hexafluorophosphate [PF6]− and trifluoromethylsulfonate(triflate) [OTf]− or bis(trifluoromethylsulfonyl)imide(triflimide) [NTf2]−.18 NHCs have been used to synthesize Au- 19,20 and Ag–NPs21 as a model synthesis for the formation of either conglomerates or 3D networks. Glorius and co-worked described the synthesis and catalytic activity of Au- and Pd–NPs stabilized with NHCs bearing sulfonate and carboxylate groups.22 Also, de Jesús and Chaudret have prepared, by thermal decomposition, Pt–NPs using sulfonated NHC as stabilized ligands.23 On the other hand, Nome et al. have prepared Pd–NPs, water-soluble, using imidazolium-based surfactant 3-(1-dodecyl-3-imidazole)propanesulfonate. The NPs were effective and recycling in the aqueous biphasic hydrogenation of cyclohexene24 and, recently we have reported the synthesis, electrostatic stabilization and characterization of Au–NPs in aqueous medium using sulfonated-imidazolium salts as stabilized.25,26 However, these stabilizer systems may impede the activity of the M–NPs for a given reaction. At this point, a model reaction that is well known and, without the generation of by products, would be of great help.27 Pal28 and Esumi29 were the first to identify the catalytic reduction of p-nitrophenol,30 is perhaps the most used reaction, to test the catalytic activity of M–NPs in aqueous solution.
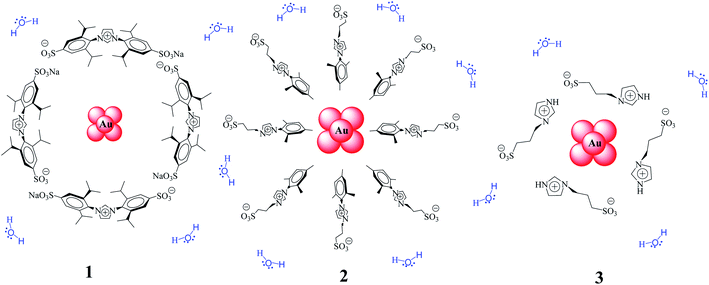
Continuing with our research on water-soluble gold–NPs, herein we report the structure/catalytic activity study of Au–NPs stabilized with different imidazolium salts (1–3, Scheme 1) in the reduction of aromatic nitro compounds in aqueous medium as well as their recyclability. Kinetic data have been obtained between 25 °C and 45 °C by monitoring the concentrations of 1,4-dinitrobenzene (DNB) by UV-vis spectroscopy and, the kinetic were modeled in terms of the Langmuir–Hinshelwood model.31
Results and discussion
The reaction between DNB and Hz was explored in the absence of Au–NPs and under this experimental condition no catalytic activity was observed (absorption spectra for 30 min remains unchanged). However, in the presence of catalysts, we observe changes in the spectra indicating that the reduction reaction takes place. Fig. 1 shows typical absorption spectra for the reduction reaction at different times in water, catalyzed by different Au–NPs (1–3) at 25 °C. It can be seen an increase in the absorbance value at λmax = 380 nm with time, corresponding to the product reactions absorbance (p-NA) and, a decrease in the absorbance value at λmax = 284 nm corresponding to the reactive (DNB) consumption. Also, it can be observed a clear isosbestic point at λmax = 304 nm. This evidences the lack of intermediates and/or product decomposition. In all cases, we observed that the reaction was completed after 30 min.Fig. 2 shows a graph of  versus time (t) for typical reaction between DNB and Hz, catalyzed by Au–NPs. As it can be observed, the graph denotes two profiles. In the first part (red dots), it can be seen that there is an induction time (t0), in which no reductions take places. In the second part (black dots), the reaction follows a first-order rate law. This behavior was also observed in the catalytic reduction of different substrates with metal nano-catalysts.32,33 For example, during the catalytic reduction of p-nitrophenol in the presence of different catalysts, an induction period has been observed by many groups which can be as long as several minutes.32,33 This period is usually ascribed to the diffusion time required for p-nitrophenol to be adsorbed onto de catalyst's surface before the reaction could start.12,34 On the other hand, the induction time can be assigned to a surface restructuring necessary to render the M–NPs as an active catalyst35 or, also it may be the time necessary to remove surface oxides.36 All data published so far by different groups show that the reduction of nitrophenol proceeds on the surface of the M–NPs and quantitative analysis of this surface reaction can be performed.31,35 Since our data indicate that the reductions begin after t0, we determine all kapp values in the presence of different Au–NPs as shown in Fig. 2.
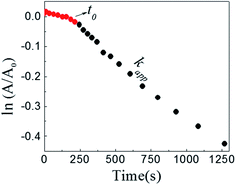 | ||
Fig. 2 Typical time trace of the absorption of the DNB at λmax = 284 nm: ( ) induction time, t0; ( ) induction time, t0; ( ) section from which kapp is taken. [DNB] = 5 × 10⁻⁵M, [Hz] = 0.1 M and [Au–NPs] = 1 × 10⁻⁸ M. ) section from which kapp is taken. [DNB] = 5 × 10⁻⁵M, [Hz] = 0.1 M and [Au–NPs] = 1 × 10⁻⁸ M. | ||
Following eqn (6), the k values can be determined by varying kapp with DNB concentrations. Fig. 3 shows the experimental data of kapp at different DNB concentrations in the presence of different Au–NPs (1–3). In all case, the profiles show an increase of kapp values when DNB concentration increases, which is typically due to a Langmuir–Hinshelwood mechanism.31 These profiles clearly indicate that the catalysis process involving Au–NPs is a superficial process, where the reagents compete for the free regions on the Au–NPs surface, so that, when DNB concentrations increase, more DNB molecules are adsorbed on the catalyst and the kapp values increases.
 | ||
| Fig. 3 Dependence of kapp with the DNB concentration at T = 25 °C for each Au–NPs: (a) 1, (b) 2 and (c) 3. The red lines adapt to the Langmuir–Hinshelwood model according to eqn (6). The k value was obtained considering the total surface area calculate of the catalyst for each NPs, see Table 2. | ||
The adjustments obtained with the mechanism are consistent with Wunder et al.37 and k values were obtained by adjusting the experimental data to eqn (6) and, assuming n = 0.6 for the adsorption of DNB, while m = 1 for the adsorption of Hz. These values were calculated previously37 following Gaussian distributions. The k values obtained at 25 °C for 1, 2 and 3 are 1.03 × 10⁻³ mol m2 s−1, 4.07 × 10⁻⁴ mol m2 s−1 and 3.10 × 10⁻³ mol m2 s−1, respectively. An interesting analysis arises when comparing the k of Au–NPs of similar shape and size (2 and 3) with the degree of coverage and spatial arrangement.38 For 2, there are more molecules of imidazolium salts that cover the Au–NPs and it is due to a better compaction around them.26 This makes it difficult to approach the Au–NP surface of the reagents. Nevertheless 3 have a different arrangement around Au–NPs and then it is less compacted to 2; the reagents can easily access the surface of Au–NPs therefore, a higher value k is observed. In other words, both the spatial arrangement and the degree of coverage are responsible for that the 3 show greater efficient catalytic in the model reaction at 25 °C.
Dependence of the reaction rate with temperature
To explain thermodynamically the k values obtained for Au–NPs, we select those Au–NPs that have a similar size (2 and 3, see Table 2) and; we evaluate the behavior of catalysts against the temperature in the reaction. Fig. 4 shows the kapp values as a function of the concentrations DNB at different temperatures for 2 and 3, respectively.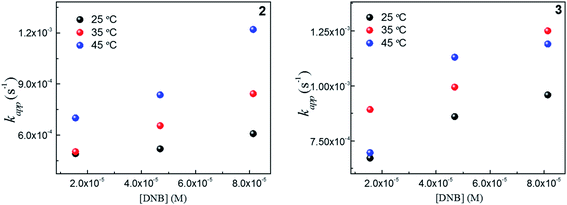 | ||
Fig. 4 Dependence of kapp with the DNB concentration at different temperature: ( ) 25 °C, ( ) 25 °C, ( ) 35 °C and, ( ) 35 °C and, ( ) 45 °C for 2 and 3. ) 45 °C for 2 and 3. | ||
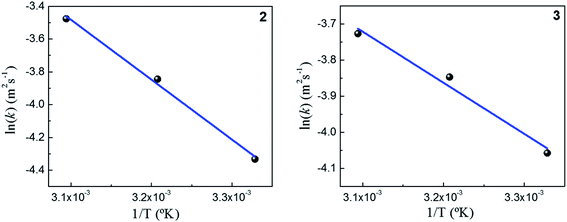
As expected, the kapp values increase with temperature according to the Langmuir–Hinshelwood mechanism, which was used to determine the values of k at different temperatures as described above. Thus, it is possible to express the dependence k with temperature in terms of the Arrhenius equation.35
 | (1) |
It is an equation that fits experimental data in most of the situations, where k0 is the frequency factor of the surface reaction and, Ea the true activation energy which we measure in kJ mol−1. Taking the natural logarithm of eqn (1), the Arrhenius equation can be rearranged as:
 | (2) |
Fig. 5 shows the dependence k with temperature in terms of the Arrhenius linear equation to different Au–NPs (2 and 3).
The activation energies values found for the reaction catalyzed by 2 and 3 are 34 kJ mol−1 and 13 kJ mol−1, respectively. Our results, shows that the lowest value of the activation energy determined corresponds with highest the value k. Furthermore, a similar value of the activation energies in metallic nanoparticles was assigned to spontaneous surface reconstruction in the absence of a substrate. In this work during the catalytic reduction of p-nitrophenol, the t0 found for each kinetics and the activation energies determined, may indicate that there is restructuring on surfaces of Au–NPs to use as an active catalyst. It is necessary remark that the value of activation energies found to different nanocatalysts39 varies in the range from 10 to 60 kJ mol−1. Even more, these findings are similar to those Ballauff et al.37 were the Au–NPs are immobilized on cationic spherical polyelectrolyte brushes that ensure their stability against aggregation; they found a value to 19 kJ mol−1. However, to determine the activity of M–NPs, the activation energy is a difficult parameter to interpret, so k is used as a comparison criterion. Table 1 shows the kinetic parameters obtained in this work and those reported in literature.
| M–NPs | Size (nm) | k (mol m2 s−1) | Reference |
|---|---|---|---|
| a 25 °C.b Stabilized with CTAB.c Supported on polyelectrolytes.d On the surface of Fe3O4@dextrano.e Stabilized with exopolysaccharide. | |||
| 1 | 9.0 | 13.41 × 10⁻³ | This work |
| 2 | 15.0 | 2.79 × 10⁻³ | This work |
| 3 | 15.0 | 46.83 × 10⁻³ | This work |
| Au–NPsb | 6.5 | 50.00 × 10⁻² | 40 |
| Au–NPsc | 3.0 | 1.00 × 10⁻⁴ | 31 |
| Pd–NPsd | 4.0 | 1.51 × 10² | 41 |
| Ag–NPse | 2.5 | 1.00 × 10⁻⁴ | 42 |
If we compare the k obtained for the reduction reaction catalyzed by our Au–NPs (1–3) with other catalytic systems, we can note that they are in an intermediate region. The values found for k indicate that they are less active in relation to Au–NPs stabilized with CTAB. However, 1–3 are two orders of magnitude more active than other systems based on supported Au–NPs. On the other hand, 1–3 have a catalytic activity about a thousand times higher than the Ag–NPs. We can note that only Pd–NPs have a considerably higher k than the rest of the catalytic systems. It is important to mention that, a variety of parameters have been reported in the literature in order to compare the activity between different catalytic systems. Most of these studies simply make use of the pseudo-first order rate constant (kobs or kapp), without taking in consideration the catalyst loading. However, the determined value of TON (the number of moles of substrate/the number of moles of catalyst) for Au–NPs is around to 15![[thin space (1/6-em)]](https://www.rsc.org/images/entities/char_2009.gif) 000.
000.
Finally, it is important to mention that the synthesized nanoparticles not only showed an interesting catalytic effect in water even at room temperature, they can also be recovered and reused. Fig. 6 shows that after the first catalytic cycle there are significant losses in the conversion. Two possible explanations for this observation are: (i) the loss of Au–NP in the catalyst recovery process in each cycle or, (ii) since the catalytic mechanism proposed is a process on the surface of Au–NPs, where the reagents compete for the free regions, the active sites can be occupied or modified after the reaction. Further work is in development in our laboratories focusing on the recovery process in each cycle of these water-soluble Au–NPs.
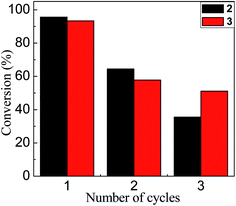 | ||
| Fig. 6 Conversion rate based on the number of cycles in which 2 (black bars) and 3 (red bars) were catalytically active. | ||
Experimental section
General
Tetrachloroauric acid (HAuCl4, Sigma-Aldrich) as the precursor and hydrazine monohydrate (N2H4·H2O, Sigma-Aldrich) as the reducing agent, both for the synthesis of Au–NPs were employed as received. The substrate 1,4-dinitrobenzene (DNB) from Sigma-Aldrich was employed as received. Ultrapure water was obtained from Labconco equipment model 90901-01. Imidazolium salts [1,3-bis(2,6-diisopropyl-4-sodiumsulfonatophenyl)imidazolium, 1-mesityl-3-(3-sulfonatopropyl)imidazolium and 1-(3-sulfonatopropyl)imidazolium] were prepared and characterized according to reported procedures.43,44Synthesis of water-soluble Au–NPs
A stock solution of metal precursor ([HAuCl4] = 0.06 M) was prepared in acetonitrile (Sintorgan HPLC quality). Following, an appropriate amount of this solution -to obtain a given concentration (1 × 10⁻⁴ M) of the metal precursor-was transferred to a volumetric flask, and the acetonitrile was evaporated by bubbling dry N2; then, 1 × 10⁻⁴ M aqueous solution of sulfonated-imidazolium salt was added. Hydrazine was dissolved in the same aqueous solution. Hydrazine (Hz) concentration was 1 × 10⁻³ M when mixed (without stirring) with the metal precursor solution. The time course of the reaction was 3 seconds. Then, when the Au–NPs (1–3) were formed, the suspensions turned pink along the time.25,26Catalytic experiments in water
The reactions were followed measuring the increase at the maximum absorption band of the p-nitroaniline (p-NA) at λmax = 380 nm (ε = 10![[thin space (1/6-em)]](https://www.rsc.org/images/entities/char_2009.gif) 427 M−1 cm−1) at different temperature, T1 = 25.0 ± 0.1 °C, T2 = 35.0 ± 0.1 °C and, T3 = 45.0 ± 0.1 °C. Absorbance values at different times, were recorded in a Hewlett–Packard, UV-visible 8453 spectrophotometer equipped with a thermostated cell (3 mL of volume and 1 cm path length).
427 M−1 cm−1) at different temperature, T1 = 25.0 ± 0.1 °C, T2 = 35.0 ± 0.1 °C and, T3 = 45.0 ± 0.1 °C. Absorbance values at different times, were recorded in a Hewlett–Packard, UV-visible 8453 spectrophotometer equipped with a thermostated cell (3 mL of volume and 1 cm path length).
The UV-visible spectroscopic analysis (Scheme 2) shows that the reduction of DNB catalyzed by Au–NPs in water, produces p-NA in quantitative yields.
 | ||
| Scheme 2 Reduction of DNB using Au–NPs (1–3) as a catalyst and representative absorption spectra of the reactive (black line) and product (red line) in water. | ||
To start a kinetic run, 0.1 M solution of hydrazine in water was prepared in presence of Au–NPs, [Au–NPs] = 1 × 10⁻⁸ M. In a thermostated cell that contained the hydrazine and Au–NPs solutions, the reduction reactions were initiated by addition of different μL of the stock solution of DNB in order to have 3 mL of solution with the desired [DNB] concentrations. DNB concentration in water between 1.5 × 10⁻⁵ M to 1.5 × 10⁻⁴ M was varied.
Recover of Au–NPs
After the reaction is concluded, the Au–NPs are removed from the reactions medium by centrifugations for 25 min at 13.000 RPM and washed with pure water. Then, Au–NPs are suspended with 3 mL of water and sonicated for 5 min. The surface plasmon resonance (SPR) of Au–NPs was checked by UV-visible. In addition, the complete removal of the substrate (DNB) was confirmed by UV spectroscopy. Finally, to start other catalytic reaction cycle, the desired amount of substrate is added from the stock solution.Langmuir–Hinshelwood (LH) model
To quantify the catalytic reduction of 1,4-dinitrobenzene reaction, the well-known equations of Langmuir–Hinshelwood were applied.31 It is an idealized model of bimolecular surface-mediated reactions and, involves certain considerable limitations in its application to real systems; nevertheless, it deserves some attention because this model is the basis for studying many reactions. The model assumes a uniform solid surface with no interaction between adsorbed species and, that the product of reaction is not absorbed on surface. In the LH model, the apparent kinetic rate constant, kapp, is strictly proportional to the total surface of nanoparticles (S) and the concentration of Hz. The, this can be defined through (eqn (3)).31,37
 | (3) |
 | (4) |
 | (4a) |
 | (4b) |
 | (5) |
 | (6) |
Eqn (6) allows to make the relation between the kapp values determined experimentally with the bimolecular rate constant values for each Au–NPs in solution, k. The S value of each Au–NPs can be calculated considering the analytical concentration, the size, the morphologic and, the degree of surface coverage of the Au–NPs incorporated into the reaction medium. These values have been determined in our research group and due reported26 (summarized in Table 2).
| Morphology | Spherical | Spherical | Spherical |
|---|---|---|---|
| Degree of surface coverage of the Au–NPsc (%) | 59 | 67 | 48 |
| Total surface area of the catalyst (m2) | 3.03 × 10⁻⁴ | 8.43 × 10⁻⁴ | 6.33 × 10⁻⁴ |
Conclusion
Three new water-soluble Au–NP (1–3) synthesized in our laboratory, proved to be an excellent active catalysts for the reduction of 1,4-dinitrobenzene at room temperature in water. In all cases, there is an induction time, and the activation energy found is suitable for restructuring at the surface of Au–NP, being consistent with other metal nanoparticles used for this reaction. Not least, all the nanoparticles were reusable in water for 3 cycles, using a quick, easy, economical and non-polluting method.Conflicts of interest
There are no conflicts to declare.Acknowledgements
Financial support from the Consejo Nacional de Investigaciones Científicas y Técnicas (PIP CONICET 112-2015-0100283), Universidad Nacional de Río Cuarto, Universidad Nacional del Sur, Agencia Nacional de Promoción Científica y Técnica (PICT-2015-2151 and PICT-2015-0585, PICT 2018-0507), and Ministerio de Ciencia y Tecnología (PID 2018, Gobierno de la provincia de Córdoba) is gratefully acknowledged. N. M. C., R. D. F., F. M. and, G. F. S. hold a research position at CONICET. G. M. thanks from CONICET for a research doctoral fellowship.References
- A. S. K. Hashmi and F. D. Toste, Modern Gold Catalyzed Synthesis, 2012 Search PubMed.
- F. D. Toste and V. Michelet, in Gold Catalysis, Imperial College Press, 2011, vol. 13, pp. i–xvii Search PubMed.
- M. Pan, J. Yang, K. Liu, Z. Yin, T. Ma, S. Liu, L. Xu and S. Wang, Nanomaterials, 2020, 10, 209 CrossRef CAS PubMed.
- W. Guo, J. J. Li, Y. A. Wang and X. Peng, Chem. Mater., 2003, 15, 3125–3133 CrossRef CAS.
- K. Saha, S. S. Agasti, C. Kim, X. Li and V. M. Rotello, Chem. Rev., 2012, 112, 2739–2779 CrossRef CAS.
- T. Wang, S. Zhou, C. Zhang, J. Lian, Y. Liang and W. Yuan, New J. Chem., 2014, 38, 46–49 RSC.
- V. G. Kravets, A. V. Kabashin, W. L. Barnes and A. N. Grigorenko, Chem. Rev., 2018, 118, 5912–5951 CrossRef CAS PubMed.
- P. Poizot, S. Laruelle, S. Grugeon, L. Dupont and J.-M. Tarascon, Nature, 2000, 407, 496–499 CrossRef CAS PubMed.
- L. Armelao, S. Quici, F. Barigelletti, G. Accorsi, G. Bottaro, M. Cavazzini and E. Tondello, Coord. Chem. Rev., 2010, 254, 487–505 CrossRef CAS.
- S. Navalon, A. Dhakshinamoorthy, M. Alvaro and H. Garcia, Coord. Chem. Rev., 2016, 312, 99–148 CrossRef CAS.
- J. M. Walker and J. M. Zaleski, Nanoscale, 2016, 8, 1535–1544 RSC.
- P. Zhao, X. Feng, D. Huang, G. Yang and D. Astruc, Coord. Chem. Rev., 2015, 287, 114–136 CrossRef CAS.
- M. Tamura and H. Fujihara, J. Am. Chem. Soc., 2003, 125, 15742–15743 CrossRef CAS PubMed.
- M. V. Vasylyev, G. Maayan, Y. Hovav, A. Haimov and R. Neumann, Org. Lett., 2006, 8, 5445–5448 CrossRef CAS PubMed.
- C. Vollmer and C. Janiak, Coord. Chem. Rev., 2011, 255, 2039–2057 CrossRef CAS.
- N. Yan, C. Xiao and Y. Kou, Coord. Chem. Rev., 2010, 254, 1179–1218 CrossRef CAS.
- E. Guyonnet Bilé, R. Sassine, A. Denicourt-Nowicki, F. Launay and A. Roucoux, Dalton Trans., 2011, 40, 6524–6531 RSC.
- S. Wegner and C. Janiak, in Ionic Liquids II, ed. B. Kirchner and E. Perlt, Springer International Publishing, Cham, 2017, pp. 153–184 Search PubMed.
- E. C. Hurst, K. Wilson, I. J. S. Fairlamb and V. Chechik, New J. Chem., 2009, 33, 1837–1840 RSC.
- J. Vignolle and T. D. Tilley, Chem. Commun., 2009, 7230–7232 RSC.
- X. Ling, N. Schaeffer, S. Roland and M.-P. Pileni, Langmuir, 2013, 29, 12647–12656 CrossRef CAS PubMed.
- A. Ferry, K. Schaepe, P. Tegeder, C. Richter, K. M. Chepiga, B. J. Ravoo and F. Glorius, ACS Catal., 2015, 5, 5414–5420 CrossRef CAS.
- E. A. Baquero, S. Tricard, J. C. Flores, E. de Jesús and B. Chaudret, Angew. Chem., Int. Ed., 2014, 53, 13220–13224 CrossRef CAS PubMed.
- B. S. Souza, E. C. Leopoldino, D. W. Tondo, J. Dupont and F. Nome, Langmuir, 2012, 28, 833–840 CrossRef CAS PubMed.
- G. A. Monti, G. A. Fernández, N. M. Correa, R. D. Falcone, F. Moyano and G. F. Silbestri, R. Soc. Open Sci., 2017, 4, 1–7 CrossRef PubMed.
- G. A. Monti, N. M. Correa, R. D. Falcone, G. F. Silbestri and F. Moyano, ChemistrySelect, 2019, 4, 13496–13502 CrossRef CAS.
- P. Hervés, M. Pérez-Lorenzo, L. M. Liz-Marzán, J. Dzubiella, Y. Lu and M. Ballauff, Chem. Soc. Rev., 2012, 41, 5577–5587 RSC.
- N. Pradhan, A. Pal and T. Pal, Colloids Surf., A, 2002, 196, 247–257 CrossRef CAS.
- K. Esumi, R. Isono and T. Yoshimura, Langmuir, 2004, 20, 237–243 CrossRef CAS PubMed.
- A. Grirrane, A. Corma and H. Garcia, Nat. Protoc., 2010, 5, 429–438 CrossRef CAS PubMed.
- S. Wunder, F. Polzer, Y. Lu, Y. Mei and M. Ballauff, J. Phys. Chem. C, 2010, 114, 8814–8820 CrossRef CAS.
- S. Sarkar, A. K. Sinha, M. Pradhan, M. Basu, Y. Negishi and T. Pal, J. Phys. Chem. C, 2011, 115, 1659–1673 CrossRef CAS.
- J. Zeng, Q. Zhang, J. Chen and Y. Xia, Nano Lett., 2010, 10, 30–35 CrossRef CAS PubMed.
- M. Nasrollahzadeh, M. Maham and S. Mohammad Sajadi, J. Colloid Interface Sci., 2015, 455, 245–253 CrossRef CAS PubMed.
- S. Wunder, Y. Lu, M. Albrecht and M. Ballauff, ACS Catal., 2011, 1, 908–916 CrossRef CAS.
- M. Nemanashi and R. Meijboom, J. Colloid Interface Sci., 2013, 389, 260–267 CrossRef CAS PubMed.
- S. Gu, S. Wunder, Y. Lu, M. Ballauff, R. Fenger, K. Rademann, B. Jaquet and A. Zaccone, J. Phys. Chem. C, 2014, 118, 18618–18625 CrossRef CAS.
- Note: number of imidazolium salt per mn2 for: 2 is 189 while for 3 is 121 according.
- N. Lee, D.-W. Lee and S.-M. Lee, Biomacromolecules, 2018, 19, 4534–4541 CrossRef CAS PubMed.
- R. Fenger, E. Fertitta, H. Kirmse, A. F. Thünemann and K. Rademann, Phys. Chem. Chem. Phys., 2012, 14, 9343–9349 RSC.
- L. R. S. Lara, A. D. Zottis, W. C. Elias, D. Faggion, C. E. Maduro de Campos, J. J. S. Acuña and J. B. Domingos, RSC Adv., 2015, 5, 8289–8296 RSC.
- Z. Zheng, Q. Huang, H. Guan and S. Liu, RSC Adv., 2015, 5, 69790–69799 RSC.
- G. A. Fernández, A. B. Chopa and G. F. Silbestri, Catal. Sci. Technol., 2016, 6, 1921–1929 RSC.
- C. Fleckenstein, S. Roy, S. Leuthäußer and H. Plenio, Chem. Commun., 2007, 2870–2872 RSC.
| This journal is © The Royal Society of Chemistry 2020 |

