 Open Access Article
Structural, optical and photocatalytic properties of erbium (Er3+) and yttrium (Y3+) doped TiO2 thin films with remarkable self-cleaning super-hydrophilic properties†
Raquel da Silva Cardosoa,
Suélen Maria de Amorima,
Gidiane Scarattia,
Camilla Daniela Moura-Nickel a,
Rodrigo Peralta Muniz Moreirab,
Gianluca Li Pumab and
Regina de Fatima Peralta Muniz Moreira
 *a
*a
aDepartment of Chemical and Food Engineering, Federal University of Santa Catarina, Florianópolis, Brazil. E-mail: regina.moreira@ufsc.br
bEnvironmental Nanocatalysis & Photoreaction Engineering, Department of Chemical Engineering, Loughborough University, UK
First published on 4th May 2020
Abstract
The self-cleaning and super hydrophilic properties of pristine TiO2 and of TiO2 doped with Er3+ or Y3+ transparent thin films deposited onto glass substrates were investigated. The thin films prepared by multiple dipping and drying cycles of the glass substrate into the pristine TiO2 sol and Er3+ or Y3+-doped TiO2 sol were characterized by X-ray diffraction, UV-vis spectrophotometry, and atomic force microscopy (AFM). The self-cleaning photocatalytic activity of the thin films towards the removal of oleic acid deposited on the surface under UVA irradiation was evaluated. A remarkable enhancement was observed in the hydrophilic nature of the TiO2 thin films under irradiation. The optical properties and wettability of TiO2 were not affected by Er3+ or Y3+ doping. However, the photocatalytic degradation of oleic acid under UVA irradiation improved up to 1.83 or 1.95 fold as the Er3+ or Y3+ content increased, respectively, due to the enhanced separation of the photogenerated carriers and reduced crystallite size. AFM analysis showed that the surface roughness increased by increasing the Er3+ or Y3+ content due to the formation of large aggregates. This in turn contributes to the increase of the active surface area enhancing the photodegradation process. This study demonstrates that TiO2 doped with low amounts of Er3+ or Y3+ down to 0.5 mol% can produce transparent, super-hydrophilic, thin film surfaces with remarkable self-cleaning properties.
Introduction
Heterogeneous photocatalysis is a process initiated by the photogeneration of conduction band electrons and valence band holes in a semiconductor material irradiated with band gap photons. The electron–hole charges, after migration to the catalyst interphase, can initiate coupled reduction and oxidation reactions, respectively with electron acceptors and electron donors species adsorbed on or near the surface of the semiconductor.1,2 Such a process has been exploited in environmental decontamination, production of renewable energy carriers and in the manufacture of smart and self-cleaning materials.The most common semiconductor photocatalyst is titanium dioxide (TiO2), due to its physico-chemical properties and ability to promote efficient photoinduced phenomena. In the absence of light irradiation, under darkness, the surface of TiO2 thin films exhibits hydrophobic properties. However, under UV light irradiation the surface becomes super-hydrophilic and such process is exploited in the manufacture of self-cleaning materials, such as glass windows. The mechanism of light induced hydrophilicity of TiO2 relies on the hydroxylation of the catalyst surface under irradiation, which is driven by the conduction band electrons reduction of Ti4+ that yields Ti3+ and by the generation of oxygen vacancies via the hole-oxidation of the bridging O2− to O2. Thus, hydroxyl ions from water can be preferentially adsorbed onto the TiO2 oxygen vacancies inducing hydrophilicity of the TiO2 surface.1 Under these conditions, water wetting on the TiO2 surface forms a continuous thin water film that carries away dirt particulates from the substrate surface, cleaning the surface.
Photocatalytic, thin-film, self-cleaning surfaces are also able to kill and prevent the attachment of bacteria on the coated surfaces, and this has been exploited to prevent the spread and diffusion of infections.2,3 TiO2 is one of few low-cost materials known to show photoinduced hydrophilicity and switchable wettability and photocatalytic activity under light illumination.4 Thin films of TiO2 have been immobilized on different support materials, such as wool fabrics, glass and polymers.4–7 Doping of TiO2 with metals has been used as a strategy to improve the intrinsic photocatalytic activity of TiO2.8–17 The doping of TiO2 with rare earths, such as erbium (Er)11 and yttrium (Y)12 has shown a 2 to 3-fold increase in the photocatalytic degradation of dyes in aqueous catalyst suspensions. This higher activity is ascribed to the transition of 4f electrons of Er3+ or Y3+ and to the red shifts of the optical absorption edge of TiO2 due to the rare earth doping,10,12 which reduces the bandgap and improves separation of electron–hole pairs.12
Only a few studies have investigated the properties of immobilized TiO2 thin films doped with rare earths or polymer modified-TiO2 thin films13 to improve the photocatalytic activity. A study on the structural and spectroscopic properties of ytterbium (Yb) and thulium (Tm) doped TiO2 thin films deposited by the ultrasonic spray pyrolysis technique demonstrated that rare earth doping prevented the phase transition from anatase to rutile up to annealing temperatures of 800 °C.14 Other studies on thin films of Yb doped TiO2![[thin space (1/6-em)]](https://www.rsc.org/images/entities/char_2009.gif) 15,16 and Y doped TiO2
15,16 and Y doped TiO2![[thin space (1/6-em)]](https://www.rsc.org/images/entities/char_2009.gif) 17 prepared by spin coating and by the magnetron sputtering technique revealed adverse effects of rare earth doping on photocatalytic activity at concentrations of 2 wt% or higher but a positive effect at very low concentrations of 0.5 wt% was observed. On the other hand, doped TiO2 thin films produced by magnetron sputtering17 were composed of fully oxidized states of the two elements (Y or Ti), Y2O3–TiO2 composite oxides. The growth of the TiO2 crystal in the films was inhibited by the presence of the Y2O3 phase and the films were essentially amorphous. However, the UV-vis transmittance of the films decreased whereas their reflectance increased slightly, causing a decrease of the photocatalytic activity of Y-doped TiO2 films.
17 prepared by spin coating and by the magnetron sputtering technique revealed adverse effects of rare earth doping on photocatalytic activity at concentrations of 2 wt% or higher but a positive effect at very low concentrations of 0.5 wt% was observed. On the other hand, doped TiO2 thin films produced by magnetron sputtering17 were composed of fully oxidized states of the two elements (Y or Ti), Y2O3–TiO2 composite oxides. The growth of the TiO2 crystal in the films was inhibited by the presence of the Y2O3 phase and the films were essentially amorphous. However, the UV-vis transmittance of the films decreased whereas their reflectance increased slightly, causing a decrease of the photocatalytic activity of Y-doped TiO2 films.
In this study, the structural, optical and photocatalytic properties of Er3+ and Y3+ doped TiO2 thin films exhibiting remarkable self-cleaning super-hydrophilic properties under light irradiation were investigated. The transparent, thin films deposited on glass were prepared by the simpler sol–gel dip coating method to allow accurate control of the chemical composition of the films. Using this deposition technique very thin film were formed that were subsequently thermally treated to eliminate the excess solvent present, causing shrinkage and densification of the photocatalytic film.6,18 The impact of Er and Y loading was assessed in order to determine the lowest amount necessary to impart remarkable self-cleaning and super-hydrophilic properties to the films.
Experimental section
Y3+ or Er3+-doped and undoped TiO2 thin films: preparation and characterization
Thin films were prepared on soda-lime microscopy slide glass surfaces by the sol–gel dip coating method. In the synthesis process, 0.61 mL of the stabilizing agent acetylacetone (A.R., Neon) was added to 69 mL of isopropanol (A.R., Vetec) to control the hydrolysis and condensation reactions. Then, 6 mL of the titanium alkoxide pre-titrating agent titanium tetraisopropoxide (TTIP, 97.0%, Sigma-Aldrich) was introduced into the same mixture. After 30 min magnetic stirring, 6.86 mL of acetic acid (A.R., Dinâmica) was added and the solution was kept under magnetic stirring for a further 30 min.The Er3+ or Y3+-doped TiO2 samples were produced by dissolving the desired molar amount of erbium(III) pentahydrate nitrate (99.9%, Sigma-Aldrich) or yttrium(III) hexahydrate nitrate (99.9%, Sigma-Aldrich) in distilled water and dropwise transferring the solution to the previously synthesized sol solution. The Er3+ or Y3+ content in the samples for this study were 0; 0.25 mol%; 0.50 mol%; and 1.00 mol%.
The glass substrates (25 mm × 85 mm) were pre-cleaned ultrasonically with acetone for 15 min, rinsed with ethanol and distilled water, and then dipped into the sol solution. The withdrawing speed was 2.1 mm s−1. The coated substrates were then thermally treated at 450 °C or 500 °C to remove the organic compounds from the glass surface. This procedure was repeated up to 3 times on the same glass substrate to produce thin and transparent films, designated as TxCw + zRE3+, where x is the temperature used in the thermal treatment, w is the number of immersion/emersion cycles, z is the molar percentage of rare earth, and RE3+ is Y3+ or Er3+.
The morphological properties of the films were obtained by combining several techniques. The surface relief of the films was examined by the atomic force microscopy (AFM) technique using an Asylum Research microscope (Model MFP 30) with amplitude modulation AFM imaging (tapping mode), a resonance frequency of 30 kHz and a spring constant of 42 N m−1. The root mean square (RMS) average roughness was determined using the Gwyddion software program, version 2.22.
The crystallinity was determined by X-ray diffraction (XRD) analysis of the powders previously dried at 100 °C for 24 h, using a Philips X ′Pert X-ray diffractometer equipped with Cu Kα at 40 kV and 30 mA, θ–2θ and λ = 1.54056 Å, with a scanning speed of 2θ from 0° to 80°. The thermal stability of the dried powders was determined in a Shimadzu DTG-60 analyzer, under N2 atmosphere with a flow rate of 50 mL min−1 and at a constant temperature gradient of 10 °C min−1. To establish the surface area and porous structure of the powdered photocatalysts, the corresponding N2 adsorption–desorption isotherms were measured at 77 K using an automatic absorptometer (Autosorb 1C, Quantachrome, USA).
The optical transmittance in the wavelength of 300–800 nm was examined using a UV spectrophotometer (Hach DR 5000, Germany).
Determination of the apparent water contact angle on glass surface
Standard protocols were used to evaluate the apparent water contact angle and photocatalytic activity.19 Prior to the measurement of the contact angle, all samples were cleaned in acetone and irradiated for 24 h under UVA irradiation (light source 8 W, GENERIC; UV intensity 20.38 W m−2). The apparent water contact angle in air for the samples was measured with a contact angle meter (Ramé-Hart Inst. Co. 250-F1 goniometer) at ambient temperature (water temperature 20–25 °C). For each measurement a 2 μL water was used and at least 3 different positions on the surface of the sample were examined and the average value was determined.Photocatalytic degradation of oleic acid
Six identical pieces of coated glass were rinsed with acetone and then irradiated for 24 h under UVA irradiation (light source 8 W, GENERIC; UV intensity 20.38 W m−2). A sufficient fixed amount of oleic acid (OA) was applied with a loading of 21.8 μg cm−2, which corresponds to approximately 240 nm or 120 monolayers of a uniform film.20 The samples were placed inside a UV chamber at room temperature and, at regular time intervals, the apparent water contact angle on the coated glass surface was measured using a contact angle meter (Ramé-Hart Inst. Co. 250-F1). Five measurements were carried out at five different positions on the surface of each piece at regular time intervals for 100 h.As previously reported by Manole et al.,21 an exponential decay of the water/oleic acid contact angle can be used to describe the self-cleaning properties and the removal of oleic acid from a photoactive surface. The photocatalytic degradation of oleic acid was therefore described as a pseudo-first-order reaction (eqn (1)):
 | (1) |
Results and discussion
Thermal analysis of powdered samples
The results for the thermogravimetric analysis of the powdered samples (uncalcined) are shown in Fig. 1.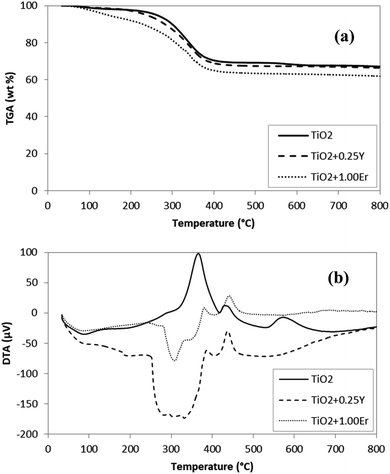 | ||
| Fig. 1 TGA (a) and DTA (b) curves for undoped (TiO2) and powdered doped samples (TiO2 + 0.25Y and TiO2 + 1.00Er). | ||
The mass loss of undoped TiO2 in the temperature range of 250–450 °C is attributed to combustion of non-hydrolyzed isopropoxide binders and other organic substances bound to the titania particles.18 Thus, temperatures at or above 450 °C were required to obtain titanium dioxide (TiO2) in the gel form. At temperatures close to 600 °C, the phase transition anatase to rutile occurs in the undoped TiO2, without mass loss.22 This crystalline phase change can also be observed on the DTA curve for the undoped TiO2 in Fig. 1b, with the exothermic peak starting at approximately 550 °C.
The Er3+ or Y3+ doped TiO2 samples also exhibited a mass loss between 250–450 °C, ascribed to the combustion of non-hydrolyzed isopropoxide binders and other organic substances bound to the titania particles and to the thermal decomposition of yttrium nitrate23 or erbium nitrate,24 as shown in Fig. 1a. The endothermic peaks associated with the anatase-rutile phase transition at 600 °C for the undoped sample, were not observed on the Y3+–TiO2 or Er3+–TiO2 samples, indicating that these rare earths thermally stabilized the TiO2 crystallite transition phase. Such behavior has also been observed in Yb and Tm doped TiO2 thin films.14
Fig. 2 shows the diffractograms of the powdered doped samples calcined at 450 °C (T450 + 0.25Y; T450 + 0.50Y; T450 + 0.25Er; T450 + 0.50Er; and T450 + 1.00Er) and undoped TiO2 calcined at 450 °C (T450) or 500 °C (T500). All undoped samples peaks are attributed to the anatase phase, with no peaks related to rutile or any other phases being observed. The samples shows diffraction peaks characteristic of the anatase TiO2 crystal planes (101), (004), (200), (105), (211), (204), (116), (220) and (215) at 2θ = 25.3°, 37.8°, 48.1°, 53.9°, 55.0°, 62.7°, 68.7°, 70.3° and 75.2°.25 The Y3+ or Er3+-doped TiO2 samples were also composed of the anatase phase only.
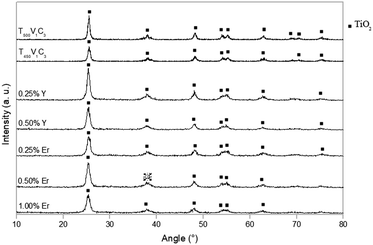 | ||
| Fig. 2 XRD diffractograms for powdered undoped and Y3+ or Er3+ doped TiO2 samples (symbols: TiO2 anatase). | ||
In the doped samples, the variation in the XRD peak intensity was not pronounced because the dopant was below 1 mol%. The apparent crystallite size determined by the Scherrer equation using the (101) anatase plane24 decreased with increasing amount of yttrium or erbium (Table 1). Crystallite sizes along other orientations could not be estimated due to lack of adequate intensity.
| Sample powdered | Average size of crystallites (Å) |
|---|---|
| T450 | 161.0 ± 12.0 |
| T500 | 190.0 ± 17.0 |
| T450 + 0.25Y | 110.6 ± 14.3 |
| T450 + 0.50Y | 109.6 ± 5.2 |
| T450 + 0.25Er | 89.4 ± 13.6 |
| T450 + 0.50Er | 98.8 ± 9.1 |
| T450 + 1.00Er | 81.2 ± 9.7 |
It is assumed that Y3+ or Er3+ doping hinders the growth of the crystallite due to the segregation of the dopant cations at the grain boundary.26,27 Moreover, the replacement of Ti4+ in TiO2 by RE3+ ions results in the loss of one electron, which would be compensated for by the formation of one oxygen vacancy. As a result, the photocatalytic activity might be improved.11 Moreover, the inhibition of phase transition from anatase to rutile, TiO2 lattice distortion, and forming smaller grains, could result in a significant improvement in the hydrophilicity and photoreactivity of Y3+ or Er3+ doped TiO2.
The presence of the Er2Ti2O7 phase in the Er3+–TiO2 was not found at 2θ equal to 32°,28 since its formation would be expected only when the sample is heated at temperatures higher than >500 °C.29,30 The existence of Er2Ti2O7 crystallites would be the key factor for upconversion transforming visible light into UV light.15
The UV-vis spectra of the Y3+, Er3+ and bare TiO2 samples are shown and discussed in Fig S1†.
Optical transmittances of doped and undoped TiO2 thin films
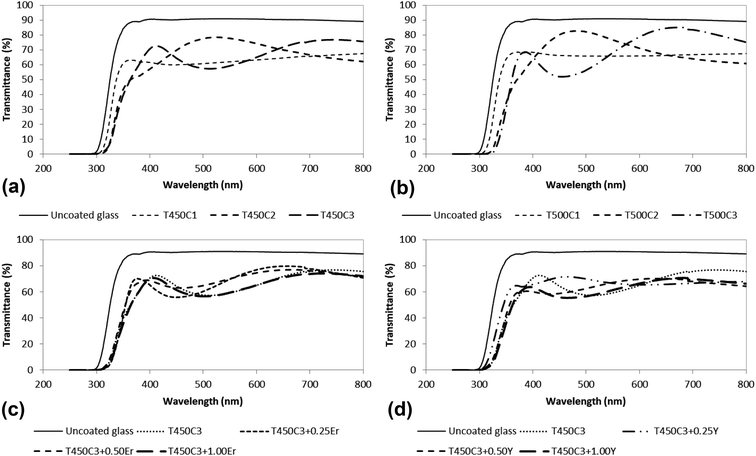
High visible light transmittance is an indispensable requirement for the application of these TiO2 thin films on transparent window glass. High light transmittance of the undoped and of the Er3+ or Y3+ doped TiO2 thin films on glass exceeding 60% in the visible range was observed (Fig. 3).The optical transmittance was nearly the same considering the number of thin film layers deposited on the glass (Fig. 3a), the temperature of the thermal treatment (Fig. 3a and b), and the yttrium (Fig. 3c) or erbium (Fig. 3d) content. The thickness of the TiO2 films is expected to increase linearly by repeating the dipping and heat-treatment cycles.31 Film thickness obtained by single, double or triple dipping should be sufficiently high to achieve effective self-cleaning properties without deterioration of the film optical quality.
The transparency of thin films is influenced by several factors, such as the scattering of light by the surface and volume defects, however, the associated mechanisms are not yet clearly understood. In general, the film thickness should not be higher than 1 μm to maintain a high light transmittance in the range of 300–800 nm.10 The dip coating deposition technique produced transparent coated glass, in a simple and non-expensive method, that may meet a wide range of practical applications.
Contact angle and surface roughness
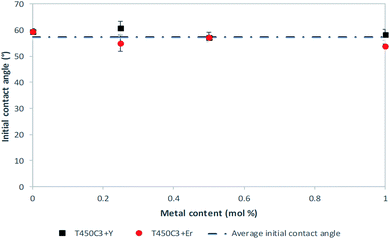
Hydrophilicity is an extremely important characteristic for the analysis of self-cleaning materials, since it regulates the interactions between dirt particulate and the substrate surface. Hydrophilic surfaces have a strong interaction with water and water vapor and a thin transparent aqueous film able to spread easily over the entire surface could remove dirt (self-cleaning) and impart anti-fog properties.Fig. 4 shows the apparent water contact angles of the coated and uncoated glass samples. The apparent water contact angle was zero for all coated glass samples produced in this study, indicating a superhydrophilic character. The superhydrophilicity of TiO2 coatings is a result of the reaction of adsorbed water on the illuminated surface (reactions (2) to (5)).
| TiO2 + hυ → h+ + e− (charge pair generation) | (2) |
| Ti4+ + e− → Ti3+ (surface trapped electron) | (3) |
 | (4) |
| H2O + oxygen vacancy → ˙OH | (5) |
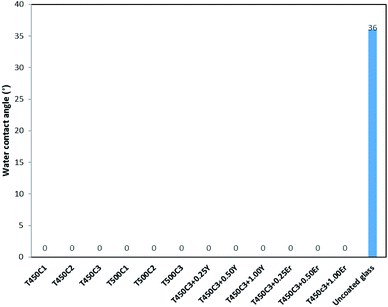 | ||
| Fig. 4 Apparent water contact angles for the doped and undoped TiO2 thin film glass after 24 h UVA irradiation. | ||
Rare earth doping can provide a dopant level close to the valence band of TiO2. The electronic transition from the modified dopant band to the conduction band effectively improves, and the hole–electron recombination decreases. The electrons tend to reduce Ti4+ to Ti3+, oxygen atoms are ejected and oxygen vacancies are created, producing more Ti defects. Water molecules thus can occupy these oxygen vacancies, producing adsorbed hydroxyl groups. The increase in the hydroxyl content on the surface of TiO2 thin films makes the surface hydrophilic, since the hydroxyl can form hydrogen bonds with water. Moreover, the chemisorbed hydroxyl groups can stabilize the structure of Ti3+–OH, which also results in the enhancement of hydrophilicity. Although the superhydrophilicity of TiO2-coated glass has been widely reported,12 this is the first time that the super hydrophilic character and zero-water contact angle is reported for Y3+–TiO2 or Er3+–TiO2 coated glass.
The surface structure, morphology and roughness of the undoped and doped TiO2 thin films were analyzed by AFM (Fig. 5). The images of the scanned surface reveal that the films were uniform, homogeneous and densely packed with small grains. A columnar structure was observed in the 3D AFM images, which indicated that growth occurred in the (101) plane of the films. Agglomerated particles were observed in the Y3+ or Er3+ doped samples. These agglomerated particles increased in size with the Y3+ or Er3+ content, resulting in increased surface roughness. The undoped TiO2 thin film (T450C3) was the smoothest sample, with a roughness of 2.0 ± 0.3 nm, and uniform distribution of TiO2 on the substrate (Fig. 5a). The AFM images for the doped samples show a change in topography with increasing Y3+ or Er3+ content. The increasing roughness is a result of the aggregation of the nanoparticles.
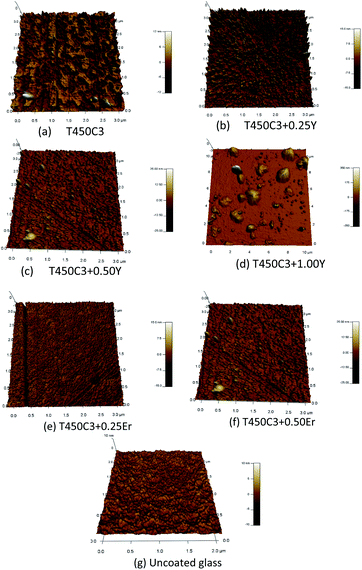 | ||
| Fig. 5 AFM images of the thin films on the glass: (a) T450C3; (b) T450C3 + 0.25%Y; (c) T450C3 + 0.50%Y; (d) T450C3 + 1.00%Y; (e) T450C3 + 0.25%Er; and (f) T450C3 + 0.50%Er; (g) uncoated glass. | ||
The root mean square (RMS) roughness values are shown in Table 2 shows a direct correlation of surface roughness within increasing Er3+ or Y3+ doping level, as well as the presence of large aggregates at higher Y3+ or Er3+ content. The increased roughness in the Er3+ or Y3+ doped TiO2 samples increases the active surface area and thus enhance the photodegradation process.32 As observed from the AFM results, the roughness of the TiO2 film increases with Y3+ or Er3+ doping, that is in agreement with the apparent water angle contact results for hydrophilic surfaces.33,34 In fact, the BET surface of the powdered TiO2 samples increased from 27.5 m2 g−1 to 93.4 m2 g−1 when33 the Er3+ content increased from zero to 1.0 wt%.
| Sample | RMS (nm) |
|---|---|
| Uncoated glass | 1.0 ± 0.7 |
| T450C3 | 2.0 ± 0.3 |
| T450C3 + 0.25Y | 2.2 ± 0.2 |
| T450C3 + 0.50Y | 3.3 ± 1.9 |
| T450C3 + 1.00Y | 31.0 ± 4.5 |
| T450C3 + 0.25Er | 2.4 ± 2.2 |
| T450C3 + 0.50Er | 4.8 ± 0.8 |
Photocatalytic degradation of oleic acid and self-cleaning effect
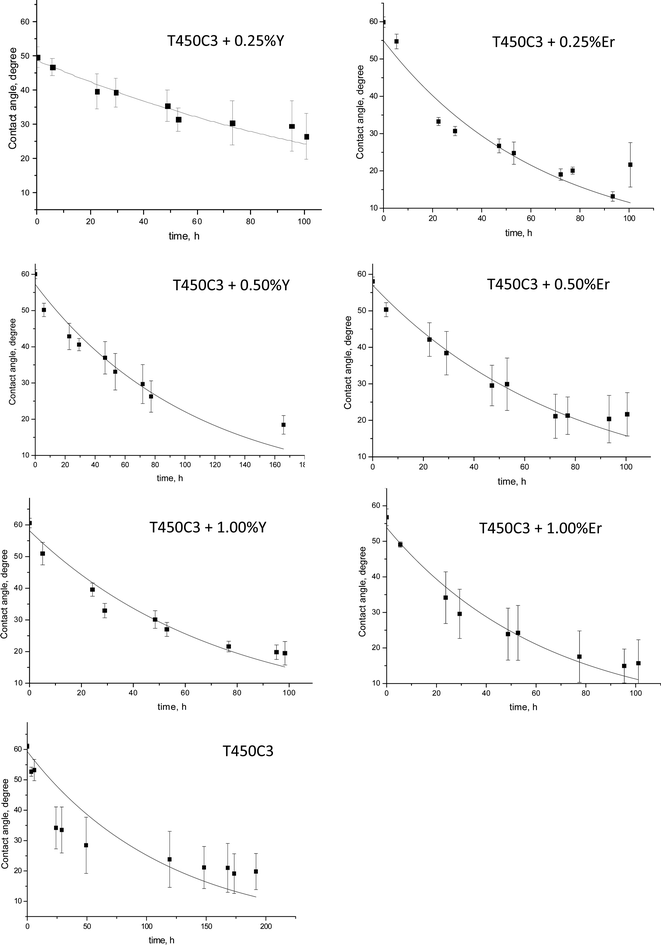
The kinetics of the conversion of oleic acid (C18H34O2) provide the basis for the ISO 27448 method19 to evaluate the performance of photocatalytic and self-cleaning surfaces.The average initial water contact angle on the oleic acid-coated surface, taken at five different points, for 5 different samples of each coated glass did not depend on the nature of the surface since the surface was fully covered with oleic acid (Fig. 6).
The mechanism associated with the photodegradation of oleic acid on TiO2 has not been completely described, but it is known that some organic aldehydes and acid compounds (9-oxononanoic acid, azelaic acid, nonanoic acid, heptanal, octanal, nonanal and decanal) are the main intermediates of this photocatalytic reaction.35 Thus, the water contact angle of the irradiated photocatalytic coated glass decreased as the oleic acid on the surface degraded.
While the majority of reports in the literature provide only initial and final contact angle values, the monitoring of the contact angle over the reaction time could be used as an indicator of the surface cleaning process.20,21,36,37 This analysis method can produce quantitative results, which are closely related to those obtained from the traditional techniques of FTIR, AFM or gravimetry.36 When the surface was irradiated, a continuous decrease in the contact angle was observed on both undoped and doped TiO2-coated surface which is indicative of the oleic acid photocatalytic degradation (Fig. 7).
In contrast, the uncoated glass surface did not exhibit oleic acid degradation. The pseudo-first-order rate constant (k) for the oleic acid photocatalytic degradation on TiO2, Y–TiO2 or Er–TiO2 coated glass is shown in Fig. 8.
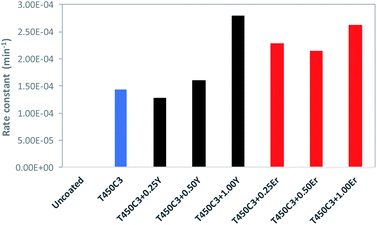 | ||
| Fig. 8 Pseudo-first-order rate constant for oleic acid degradation of different TiO2-coated glass samples. | ||
The results show that as the yttrium or erbium content increased up to 1 wt%, the photocatalytic activity and self-cleaning properties of the coated glass also increased. This effect may be attributed to a series of factors in the Er3+ or Y3+ doped samples, including the reduction of the crystallite size TiO2, the increased roughness and surface area (Table 1) the reduced band-gap and the enhanced separation of the photogenerated carriers.38 Er3+ doped TiO2 performed far better than Y3+ doped TiO2, since Er3+ doped thin films present higher roughness and smaller crystallite sizes.
As shown in Tables 1 and 2, the doping using very small amount of Y3+ (0.25%), no significative difference was observed on the roughness (2.0 ± 0.3 nm and 2.2 ± 0.2 nm, for T450C3 and T450C3 + 0.25Y, respectively), although there is a significative difference on the crystallite size (161.0 ± 12.0 A and 110.6 ± 14.3 A, for T450C3 and T450C3 + 0.25Y, respectively). Thus, an insignificant effect on oleic acid degradation was observed comparing the T450C3 and T450C3 + 0.25T thins films (see Fig. 8).
Despite Zhang et al.17 has shown that the photocatalytic activity of Y2O3 doped TiO2 thin film decreases for Y dopant concentration higher than 2 wt%, the homogeneity and low rare earth metal dopant used in this study proved that it is a suitable way to improve the superhydrophilic character of glass surface.
Conclusions
The rough undoped TiO2 or doped Y3+–TiO2 and Er3+–TiO2 films are efficient photocatalysts for the decomposition of thin layers of oleic acid deposited on their surfaces and exhibit a remarkable superhydrophilic character. The kinetics of the oleic acid film degradation was studied by monitoring the apparent water contact angle and this process was described by a pseudo-first-order reaction. It was observed that the photocatalytic activity and self-cleaning character of the coated glass increases with the yttrium or erbium content. The increased roughness with Er3+ or Y3+ doping greatly enhances the surface area and thus the photodegradation process and self-cleaning process. The anatase crystal phase was identified, however, the diffraction peaks of TiO2 became broader and weaker with increasing Er3+ or Y3+ concentration, due to a reduction in the crystallite size. Thus, Er3+ or Y3+ doping can hinder the growth of the crystallite due to the segregation of the dopant cations at the grain boundary. This study demonstrates that low loadings of Er3+ or Y3+ down to 0.5 mol% can produce transparent, super-hydrophilic surfaces with remarkable self-cleaning properties.Conflicts of interest
There are no conflicts to declare.Acknowledgements
The authors would like to acknowledge the Brazilian government agencies CAPES/Brazil (Coordenação de Aperfeiçoamento de Pessoal de Nível Superior, Project number 88887.310560/2018-00) and CNPq/Brazil (Conselho Nacional de Desenvolvimento Cientifíco e Tecnológico, Grants 405.223/2018-8 and 301.479/2018-6) for the financial support.References
- K. Midtdal and B. P. Jelle, Sol. Energy Mater. Sol. Cells, 2013, 109, 126 CrossRef CAS.
- A. Fujishima, X. Zhang and D. A. Tryk, Surf. Sci. Rep., 2008, 63, 515 CrossRef CAS.
- S. Banerjee, D. D. Dionysiou and S. C. Pillai, Appl. Catal., B, 2015, 176–177, 396 CrossRef CAS.
- Y. Zhang, Z. Jiang, J. Huang, L. Y. Lim, W. Li, J. Deng, D. Gong, Y. Tang, Y. Lai and Z. Chem, RSC Adv., 2015, 5, 79479 RSC.
- V. A. Ganesh, A. S. Nair, H. K. Raut, T. M. Walsh and S. Ramakrishna, RSC Adv., 2012, 2, 2067 RSC.
- D. Wang, S. C. Pillai, S.-H. Ho, J. Zeng, Y. Li and D. D. Dionysiou, Appl. Catal., B, 2018, 279, 721 CrossRef.
- R. Sadowski, A. Wach, M. Buchalska, P. Kustrowski and W. Macyk, Appl. Surf. Sci., 2019, 475, 710 CrossRef CAS.
- B. J. Cha, S. Saqlin, H. O. Seo and Y. D. Kim, Appl. Surf. Sci., 2019, 479, 31–38 CrossRef CAS.
- S. Bingham and W. A. Daoud, J. Mater. Chem., 2011, 21, 2041 RSC.
- M. Pelaez, N. T. Nolan, S. C. Pillai, M. K. Seery, P. Falaras, A. G. Kontos, P. S. M. Dunlop, J. W. J. Hamilton, J. A. Byrne, K. O'Shea, M. H. Entezari and D. D. Dionysiou, Appl. Catal., B, 2012, 125, 331 CrossRef CAS.
- D. Y. Lee, J.-T. Kim, J.-H. Park, Y.-H. Kim, I.-K. Lee, M.-H. Lee and B.-Y. Kim, Current Applied Physics, 2013, 13, 1301 CrossRef.
- M. Khan and W. Cao, J. Mol. Catal. A: Chem., 2013, 376, 71 CrossRef CAS.
- H. Xie, B. Liu and X. Zhao, Chem. Eng. J., 2016, 284, 1156 CrossRef CAS.
- S. Forissier, H. Roussel, P. Chaudouet, A. Pereira, J.-L. Deschanvres and B. Moine, J. Therm. Spray Technol., 2012, 21, 1263 CrossRef CAS.
- J. A. Borrego Pérez, M. Courel, M. Pal, F. P. Delgado and N. R. Mathews, Ceram. Int., 2017, 43, 155777 Search PubMed.
- S. Yenyaw, K. Kaito, E. H. Sekiya and P. Sujaridworakun, IOP Conf. Ser.: Mater. Sci. Eng., 2011, 18, 172005 Search PubMed.
- W. Zhang, K. Wang, S. Zhu, F. Wang and H. He, Chem. Eng. J., 2009, 155, 89 Search PubMed.
- J. Du, Q. Wu, S. Zhong, X. Gu, J. Liu, H. Guo and J. Zou, J. Rare Earths, 2015, 33, 148 CrossRef CAS.
- ISO 27448, Fine ceramics (advanced ceramics, advanced technical ceramics), Test method for self-cleaning performance of semiconducting photocatalytic materials – Measurement of water contact angle, 2009.
- D. Ollis, Catal. Today, 2018, 310, 49 CrossRef CAS.
- A. Manole, V. Dǎscǎleanu, M. Dobromir and D. Luca, Surf. Interface Anal., 2010, 42, 947 CrossRef CAS.
- S. Šegota, L. Ćurković, D. Ljubas, V. Svetličić, I. F. Houra and N. Tomašić, Ceram. Int., 2011, 37, 1153 CrossRef.
- M. T. C. Sansiviero and D. L. A. De Faria, Influência do tratamento térmico no nanocompósito fotocatalisador ZnO/TiO2, Quim. Nova, 2015, 38, 55–59, DOI:10.5935/0100-4042.20140267.
- P. Melnikov, V. A. Nascimento, L. Z. Z. Consolo and A. F. Silva, J. Therm. Anal. Calorim., 2013, 11, 115 CrossRef.
- X. Wang, J. Wang, X. Dong, F. Zhang, L. Ma, X. Fei, X. Zhang and H. Ma, J. Alloys Compd., 2016, 656, 181 CrossRef CAS.
- W. W. Wendlandt and J. L. Bear, J. Inorg. Nucl. Chem., 1960, 12, 276 CrossRef CAS.
- D. Y. Lee, J. Y. Park, B. Y. Kim and N. I. Cho, J. Nanosci. Nanotechnol., 2012, 12, 1599 CrossRef CAS PubMed.
- J. Reszczyńska, T. Grzyb, Z. Wei, M. Klein, E. Kowalska, B. Ohtani and A. Zaleska-Medynska, Appl. Catal., B, 2016, 181, 825 CrossRef.
- X. Mao, B. Yan, J. Wang and J. Shen, Vacuum, 2014, 102, 38 CrossRef CAS.
- J. Reszczy, T. Grzyb, J. W. Sobczak, W. Lisowski, M. Gazda, B. Ohtani and A. Zaleska, Appl. Catal., B, 2015, 163, 40 CrossRef.
- U. Černigoj, U. L. Štangara, P. Trebše, U. O. Krašovec and S. Gross, Thin Solid Films, 2006, 495, 327 CrossRef.
- K. Thirumalai and M. Shanti, RSC Adv., 2017, 7, 7509 RSC.
- F. Bensouici, M. Bououdin, A. A. Dakhel, R. Tala-Ighil, M. Tounane, A. Iratni, T. Souierd, S. Liu and W. Cai, Appl. Surf. Sci., 2017, 395, 110 CrossRef CAS.
- B. Barthi, S. Kumar and R. Kumar, Appl. Surf. Sci., 2016, 304, 51–60 Search PubMed.
- J. Rathouský, V. Kalousek, M. Kolár, J. Jirkovský and P. Barták, Catal. Today, 2011, 161, 202 CrossRef.
- A. Mills, A. Leppre, N. Elliott, S. Bhopal, I. P. Parkin and S. A. O'Neill, J. Photochem. Photobiol., A, 2003, 160, 213 CrossRef CAS.
- N. Sakai, R. Wang, A. Fujishima, T. Watanabe and K. Hashimoto, J. Phy. Chem. B, 2003, 107, 1028 CrossRef CAS.
- R. Salhi and J.-L. Deschanvres, J. Luminescence, 2016, 176, 250 CrossRef CAS.
Footnote |
| † Electronic supplementary information (ESI) available. See DOI: 10.1039/d0ra02242j |
| This journal is © The Royal Society of Chemistry 2020 |

