 Open Access Article
Mass conversion pathway during anaerobic digestion of wheat straw
Jian Gao a,
Juan Li
 b,
Akiber Chufo Wachemoac,
Hairong Yuana,
Xiaoyu Zuo
 *a and
Xiujin Li
 *a
*a
aDepartment of Environmental Science and Engineering, Beijing University of Chemical Technology, 15 Beisanhuan East Road, Chaoyang District, Beijing 100029, PR China. E-mail: zuoxy@mail.buct.edu.cn; xjli@mail.buct.edu.cn
bBeijing Municipal Ecological and Environmental Monitoring Center, 14 Chegongzhuang West Road, Haidian District, Beijing 100048, PR China
cDepartment of Water Supply and Environmental Engineering, Arba Minch University, P.O. Box 21, Arba Minch, Ethiopia
First published on 23rd July 2020
Abstract
A material flow analysis (MFA) method was employed to investigate elemental flow direction during the anaerobic digestion (AD) of wheat straw (WS) pretreated with potassium hydroxide. A lab-scale batch AD experiment conducted at 35 ± 1 °C was investigated to realize carbon conversion in biogas, liquid and solid digestates. The results showed that the highest growth rate of carbon conversion in biogas was observed from the fourth day to the twenty-fourth day, which accounted for 70.64%. The cumulative biogas production of WS was 531 mL g−1 VS, along with a high volatile solids degradation rate (55.0%). The MFA results indicated that the flow mass fractions of carbon in biogas, liquid and solid digestates were 49.96%, 5.61% and 44.43%, respectively. The flow mass fraction of nitrogen in liquid and solid digestates was 45.65% and 54.35%, respectively. This study can provide a theoretical basis for elemental flow in each product from biogas projects.
1. Introduction
According to the United Nations Food and Agriculture Organization, the world wheat and wheat straw (WS) productions in 2018 were nearly 3.4 and 4.5 billion tons, respectively.1 The WS is rich in organic carbon, which could be utilized as an important raw material for the production of clean energy, rather than being discarded as waste.2 Anaerobic digestion (AD) is a mature and environmentally friendly organic waste treatment technology that plays a vital role in the harmless reduction of industrial wastewater and agricultural solid waste treatment.3 AD technology can convert agricultural solid waste materials such as WS into biogas, which is a clean energy source used to generate electricity without secondary pollution.4 To some extent, it has alleviated environmental pollution caused by the use of fossil fuels.5The AD biochemical reactions of WS are the process of converting insoluble macromolecules into soluble small organic molecules, which in turn are converted to methane and carbon dioxide.6 Cellulose is hydrolyzed to glucose by extracellular enzymes, and cellobiose is an intermediate product. Hemicellulose is converted to galactose, mannose, arabinose, xylose and glucose by extracellular enzyme hydrolysis. These small molecular mass substances are firstly converted into volatile fatty acids by the action of fermenting bacteria, and then enter the acidification stage.7
Previous researchers have focused on the metabolism and transformation of determining the substances in the AD process. This is a matter of material conversion process by calculating the changes in the total solids (TS), volatile solids (VS) and lignocellulosic components before and after AD. For example, Liu et al. found that TS and VS bioconversion rates for the NaOH-pretreated group, respectively, with 1.0, 0.4, and 0.4 mg L−1 d of elements Fe, Co, and Ni group were 14–53% higher than the untreated group.8 Korai et al. found that the highest biogas production (570 mL g−1 VS) and hemicellulose reduction rate (9.6%) of WS was obtained by KOH and ultrasonic pretreatment.9
However, the flow distribution of materials and the mass conversion at the elemental level during the AD process of WS have not been clearly explained. The material flow analysis (MFA) is an overall method that allows the study of inflow and outflow of substances in a system.10 The main objective of MFA is to get the mass balance for the system, therefore, the sum of all system inputs and outputs must be equal.11 MFA can be used to estimate the generation of gas, liquid and solid materials from nine types of typical AD processes. For example, 30.8% of carbon in rice hull was converted into biogas during the anaerobic fermenting process, while 6.4% and 62.9% was left in liquid and solid digestate forms, respectively.12 Zhen et al. used the MFA method to analyze the flow direction of carbon and nitrogen elements in the AD process of hybrid wolf tail. They found that 33.1% and 8.0% of carbon in the raw material entered into biogas and liquid digestate forms, respectively, while 58.9% remained in the raw material. Regarding the distribution of nitrogen, 69.4% was converted into liquid digestate, and 30.7% remained in the raw material.13
In this study, MFA was used to analyze the process of using WS to produce biogas via mid-temperature batch AD. The flow distribution of materials, carbon and nitrogen were presented and discussed.
2. Methods and materials
2.1. Wheat straw and inoculum
The WS used in this study was obtained from the Daxing district of Beijing. It was naturally dried in open air and stored in a sheltered area between periods of use. To reduce its size and increase its surface area, the dried WS was shredded by a paper chopper (PC500, Staida Co., Tianjing, China) and then ground into the size of 20 meshes using a universal pulverizer (YSW-180, Yanshan Zhengde Co., Beijing, China). The raw WS had the original cellulose (43.52%), hemicellulose (24.87%), lignin content (10.21%), carbon (44.74%) and nitrogen percentage (0.52%) (Table 1).| Parameter | Value (%) | |
|---|---|---|
| Wheat straw | Inoculum | |
| a Values are means ± SD (n = 3); ND: not determined; MLSS: mixed liquid suspended solids. | ||
| Total solids (TS, %) | 96.63 ± 0.02 | 14.14 ± 0.04 |
| Volatile solids (VS, %) | 82.34 ± 0.03 | 7.34 ± 0.02 |
| MLSS (g L−1) | ND | 105.84 ± 1.28 |
| Total carbon (C, %) | 44.74 ± 0.03 | 29.83 ± 0.04 |
| Total nitrogen (N, %) | 0.52 ± 0.03 | 3.14 ± 0.02 |
| Total hydrogen (H, %) | 5.61 ± 0.01 | 3.62 ± 0.01 |
| Total sulphur (S, %) | 0.05 ± 0.02 | 0.70 ± 0.12 |
| VS/TS | 0.85 | 0.52 |
| Cellulose | 43.52 | — |
| Hemicellulose | 24.87 | — |
| Lignin | 10.21 | — |
| C/N | 86.04 ± 2.56 | 9.5 ± 0.01 |
The inoculum was collected from a biogas plant in Shunyi district of Beijing, which using pig manure and WS as the raw material. The biogas plant achieves continuously stable operation under mesophilic condition at 35 °C. The collected inoculum was initially concentrated by settling it for 48 h, then screened by a 1 mm sieve to prevent clogging problems and to remove impurities such as pig hair and twig before seeding in a reactor. The characteristics of WS and inoculum are listed in Table 1.
2.2. Pretreatment process
To enhance biodegradability and improve biogas production, potassium hydroxide (KOH) was used as a pretreatment reagent. Before being fed to reactors, the WS was pretreated for three days at an ambient temperature (25 ± 2 °C), based on a dry weight ratio of WS![[thin space (1/6-em)]](https://www.rsc.org/images/entities/char_2009.gif) :
:![[thin space (1/6-em)]](https://www.rsc.org/images/entities/char_2009.gif) KOH
KOH![[thin space (1/6-em)]](https://www.rsc.org/images/entities/char_2009.gif) :
:![[thin space (1/6-em)]](https://www.rsc.org/images/entities/char_2009.gif) H2O = 1
H2O = 1![[thin space (1/6-em)]](https://www.rsc.org/images/entities/char_2009.gif) :
:![[thin space (1/6-em)]](https://www.rsc.org/images/entities/char_2009.gif) 0.04
0.04![[thin space (1/6-em)]](https://www.rsc.org/images/entities/char_2009.gif) :
:![[thin space (1/6-em)]](https://www.rsc.org/images/entities/char_2009.gif) 6 (w/w/w).14
6 (w/w/w).14
2.3. Batch anaerobic digestion
Batch AD experiments were performed in 30 glass media bottles as the batch reactors, which were placed in mesophilic conditions (35 ± 1 °C). The total volume of each reactor was 1 L with a working volume of 0.8 L. An organic loading of 65 g TS per L pretreated WS was applied. The anaerobic inoculum seeded in each reactor was 20 g (mixed liquid suspended solid, MLSS) per L. The carbon-to-nitrogen ratio (C/N) and the pH value in each reactor were adjusted to the optimum level at the beginning of the anaerobic digestion process. The appropriate amount of urea was added to each bottle in order to adjust the C/N ratio to 25, which is believed to be optimal ratio for anaerobic bacterial growth and the pH value was adjusted to 7.0 ± 0.1 using calcium hydroxide solution.15The prepared reactors were carefully placed in a water bath incubated at mesophilic temperature (35 ± 1 °C) for 45 days to conduct the AD tests. Nitrogen gas was used to remove any oxygen residues from the bottles and all bottles were then capped and sealed to ensure the anaerobic conditions were produced.16
All experiments were performed in triplicate, with the mean values used for reporting. Moreover, a blank AD was carried out, in which only the seeding sludge was added to know the background methane production as well as the carbon and nitrogen conversion changes.
The liquid digestate samples were periodically collected from the digesters every three days during AD process. They are denoted as R3, R6, R9, R12, R15, R18, R21, R24, R27, R30, R33, R36, R39, R42 and R45. Therefore, destructive sampling was used, where the batch reactors were discarded after the samples were taken. Identical data analysis conducted for each sample: the TS, VS, total carbon (TC) and total nitrogen (TN) of every sample were measured.17 Lignin, cellulose, and hemicellulose contents were determined using an automatic fiber analyzer.18
2.4. Analytic methods and data analysis
![[thin space (1/6-em)]](https://www.rsc.org/images/entities/char_2009.gif) 000 rpm for 5 min, the supernatants were then filtered through a filter with 0.22 mm diameter pore size, and the filtrates were collected in sample vials for analyses. The VFAs yields were calculated as the sum of the measured acetic (HAc), propionic (HPr), n-butyric (n-HBu), iso-butyric (iso-HBu), n-valeric (n-HVa) and isovaleric (iso-HVa) acids. The content of each VFA was determined using gas chromatography (GC2014, Shimadzu, Japan) equipped with a flame ionization detector and a DB-WAX123-7032 capillary column. Nitrogen was used as the carrier gas. The operational temperatures of the injector and detector were maintained at 250 °C, while the temperature of column was increased from 100 to 180 °C at a rate of 5 °C min−1.
000 rpm for 5 min, the supernatants were then filtered through a filter with 0.22 mm diameter pore size, and the filtrates were collected in sample vials for analyses. The VFAs yields were calculated as the sum of the measured acetic (HAc), propionic (HPr), n-butyric (n-HBu), iso-butyric (iso-HBu), n-valeric (n-HVa) and isovaleric (iso-HVa) acids. The content of each VFA was determined using gas chromatography (GC2014, Shimadzu, Japan) equipped with a flame ionization detector and a DB-WAX123-7032 capillary column. Nitrogen was used as the carrier gas. The operational temperatures of the injector and detector were maintained at 250 °C, while the temperature of column was increased from 100 to 180 °C at a rate of 5 °C min−1.The MFA method used in this study was to estimate the generation of materials from gas, liquid and solid phases of AD processes. The conversion efficiency of carbon and nitrogen in the AD process of WS was studied by the methods of MFA. MFA analysis software (STAN 2.5) was applied to establish the MFA model, and the graphical rendering of MFA results were prepared using the E! Sankey 4.5 flow chart designer.
 | (1) |
Eqn (2) was used to calculate the carbon content of each component in the total VFA concentration, so as to obtain the carbon content in the liquid digestate in different stages of the AD system.
 | (2) |
3. Results and discussion
3.1. Biogas properties during the AD process
In this study, the effect of KOH pretreatment during biogas production from WS and the yields of biogas components such as methane and carbon dioxide contents were evaluated.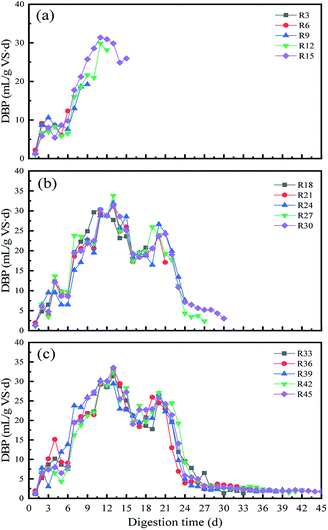 | ||
| Fig. 1 The trend of daily biogas production for AD system from R3 to R15 (a), R18 to R30 (b) and R33 to R45(c). | ||
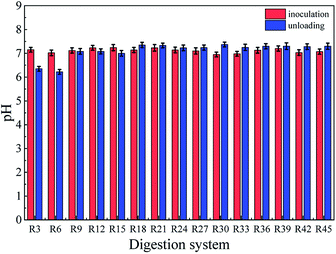
The pH of the system showed a slight increment with time-lapse which gradually increased the activities of methanogens that could have led to high methane production. This was due to the weakened acclimation of microorganisms caused by the digestion conditions in the reactors. The pH value of the second batch (R6) was in between 7 and 7.2 (Fig. 2), indicating that the 65 g TS per L organic loading could quickly cause a return to the optimum pH range for fermentation.22
Furthermore, from day 19 to 21 day, the DBP then rapidly increased to achieve the last biogas production peak. Finally, the biogas production of each reaction system was below 200 mL from the start of the 29th day, and gradually decreased to zero at by end of the digestion time.
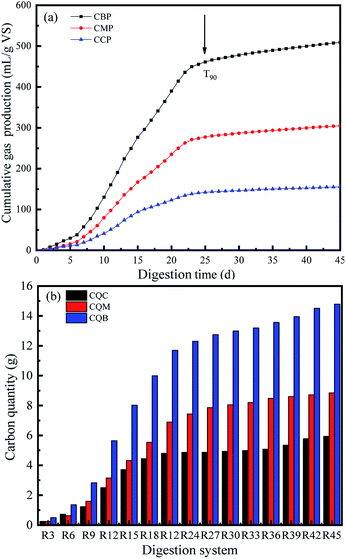 | ||
| Fig. 3 Cumulative biogas (CBP), methane (CMP) and CO2 (CCP) production (a) and cumulative carbon quantity of biogas (CQB), methane (CQM) and carbon dioxide (CQC) (b) of WS in batch experiments. | ||
The biodegradability and digestion efficiency of the substrate was also analyzed by measuring T90, where T90 is defined as the time required for achieving 90% of the total biogas production.21 The T90 in this study was achieved at 25 days (Fig. 2a). This shows that the biogas production during the AD period was mainly from the second and third peaks, which produced more methane in a relatively short period of time. Therefore, it could be confirmed that biogas production was mostly high in the second and third peaks of the methane production stage, i.e., between day 4 and day 25 of AD process.
3.2. Mass conversion during AD process
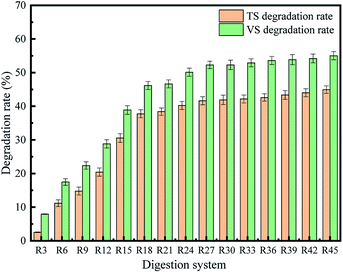
According to the change in the absolute mass of the substrate before and after AD, the whole TS and VS of WS can be calculated. Moreover, the degradation rate of TS and VS in AD stage are important indicators with which to evaluate the status of AD system.25 The TS and VS changes in the AD of WS in this study were shown in Fig. 4. During the 45 days of AD process, the final TS and VS degradation rates were 44.9% and 55.0%, respectively. From day 1 to day 24 day, that is, up to the end of the third biogas production peak, the TS and VS degradation rates gradually increased from 0% to 40.24% and 50.13%, respectively, accounting for 89.5% and 91.1% of the total degradation rates, respectively. This indicated that 90% of the biodegradable organic matter in the WS was degraded in the early and middle stages of AD. In the late stage of AD (i.e., the last 20 days), only 10% of the organic matter was degraded.
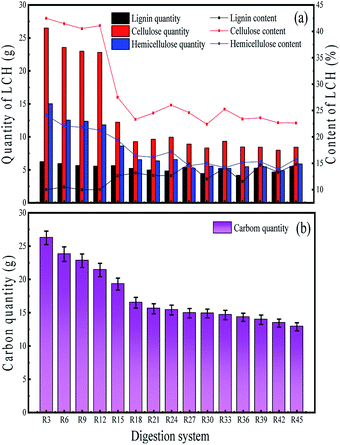
After 45 days of anaerobic fermentation, 64.72% of the cellulose and 62.11% of the hemicellulose in the WS were converted during the AD process compared with that found in the raw material. Conversely, the percentage of lignin did not show significant change after AD, indicating that a large amount of the organic matter remained in the solid digestate.26–28 This was consistent with the study by Weiland et al., in which 30–50% of the unused organic matter remained in the WS residue after AD.29
3.3. Carbon conversion pathway in AD
| Gas | a (Pa m6 mol−1) | b (105 m3 mol−1) |
|---|---|---|
| CH4 | 0.2283 | 4.278 |
| CO2 | 0.3640 | 4.267 |
Fig. 2b shows the variation tendency of biogas carbon in the anaerobic fermentation system at different sample removal stages. The carbon mass variation tendency from CO2 and CH4 were consistent and increasing with prolong of AD time. The growth rate of carbon mass from day 4 to 24 of AD period was highest in the digestion period, which accounted for 70.64%. As the digestion time prolonged to 45 day, the carbon quality from CQC, CQM and CQB reached the ultimate values of 4.4 g, 6.5 g and 11.0 g, respectively.
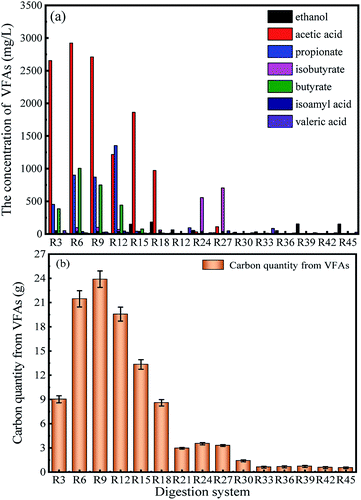 | ||
| Fig. 6 The effect of different digestion time on individual VFA (a) and carbon quantity from total VFAs (b) during AD process. | ||
In the anaerobic fermentation reactor, the process of biogas production occurs simultaneously with VFAs production.30 Therefore, the form of carbon in liquid digestate is VFAs. The mass of carbon produced from VFAs during AD process can be calculated using individual VFA concentration and eqn (1) as shown in Fig. 6b. This indicated that the carbon quantity from VFAs increased quickly during the first ninth days, when the highest value of 23.8 g was found. Then, the value of carbon quantity slowly decreased from day 9 to day 21. Finally, as digestion time prolonged to 45 day, the carbon quantity from VFAs obtained its lowest value of 0.5 g. This was because more VFAs was converted to CH4 which caused carbon to appear in the form of biogas. This was also consistent with that described in Section 3.1.2 and Fig. 3a.
As shown in Fig. 5b, the change in carbon content of the solid digestate in different periods during AD process was gradually reduced. The carbon quantity of the solid digestate before anaerobic fermentation was 26.6 g.
In the first 21 days of AD, the amount of carbon in the solid digestate decreased to 15.6 g, which indicated that carbon was converted into methane and carbon dioxide. The unused carbon in WS can be as much as 11.0 g. It is also obvious that a high proportion of carbon (41.4%) remained in the raw WS materials.
| Inoculum | Before AD | After AD | |
|---|---|---|---|
| CMP | — | 6 mL g−1 VS | |
| C | Biogas | — | 0.53 g |
| Liquid digestate | — | 0.11 g | |
| Solid digestate | 3.58 g | 2.94 g | |
| N | Biogas | — | — |
| Liquid digestate | — | 0.23 g | |
| Solid digestate | 0.38 g | 0.15 g | |
The CBP of inoculum was 6 mL g−1 VS after AD. Besides, before AD, the carbon quantity of inoculum (3.58 g) was far lower than that of WS (26.2 g). This was because the organic loading of inoculum was 20 g TS per L, which along with a relative low TS content. Moreover, the carbon quantity of inoculum remained in solid residue after AD was 2.94 g, which showed no obvious changes. The majority of N element in the inoculum after AD was recovered from the liquid digestate. The liquid digestate with high content of N element could be used as inoculum to adjust C/N rate of AD substrates. Therefore, the element in inoculum before and after AD showed little changes, which could not cause impact of the entire anaerobic system material flow directions.
3.4. Element flow analysis in AD
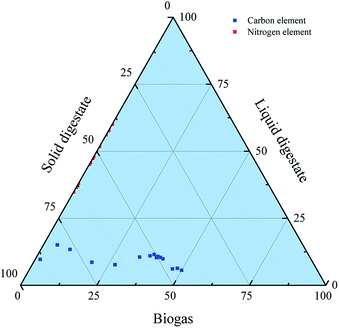
However, at the later 21 days, the proportion of carbon in the gas phase increased by only 10%, and the carbon element in the solid phase decreased for 6%. This is because in the later stage of AD, as the microbial activity decreased, the hydrolysis acidification and methanogenesis rates also gradually decreased, which resulted the distribution points in Fig. 8 more concentrated. Besides, the nitrogenous substance had not emerged in the biogas phase, but was focused on the liquid and the solid phases, since the red points are presented at the binary boundary line as shown in Fig. 8.
| Incoming material | Output material | ||||||
|---|---|---|---|---|---|---|---|
| Material | Element | Mass (g) | Content (%) | Material | Element | Mass (g) | Content (%) |
| Wheat straw | C | 25.71 | 86.86 | Biogas | C | 14.79 | 49.96 |
| N | 0.28 | 20.29 | N | — | — | ||
| Others | 29.46 | 3.46 | Others | 11.68 | 1.37 | ||
| Urea and water | C | 0.31 | 1.05 | Liquid digestate | C | 1.66 | 5.61 |
| N | 0.72 | 52.17 | N | 0.63 | 46.65 | ||
| Others | 815.09 | 95.60 | Others | 816.18 | 95.73 | ||
| Inoculum | C | 3.58 | 12.09 | Solid digestate | C | 13.15 | 44.43 |
| N | 0.38 | 27.54 | N | 0.75 | 54.35 | ||
| Others | 8.04 | 0.94 | Others | 23.45 | 2.75 | ||
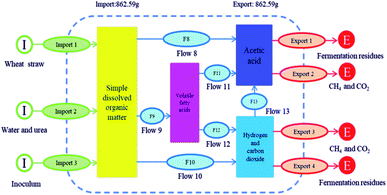
Fig. 9a represents the overall mass balance of the system before and after AD. The total quantities of carbon (29.6 g) and nitrogen (1.38 g) in the system before AD is equal to the carbon quality after AD. The remaining mass, which included the urea and water was 851.31 g, did not affect the balance of carbon and nitrogen.
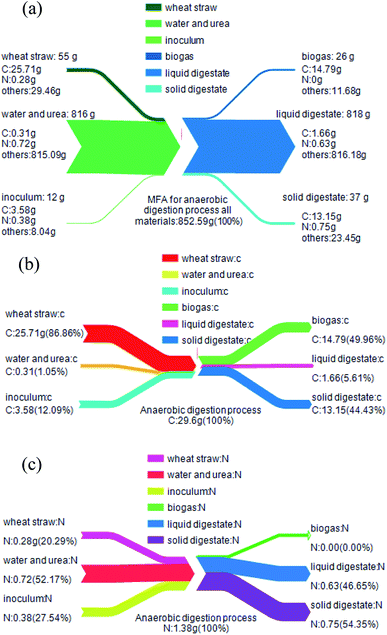 | ||
| Fig. 9 MFA results of all materials (a), carbon element (b) and nitrogen element (c) during AD process. | ||
According to Fig. 9b, before AD, the quantities of carbon that remained in WS, water + urea and inoculum were 25.71, 0.31 and 3.58 g, respectively. After AD, carbon quantity remained in biogas, liquid and solid digestates were 14.79, 1.66 and 13.15 g, respectively. This suggested that 49.96% of the carbon element in the AD process was converted to biogas. However, the remaining carbon that existed in the liquid and solid digestates accounted for 5.61% and 44.43%, respectively. In summary, during the process of biogas production from WS anaerobic fermentation, the utilization of carbon to methane was 50.04%.
Similarly, before AD, the quantities of nitrogen remained in WS, water + urea and inoculum were 0.28, 0.72 and 0.38 g, respectively. After AD, nitrogen remained in biogas, liquid and solid digestates were 0.00, 0.63 and 0.75 g, respectively (Fig. 9c). This indicated that the nitrogen element remaining in the biogas and the liquid digestate, accounting for 0% and 45.65%, respectively. At the same time, 54.35% of the nitrogen element was remained in the solid digestate.
These results demonstrated that half of organic matters mainly in WS was not fully utilized. In order to strengthen the use of organic matters, either enhance the productivity of biogas or increase the use of organic fertilizers.32 In other words, the rational development of fermentation residues for solid and liquid organic fertilizers may improve the material conversion efficiency of resources, and it also decrease environmental pollution.
4. Conclusions
During the AD process of KOH pretreated WS, carbon conversion is primarily derived from biogas, VFAs and LCH. The results showed that the highest carbon conversion rate in biogas was achieved at day 24, which accounted for 70.64% of carbon. Simultaneously, the carbon quantity from VFAs showed the highest and lowest values of 23.8 g and 0.5 g at day 9 and day 45, respectively. The material conversion efficiency of WS during anaerobic fermentation process was 49.97% and the methane conversion rate was 40.24%. The MFA results indicated that the flow mass fraction of carbon in biogas, solid and liquid digestates were 49.96%, 44.43% and 5.61%, respectively. Therefore, this study could provide a theoretical basis for elemental flow and contents of each product from the biogas production of WS.Conflicts of interest
There are no conflicts to declare.Acknowledgements
The authors greatly thank the reviewers for their review and constructive comments on this manuscript.References
- Food and Agriculture Organization of the United Nations, http://www.fao.org/home/en/, 2018.
- C. M. Liu, A. C. Wachemo, H. R. Yuan, D. X. Zou, Y. P. Liu and L. Zhang, Renewable Energy, 2018, 116, 224–233 CrossRef CAS.
- J. J. Xie, Y. L. Luo, C. X. Zheng, Y. U. Xiong, H. T. Jia and C. L. Wang, China Cattle Sci., 2010, 36, 36–40 Search PubMed.
- J. Li, A. C. Wachemo, H. Yuan, X. Zuo and X. Li, Bioresour. Technol., 2019, 288, 121518 CrossRef CAS PubMed.
- B. S. Padam, H. S. Tin, F. Y. Chye and M. I. Abdullah, J. Food Sci. Technol., 2014, 51, 3527–3545 CrossRef CAS PubMed.
- C. C. García, L. D. Mirquez and M. Hernandez, Environ. Technol. Innov., 2018, 10, 215–222 CrossRef.
- S. C. Huang, T. T. Liu, B. Y. Peng and A. L. Geng, Bioprocess Biosyst. Eng., 2019, 42, 883–896 CrossRef CAS PubMed.
- C. M. Liu, H. R. Yuan and D. X. Zou, BioMed Res. Int., 2015, 12, 1–9 Search PubMed.
- M. Korai, A. C. Wachemo, L. Yue, M. Jaffar and X. Li, RSC Adv., 2020, 10, 9290–9298 RSC.
- P. H. Brunner and H. Rechberger, Practical Handbook of Material Flow Analysis, Lewis Publishers, Boca Raton, FL, London, 2004 Search PubMed.
- A. Allesch and H. P. Brunner, Environ. Sci. Technol., 2017, 51, 540–551 CrossRef CAS PubMed.
- H. Z. Niu, X. Y. Kong and L. H. Li, CIESC J., 2015, 2, 723–729 Search PubMed.
- F. Zhen, Y. M. Sun and X. Y. Kong, Trans. Chin. Soc. Agric. Eng., 2017, 10, 236–241 Search PubMed.
- M. Jaffar, Y. Pang, H. Yuan, D. Zou, Y. Liu, B. Zhu, R. M. Korai and X. Li, Chin. J. Chem. Eng., 2016, 24, 404–409 CrossRef.
- R. Zhang and Z. Zhang, Bioresour. Technol., 1999, 68, 235–245 CrossRef CAS.
- Y. Wei, X. Li, L. Yu, D. Zou and H. Yuan, Bioresour. Technol., 2015, 198, 431–436 CrossRef CAS PubMed.
- P. J. Van Soest, J. B. Robertson and B. A. Lewis, J. Dairy Sci., 1991, 74, 3583–3597 CrossRef CAS PubMed.
- J. Li, A. C. Wachemo, G. Yu and X. Li, J. Cleaner Prod., 2019, 119112 Search PubMed.
- F. G. Ran, M. Z. Hauschild, E. Tomas, G. Jeroen, H. Reinout, H. Stefanie, K. Annette, P. David and S. Sangwon, J. Environ. Manage., 2010, 91, 1–21 Search PubMed.
- F. Pennini and A. Plastino, Phys. A, 2016, 458, 239–247 CrossRef.
- S. N. Misi and C. F. Forster, Bioresour. Technol., 2001, 80, 19–28 CrossRef CAS PubMed.
- H. Bouallagui, Y. Touhami, R. B. Cheikh and M. Hamdi, J. Cheminf., 2005, 36, 989–995 Search PubMed.
- H. R Yuan, R. P. Li and Y. T. Zhang, Biosyst. Eng., 2015, 129, 142–148 CrossRef.
- J. Li, A. C. Wachemo, H. Yuan, X. Zuo and X. Li, Waste Manage., 2019, 97, 52–62 CrossRef CAS PubMed.
- H. R. Yuan, Y. Y. Lan and J. L. Zhu, Chin. J. Chem. Eng., 2019, 27, 200–207 CrossRef CAS.
- I. Angelidaki and B. K. Ahring, Appl. Microbiol. Biotechnol., 1993, 38, 560–564 CrossRef CAS.
- Y. Wang, Y. Zhang, L. Meng, J. Wang and W. Zhang, Biomass Bioenergy, 2009, 33, 1131–1138 CrossRef CAS.
- S. K. Khanal, M. Rasmussen, P. Shrestha, H. J. Van Leeuwen, C. Visvanathan and H. Liu, Water Environ. Res., 2008, 80, 1625–1647 CrossRef CAS.
- P. Weiland, Appl. Microbiol. Biotechnol., 2010, 85, 849 CrossRef CAS PubMed.
- G. Wang, H. N. Gavala, I. V. Skiadas and B. K. Ahring, Waste Manage., 2009, 29, 2830–2835 CrossRef CAS PubMed.
- M. Berni, I. Dorileo, G. Nathia, T. Forster-Carneiro and B. G. M. Santos, Int. J. Chem. Eng., 2014, 1, 1–8 Search PubMed.
- T. Forster-Carneiro, M. D. Berni, D. Lachos-Perez, I. L. Dorileo and M. A. Rostagno, Int. J. Environ. Sci. Technol., 2017, 14, 2077–2092 CrossRef.
| This journal is © The Royal Society of Chemistry 2020 |

