 Open Access Article
Role of defects on TiO2/SiO2 composites for boosting photocatalytic water splitting
Wibawa Hendra Saputera *,
Jenny Rizkiana,
Winny Wulandari and
Dwiwahju Sasongko
Research Group on Energy and Chemical Engineering Processing System, Department of Chemical Engineering, Institut Teknologi Bandung, Bandung 40132, Indonesia. E-mail: hendra@che.itb.ac.id
First published on 23rd July 2020
Abstract
Defect engineering of semiconductor photocatalysts is considered as an evolving strategy to adjust their physiochemical properties and boost photoreactivity of the materials. Here, hydrogenation and UV light pre-treatment of TiO2/SiO2 composite with the ratio of 9![[thin space (1/6-em)]](https://www.rsc.org/images/entities/char_2009.gif) :
:![[thin space (1/6-em)]](https://www.rsc.org/images/entities/char_2009.gif) 1 (9TiO2/1SiO2) were conducted to generate Ti3+ and non-bridging oxygen holes center (NBOHC) defects, respectively. The 9TiO2/1SiO2 composite exhibited much higher photocatalytic water splitting than neat TiO2 and SiO2 as a consequence of the electronic structure effects induced by the defect sites. Electron paramagnetic resonance (EPR) indicated that hydrogenated and UV light pre-treated of 9TiO2/1SiO2 boosted a higher density of Ti3+ and NBOHC defect which could serve to suppress photogenerated electron–hole pair recombination and act as shallow donors to trap photoexcited electron. Overall, both defect sites in 9TiO2/1SiO2 delivered advantageous characteristic relative to neat TiO2 and SiO2 with the finding clearly illustrating the value of defect engineering in enhancing photocatalytic performance.
1 (9TiO2/1SiO2) were conducted to generate Ti3+ and non-bridging oxygen holes center (NBOHC) defects, respectively. The 9TiO2/1SiO2 composite exhibited much higher photocatalytic water splitting than neat TiO2 and SiO2 as a consequence of the electronic structure effects induced by the defect sites. Electron paramagnetic resonance (EPR) indicated that hydrogenated and UV light pre-treated of 9TiO2/1SiO2 boosted a higher density of Ti3+ and NBOHC defect which could serve to suppress photogenerated electron–hole pair recombination and act as shallow donors to trap photoexcited electron. Overall, both defect sites in 9TiO2/1SiO2 delivered advantageous characteristic relative to neat TiO2 and SiO2 with the finding clearly illustrating the value of defect engineering in enhancing photocatalytic performance.
Introduction
Photocatalytic water splitting into oxygen and hydrogen is possible, feasible, sustainable and a promising approach for solar energy storage and generating clean energy without any pollution.1–3 Photocatalytic overall water splitting can occur via either a stepwise two-electron pathway through hydrogen peroxide generation or a one-step four-electron pathway, wherein the four-electron process for O2 evolution is thermodynamically favorable compared to the two-electron process for H2O2 generation.1,4 Nevertheless, the kinetically two-electron process for H2O2 formation is someway easier to occur. Thus, it remains a task to control the electron pathway in order to improve the energy conversion and utilization.Several catalysts have been used for photocatalytic water splitting application, including g-C3N4,5–8 BiVO4,9–11 carbon nanotubes,12 Ag-based,13 TiO2,14–17 etc. Among various catalysts, the most commonly used metal oxide based catalyst, TiO2, has gained much attention due to their relatively high activity, abundant, non-toxic, and low-cost.18 However, this photocatalyst is still far away for large-scale applications because of their low photocatalytic efficiency due to rapid recombination of photo-generated electrons and holes, the unsuitable energy band position and values, and sluggish surface reaction kinetic.18,19 Thus, there is vital need to fabricate and design low-cost and more efficient photocatalysts.
Several strategies have been developed in order to enhance photocatalytic efficiency of TiO2 based photocatalyst including formation of heterojunction with another semiconductor20 and doping with foreign atoms.21 Besides, defect engineering of TiO2 photocatalyst is also one of the approaches commonly used to suppress electron–hole recombination by creating mid-gap states, and thus improving photocatalytic performance.22–24 It has been reported that hydrogen reduction treatment has been successfully used to generate Ti3+ associated with oxygen vacancy defects.25–27 On the other hand, SiO2 is also known to possess defect sites when subject to appropriate treatment conditions. Recently, it has been reported that UV light pre-treatment has been able to generate non-bridging oxygen holes center (NBOHC, ![[triple bond, length as m-dash]](https://www.rsc.org/images/entities/char_e002.gif) Si–O˙) and capable of dehydrogenating organic compounds.28,29 The question then arises to whether Ti3+ and NBOHC can be effectively generated in TiO2/SiO2 composites using a combined treatment strategy including thermal treatment coupled with light illumination and then harnessed to invoke synergism for photocatalytic water splitting.
Si–O˙) and capable of dehydrogenating organic compounds.28,29 The question then arises to whether Ti3+ and NBOHC can be effectively generated in TiO2/SiO2 composites using a combined treatment strategy including thermal treatment coupled with light illumination and then harnessed to invoke synergism for photocatalytic water splitting.
The ensuing work examines the prospect of hydrogenation and UV light pre-treatment with the intent to generate multiple defects on TiO2/SiO2 comprising Ti3+ and non-bridging oxygen holes center (NBOHC) and evaluate the capacity for photocatalytic water splitting. Knowledge gained from physiochemical properties coupled with X-ray photoelectron spectroscopy (XPS) and electron paramagnetic resonance (EPR) analysis were used to identify the role of defects on TiO2/SiO2 for enhancing photocatalytic water splitting.
Experimental
Materials
Titanium isopropoxide (TTIP, Sigma-Aldrich, ≥97%) tetraethylorthosilicate (TEOS, Sigma-Aldrich, ≥98.5%), ethanol (Sigma Aldrich, >96%), HCl (Sigma Aldrich, 37%), hydrogen (AGI, >99.99%), nitrogen (AGI, >99.99%), air (AGI, Dry Compressed Air).Methods
![[thin space (1/6-em)]](https://www.rsc.org/images/entities/char_2009.gif) :
:![[thin space (1/6-em)]](https://www.rsc.org/images/entities/char_2009.gif) 1 TiO2/SiO2 is chosen based on the reported work by Saputera et al.29 which showed that 9
1 TiO2/SiO2 is chosen based on the reported work by Saputera et al.29 which showed that 9![[thin space (1/6-em)]](https://www.rsc.org/images/entities/char_2009.gif) :
:![[thin space (1/6-em)]](https://www.rsc.org/images/entities/char_2009.gif) 1 ratio exhibited the best catalytic performance for catalytic oxidation of organic compound. Briefly, titanium(IV) isoproxide (TTIP) and tetraethylorthosilicate (TEOS) were used as starting materials. Ethanol was used as a solvent. Firstly, TTIP was dissolved in ethanol mixed TEOS, stirred 20 min at a room temperature and followed by the addition of 1 M HCl to the solution until pH = 3.5. Distilled water was finally added and the solution was then stirred for 20 min. The solution was dried at 105 °C for 12 h. Heat treatment consisted of calcination and hydrogenation was then performed in a tubular furnace. Calcination was performed at 300 °C under a flowing air stream with heating and flow rates of 5 °C min−1 and 50 mL min−1, respectively. The calcination conditions were maintained for 3 h. Hydrogenation was conducted at 500 °C under a 10 vol% H2/N2 flowing gas stream with heating and total flow rates of 5 °C min−1 and 50 mL min−1, respectively. The hydrogenation conditions were maintained for 3 h. UV light pre-treatment was conducted at spiral reactor for 30 minutes.30
1 ratio exhibited the best catalytic performance for catalytic oxidation of organic compound. Briefly, titanium(IV) isoproxide (TTIP) and tetraethylorthosilicate (TEOS) were used as starting materials. Ethanol was used as a solvent. Firstly, TTIP was dissolved in ethanol mixed TEOS, stirred 20 min at a room temperature and followed by the addition of 1 M HCl to the solution until pH = 3.5. Distilled water was finally added and the solution was then stirred for 20 min. The solution was dried at 105 °C for 12 h. Heat treatment consisted of calcination and hydrogenation was then performed in a tubular furnace. Calcination was performed at 300 °C under a flowing air stream with heating and flow rates of 5 °C min−1 and 50 mL min−1, respectively. The calcination conditions were maintained for 3 h. Hydrogenation was conducted at 500 °C under a 10 vol% H2/N2 flowing gas stream with heating and total flow rates of 5 °C min−1 and 50 mL min−1, respectively. The hydrogenation conditions were maintained for 3 h. UV light pre-treatment was conducted at spiral reactor for 30 minutes.30The existence of defects was evaluated using electron paramagnetic resonance (EPR) spectroscopy (Bruker Elexys 500 model). EPR measurements were conducted at 9.419 GHz (X-band). The microwave power, the modulation amplitude, and the temperature were set at 2 mW, 5 G, and 120 K, respectively. UV light pre-treatment was performed outside the EPR cavity using a light source of 20 W black light blue lamps with a maximum emission at 365 nm.
X-ray photoelectron spectroscopy analyses were performed using a VG ESCALAB MkII spectrometer. The radiation was provided by a monochromatic X-ray source (Al Kα, 1486.6 eV) operated at a 164 W emission power. Ti 2p, Si 2p, and O 1s core-level spectra were recorded, and the corresponding binding energies were referenced to the C 1s peak at 285 eV (from surface carbon). The core-level spectra were deconvoluted into their components with a mixed line shape of Lorentzian (20%) – Gaussian (80%), using the software package Thermo Avantage after subtraction of the Shirley-type background.
![[thin space (1/6-em)]](https://www.rsc.org/images/entities/char_2009.gif) :
:![[thin space (1/6-em)]](https://www.rsc.org/images/entities/char_2009.gif) 1 under ultra-sonication. The reaction was carried out in an enclosed top-irradiated Pyrex cell with a quartz window. Prior to light irradiation, argon gas purging was performed for 30 minutes to remove air from the reactor. The suspension was then irradiated by a 300 W xenon lamp (Toption, Top X-300) for 5 h under continuous stirring and a water jacket was placed on the top of the reactor. Hydrogen generation was analyzed and quantified every 30 minutes using a gas chromatograph equipped with a thermal conductivity detector (TCD) (Shimadzu, Argon as the carrier gas). The catalysts were collected by centrifuging and washed with water and ethanol to remove the impurities. The recovered catalysts were oven-dried at 70 °C overnight.
1 under ultra-sonication. The reaction was carried out in an enclosed top-irradiated Pyrex cell with a quartz window. Prior to light irradiation, argon gas purging was performed for 30 minutes to remove air from the reactor. The suspension was then irradiated by a 300 W xenon lamp (Toption, Top X-300) for 5 h under continuous stirring and a water jacket was placed on the top of the reactor. Hydrogen generation was analyzed and quantified every 30 minutes using a gas chromatograph equipped with a thermal conductivity detector (TCD) (Shimadzu, Argon as the carrier gas). The catalysts were collected by centrifuging and washed with water and ethanol to remove the impurities. The recovered catalysts were oven-dried at 70 °C overnight.Results and discussion
Physiochemical properties
Fig. 1 provide representative TEM images and particle sizes distribution of the hydrogenated and hydrogenated following UV-light pre-treated SiO2, TiO2, and 9TiO2–1SiO2 catalysts, labelled as Si-H, Ti-H, 9Ti-1Si-H, Si-H-UV, Ti-H-UV, and 9Ti-1Si-H-UV, respectively. The TEM images of Si-H and Si-H-UV show that the particles were found to be irregular in shape with a size distribution between 10-30 nm. For the Ti-H and Ti-H-UV samples, the particles appeared to become more rounded with a size distribution between 10–40 nm. In the case of 9Ti-1Si-H and 9Ti-1Si-H-UV depicts that highly crystalline spherical TiO2 nanoparticles interspersed with amorphous SiO2. EDX mapping (Fig. 2) confirmed that titanium and oxygen elements are uniformly distributed throughout the TiO2–SiO2 composites. It is also noted that there exists a homogeneous thin amorphous silica layer in between two spherical TiO2 particles favoring the interaction between TiO2 and SiO2.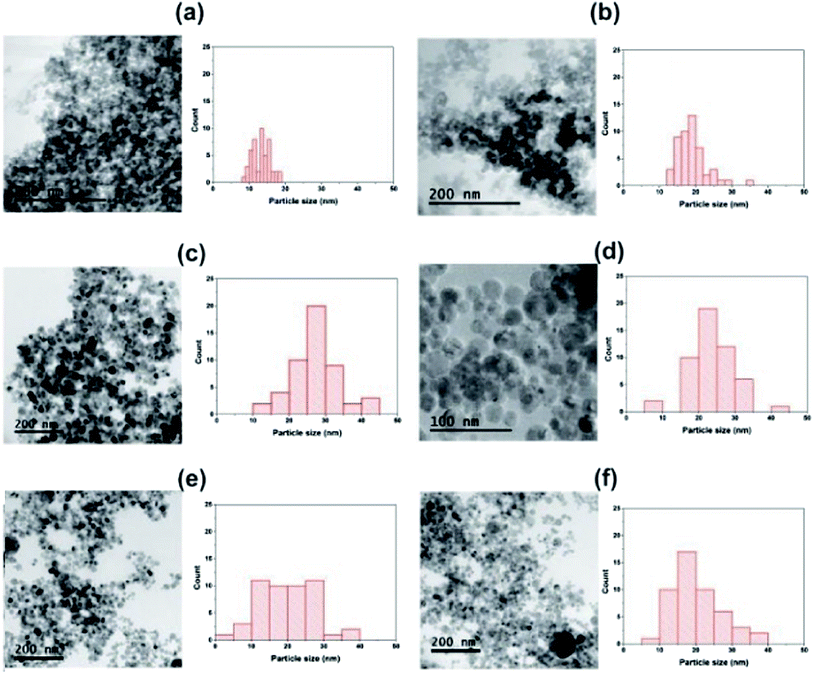 | ||
| Fig. 1 TEM images and particle size distributions of (a) Si-H (b) Si-H-UV (c) Ti-H (d) Ti-H-UV (e) 9Ti-1Si-H (f) 9Ti-1Si-H-UV. | ||
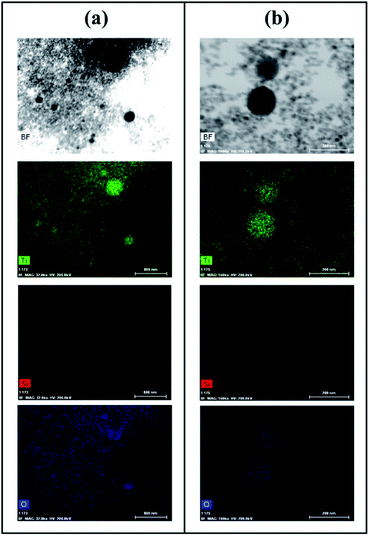 | ||
| Fig. 2 TEM image, energy dispersive X-ray (EDX) elemental mapping of Ti, Si, and O of (a) 9Ti-1Si-H (b) 9Ti-1Si-H-UV. | ||
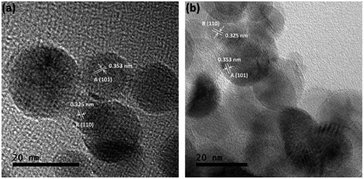
Fig. 2 also shows that the majority of the TiO2–SiO2 particles are also well-dispersed nanospheres within a lightly compacted aggregate and with a broad particle size distribution from 5 to 40 nm. Larger TiO2-dominant particles were present following UV light pre-treatment (Fig. 2b), with elemental Si being observed on/in those particles as well. High resolution TEM indicates that 9Ti-1Si-H (Fig. 3a) and 9Ti-1Si-H-UV (Fig. 3b) consists of highly crystalline spherical TiO2 interposed with amorphous SiO2. Lattice fringes with d-spacing of 0.353 and 0.325 nm are observed which can be attributed to anatase (101) and rutile (110) crystal phase.
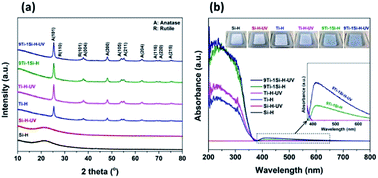
Fig. 4a shows the XRD patterns for the hydrogenated samples (Ti-H, Si-H, 9Ti-1Si-H) and are compared with the catalysts after hydrogenation following UV light pre-treatment (Ti-H-UV, Si-H-UV, and 9Ti-1Si-H-UV). The XRD pattern of hydrogenated TiO2 samples shows peaks at 25.4°, 37.7°, and 48.1° which are characteristic of the (101), (004), and (200) anatase phase crystal facets (JCPDS 84-1286), while peaks at 27.6°, 36.2°, and 41.5° corresponded to the (110), (101), and (111) rutile phase crystal facets (JCPDS 88-1175). The XRD pattern of the hydrogenated SiO2 was characterized by a broad peak at 21.5° corresponded to the characteristic of amorphous SiO2 phase. The diffraction peaks of TiO2 with a main component of anatase phase and a small fraction of rutile phase can be observed for 9TiO2–1SiO2 composites. The XRD patterns provide clear evidence that incorporation of Si atoms into the TiO2 lattice, suggesting Ti–O–Si bonding is existed. However, there are no significant differences of XRD patterns among all catalysts which were treated without and with UV light pre-treatment.
Fig. 4b provides the UV-vis spectra of the catalysts performed under ambient conditions. The spectra show changes in the light absorption properties of the catalysts, which can be investigated by the existence of a blue color in the 9TiO2–1SiO2 composites (Fig. 4b-inset). The parent SiO2 sample did not display absorption in the UV-vis range as expected given the properties of the insulator materials. The parent TiO2 sample exhibited an absorption band in the UV range with an onset at about 380 nm, which is a characteristic for a main component of anatase phase crystal structure. In the case of 9TiO2–1SiO2 composites, the absorption onset wavelength shifted towards the higher wavelength (blue region). In addition, absorption in the visible region over the 400–650 nm range was clearly observed for the 9Ti-1Si-H and 9Ti-1Si-H-UV samples whereby the intensity of absorption increased as the combination of hydrogenation and UV light pre-treatment were obtained. On the other hand, the broad visible light absorption was not apparent for the neat TiO2 and neat SiO2 sample. Visible light absorption of the blue colored TiO2–SiO2 composites is corresponded to the formation of Ti3+ associated with oxygen vacancy defects.31 Ti3+ species are known to generate mid-gap electronic states within the band gap of TiO2 and thus lowering the energy band gap of the TiO2 based catalysts.32
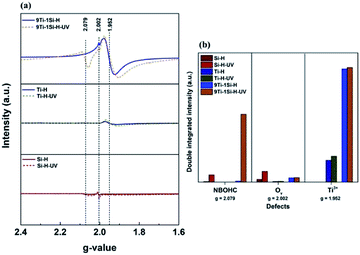
The existence of defect sites in the hydrogenated SiO2, TiO2 and 9TiO2–1SiO2 (Si-H, Ti-H, and 9Ti-1Si-H) and following UV-light pre-treatment (Si-H-UV, Ti-H-UV, and 9Ti-1Si-H-UV) were probed using EPR spectroscopy as shown in Fig. 5a. Based on the EPR results, peaks at g values of 1.952 in the EPR spectra corresponded to the paramagnetic Ti3+ centres.33,34 In addition, the peak at g-value of 2.079 suggests non-bridging oxygen hole centers (NBOHCs) are exist while the peak at g-value of 2.002 indicates oxygen vacancies (Ov) which may coexist with NBOHCs on the hydrogenated SiO2.28,35 A g-value signal at 1.952 was observed for neat TiO2 representing Ti3+ centres, although at much lower intensities compared with 9TiO2–1SiO2 as observed from the corresponding double integrated intensity of EPR spectra (Fig. 5b). In some instances, hydrogenated TiO2 has been reported to generate a weak signal at g value of 2.002, attributed to paramagnetic superoxide species adsorbed on the TiO2 surfaces which may impose on the oxygen vacancies or NBOHC signals. However, the EPR spectra of hydrogenated TiO2 give no evidence of a peak at g value 2.002 being present such that it will not interfere with the silica defect signals in the same g-value. The findings demonstrates that a small amount of SiO2 can assist in stabilizing the Ti3+ defect site, reflected in the binary 9TiO2–1SiO2 possessing an enduring blue color (Fig. 4b-inset).
The influence of UV light pre-treatment on defect site formation in the TiO2, SiO2 and 9TiO2–1SiO2 composites following hydrogenation treatment was also probed. The EPR spectra (Fig. 5a) and double integrated intensity (Fig. 5b) show that for 9TiO2–1SiO2 there is a distinct escalation of the peak at g-value of 2.079 after UV light pre-treatment, attributed to NBOHC defects. The intensity of the Ti3+ defect signal (g = 1.952) and oxygen vacancies (g = 2.002) slightly increased compared with the signal obtained without UV light pre-treatment. NBOHC can be generated by the breaking of strained Si–O–Si linkages or by the rupture of peroxy linkages through hydroxylation.36 NBOHC can be also generated upon irradiation by oxygen–hydrogen bond breakage from silanol functional groups.37 The double integrated intensity of the EPR spectra clearly demonstrates that a significant increase in NBOHC defects occurs for 9TiO2–1SiO2 composites after UV light pre-treatment, indicating there is an interaction between the TiO2 and SiO2 that promotes defect generation.
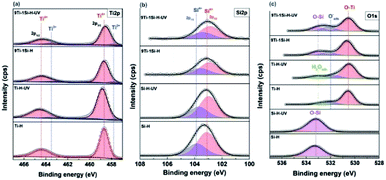
Fig. 6 shows the deconvoluted XPS spectra at Ti 2p, O 1s and Si 2p core levels. For the Ti 2p core level spectra (Fig. 6a), following UV light pre-treatment of hydrogenated samples, the Ti 2p peaks of 9TiO2–1SiO2 shift towards lower binding energy while no significant shift for neat TiO2. The negative shifts can be attributed to the existence of Ti–O–Si bonds.38 In addition, Ti3+ peaks are observed at binding energy of 457.7 eV (ref. 39) for 9Ti-1Si-H and 9Ti-1Si-H-UV which confirms the EPR results (Fig. 5a). The Si 2p spectra for the hydrogenated SiO2 and 9TiO2–1SiO2 (Fig. 6b) are dominated by a peak centred at a binding energy of 103.0–103.7 eV. This peak is characteristic of Si4+ in SiO2.28 Following UV light pre-treatment, a negative peak shift was observed, indicating a change in the chemical environment of the Si–O–Si bonds. In the case of the O 1s core level spectra (Fig. 6c), the binding energy for hydrogenated TiO2 and SiO2 are in good agreement with the literature relative to O–Ti and O–Si at 530.2 and 533.4 eV, respectively.40 In the case of the binary 9TiO2–1SiO2, the peak shifts towards a negative binding energy following UV light pre-treatment, indicating a higher electron density within the oxygen environment.41
Photocatalytic activity assessment
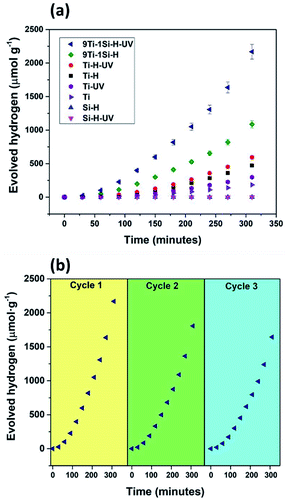
The photocatalytic performance of the hydrogenated TiO2, SiO2, and 9TiO2–1SiO2 prior to and following UV light pre-treatment was evaluated via hydrogen generation in an aqueous mix of water and methanol solutions. Fig. 7 provides the photoactivity profiles under UV-visible-light irradiation (full spectrum), whereby a substantial difference in evolved hydrogen can be observed. Si-H exhibited negligible activity irrespective of the presence of UV light pre-treatment as expected given by the insulating properties of the material. Marginal activity was displayed by Ti-H and UV light pre-treatment invoked a slight improvement. For 9Ti-1Si-H, the photocatalytic activity was enhanced by two-folds following UV light pre-treatment. The low activity of Si-H may be explained by the insulating properties of SiO2 materials. In contrast, the efficient charge trapping of defects comprising Ti3+, oxygen vacancies, and NBOHCs in 9Ti-1Si-H and 9Ti-1Si-H-UV (as illustrated by the EPR results, Fig. 5) which promotes an enhancement of photocatalytic activity of water splitting. The variation in performance indicates that the incorporation of small amount of SiO2 to TiO2 is advantageous for enhancing its photocatalytic water splitting activity via defect formation.The stability test of the most active catalyst, e.g. 9Ti-1Si-H-UV was conducted in three cycles (Fig. 6b). It can be seen that the photoactivity was decreasing gradually by approximately 17% and 24% at second and third cycles, respectively compared to the first cycle. The deactivation of the catalyst can be due to the oxidation of surface oxygen vacancies associated with Ti3+ defects42 and hydrogenation of NBOHC defect.34
A schematic depicting photocatalytic water splitting over 9Ti-1Si-U-V has been proposed (Fig. 8), derived from the experimental findings. Initially, as was highlighted by EPR (Fig. 5) and XPS (Fig. 6), Ti3+ species are formed when the Ti–O bond in a Ti–O–Si bridge is broken during the hydrogenation process. Crucially, this leaves a Ti3+ site and Si–OH terminal group positioned adjacent to each other. Ti3+ may also form by the direct reduction of Ti4+ by oxygen extraction or Ti–O–Ti bond breakage; however, given the lower activity of neat TiO2 compared with TiO2–SiO2 composites, this is anticipated to be a secondary process. Upon UV light pre-treatment, a NBOHC defect is generated by dehydroxylation of the Si–OH terminal group adjacent to the Ti3+ site. During photocatalytic water splitting process, photogenerated electron was trapped and accumulated by Ti3+ and combining with NBOHC defect, it was proposed that both defects were able to facilitate oxidation and reduction of water into oxygen and hydrogen, respectively. This proposed mechanism clearly highlights that catalyst treatments, including hydrogenation and UV light pre-treatment that create multiple defect sites in binary 9TiO2–1SiO2 composites, are crucial to the overall photocatalytic water splitting performance.
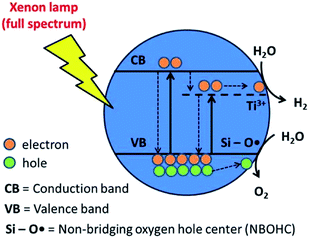 | ||
| Fig. 8 Schematic mechanism of photocatalytic water splitting on 9Ti-1Si-H-UV in the presence of Ti3+ and NBOHC defects. | ||
Conclusions
The presented findings have demonstrated that defect sites can be generated in TiO2/SiO2 to invoke a substantial enhancement in photocatalytic water splitting performance. Here, a sequential hydrogenation and UV light pre-treatment approach was employed to produce two distinct and adjacent defect sites in a TiO2/SiO2-based material. Hydrogenation generated Ti3+ sites while UV light pre-treatment introduced silica-based NBOHC sites. Both defect sites then united to facilitate water splitting reaction more efficiently. The study clearly demonstrates the supremacy of defect engineering and the potential it holds as a versatile approach to upgrade catalyst performance in the on-going research for low-cost, efficient and abundant catalysts for photocatalytic water splitting processes.Conflicts of interest
There are no conflicts to declare.Acknowledgements
This work was supported by ITB Excellence Research Grant through Research Center of New and Renewable Energy Development (PPEBT ITB) 2019 and ITB Multidisciplinary Research (Riset ITB Multidisiplin) 2020 (FTI-PN-6.02.2020).References
- J. Liu, Y. Liu, N. Liu, Y. Han, X. Zhang, H. Huang, Y. Lifshitz, S.-T. Lee, J. Zhong and Z. Kang, Science, 2015, 347, 970–974 CrossRef CAS PubMed
.
- H. Ahmad, S. K. Kamarudin, L. J. Minggu and M. Kassim, Renewable Sustainable Energy Rev., 2015, 43, 599–610 CrossRef CAS
.
- K. Maeda and K. Domen, J. Phys. Chem. Lett., 2010, 1, 2655–2661 CrossRef CAS
.
- S. Siahrostami, G.-L. Li, V. Viswanathan and J. K. Nørskov, J. Phys. Chem. Lett., 2017, 8, 1157–1160 CrossRef CAS PubMed
.
- C. Liu, Y. Feng, Z. Han, Y. Sun, X. Wang, Q. Zhang and Z. Zou, Chin. J. Catal., 2021, 42, 164–174 CrossRef CAS
.
- X. Chen, R. Shi, Q. Chen, Z. Zhang, W. Jiang, Y. Zhu and T. Zhang, Nano Energy, 2019, 59, 644–650 CrossRef CAS
.
- M. Shao, W. Chen, S. Ding, K. H. Lo, X. Zhong, L. Yao, W. F. Ip, B. Xu, X. Wang and H. Pan, ChemSusChem, 2019, 12, 3355–3362 CrossRef CAS PubMed
.
- G. Liao, Y. Gong, L. Zhang, H. Gao, G.-J. Yang and B. Fang, Energy Environ. Sci., 2019, 12, 2080–2147 RSC
.
- A. Xu, W. Tu, S. Shen, Z. Lin, N. Gao and W. Zhong, Appl. Surf. Sci., 2020, 528, 146949 CrossRef CAS
.
- C. Martinez Suarez, S. Hernández and N. Russo, Appl. Catal., A, 2015, 504, 158–170 CrossRef CAS
.
- S.-H. Chen, Y.-S. Jiang and H.-y. Lin, ACS Omega, 2020, 5, 8927–8933 CrossRef CAS PubMed
.
- W. Zhong, W. Tu, Z. Wang, Z. Lin, A. Xu, X. Ye, D. Chen and B. Xiao, J. Energy Chem., 2020, 51, 280–284 CrossRef
.
- G. Liao, J. Fang, Q. Li, S. Li, Z. Xu and B. Fang, Nanoscale, 2019, 11, 7062–7096 RSC
.
- C. Liu, Q. Zhang, W. Hou and Z. Zou, Sol. RRL, 2020, 2000070 CrossRef
.
- J. Tang, J. R. Durrant and D. R. Klug, J. Am. Chem. Soc., 2008, 130, 13885–13891 CrossRef CAS PubMed
.
- A. Yamakata, T.-a. Ishibashi and H. Onishi, J. Mol. Catal. A: Chem., 2003, 199, 85–94 CrossRef CAS
.
- K. Reilly, B. Fang, F. Taghipour and D. P. Wilkinson, J. Catal., 2017, 353, 63–73 CrossRef CAS
.
- M. Ni, M. K. H. Leung, D. Y. C. Leung and K. Sumathy, Renewable Sustainable Energy Rev., 2007, 11, 401–425 CrossRef CAS
.
- A. Miyoshi, S. Nishioka and K. Maeda, Chem. - Eur. J., 2018, 24, 18204–18219 CrossRef CAS PubMed
.
- K. Afroz, M. Moniruddin, N. Bakranov, S. Kudaibergenov and N. Nuraje, J. Mater. Chem. A, 2018, 6, 21696–21718 RSC
.
- Z. Wang, C. Li and K. Domen, Chem. Soc. Rev., 2019, 48, 2109–2125 RSC
.
- Y.-C. Zhang, N. Afzal, L. Pan, X. Zhang and J.-J. Zou, Adv. Sci., 2019, 6, 1900053 CrossRef PubMed
.
- T. Takata and K. Domen, J. Phys. Chem. C, 2009, 113, 19386–19388 CrossRef CAS
.
- M. S. Hamdy, W. H. Saputera, E. J. Groenen and G. Mul, J. Catal., 2014, 310, 75–83 CrossRef CAS
.
- Z. Zheng, B. Huang, J. Lu, Z. Wang, X. Qin, X. Zhang, Y. Dai and M.-H. Whangbo, Chem. Commun., 2012, 48, 5733–5735 RSC
.
- Y. H. Hu, Angew. Chem., Int. Ed., 2012, 51, 12410–12412 CrossRef CAS PubMed
.
- W. H. Saputera, G. Mul and M. S. Hamdy, Catal. Today, 2015, 246, 60–66 CrossRef CAS
.
- W. H. Saputera, H. A. Tahini, E. C. Lovell, T. H. Tan, A. Rawal, K.-F. Aguey-Zinsou, D. Friedmann, S. C. Smith, R. Amal and J. Scott, J. Catal., 2019, 376, 168–179 CrossRef CAS
.
- W. H. Saputera, H. A. Tahini, M. Sabsabi, T. H. Tan, N. M. Bedford, E. Lovell, Y. Cui, J. N. Hart, D. Friedmann, S. C. Smith, R. Amal and J. Scott, ACS Catal., 2019, 9, 2674–2684 CrossRef CAS
.
- W. H. Saputera, J. Scott, H. Tahini, G. K. C. Low, X. Tan, S. Smith, D.-W. Wang and R. Amal, ACS Catal., 2017, 7, 3644–3653 CrossRef CAS
.
- G. Zhu, Y. Shan, T. Lin, W. Zhao, J. Xu, Z. Tian, H. Zhang, C. Zheng and F. Huang, Nanoscale, 2016, 8, 4705–4712 RSC
.
- G. Yin, X. Huang, T. Chen, W. Zhao, Q. Bi, J. Xu, Y. Han and F. Huang, ACS Catal., 2018, 8, 1009–1017 CrossRef CAS
.
- R. F. Howe and M. Gratzel, J. Phys. Chem., 1985, 89, 4495–4499 CrossRef CAS
.
- W. H. Saputera, H. A. Tahini, M. Sabsabi, T. H. Tan, N. M. Bedford, E. Lovell, Y. Cui, J. N. Hart, D. Friedmann, S. C. Smith, R. Amal and J. Scott, ACS Catal., 2019, 2674–2684, DOI:10.1021/acscatal.8b04891
.
- M. Stapelbroek, D. L. Griscom, E. J. Friebele and G. H. Sigel, J. Non-Cryst. Solids, 1979, 32, 313–326 CrossRef CAS
.
- H. Nishikawa, R. Nakamura, R. Tohmon, Y. Ohki, Y. Sakurai, K. Nagasawa and Y. Hama, Phys. Rev. B, 1990, 41, 7828–7834 CrossRef CAS PubMed
.
- L. Skuja, J. Non-Cryst. Solids, 1998, 239, 16–48 CrossRef CAS
.
- R. P. Netterfield, P. J. Martin, C. G. Pacey, W. G. Sainty, D. R. McKenzie and G. Auchterlonie, J. Appl. Phys., 1989, 66, 1805–1809 CrossRef CAS
.
- L.-B. Xiong, J.-L. Li, B. Yang and Y. Yu, J. Nanomater., 2012, 2012, 13 Search PubMed
.
- G. M. Ingo, S. Dirè and F. Babonneau, Appl. Surf. Sci., 1993, 70–71, 230–234 CrossRef CAS
.
- W. H. Saputera, J. A. Scott, D. Friedmann and R. Amal, Appl. Catal., B, 2018, 223, 216–227 CrossRef CAS
.
- S. Mohajernia, P. Andryskova, G. Zoppellaro, S. Hejazi, S. Kment, R. Zboril, J. Schmidt and P. Schmuki, J. Mater. Chem. A, 2020, 8, 1432–1442 RSC
.
| This journal is © The Royal Society of Chemistry 2020 |

