DOI:
10.1039/D0RA02471F
(Paper)
RSC Adv., 2020,
10, 16669-16674
Effect of surface morphology on methane interaction with calcite: a DFT study†
Received
17th March 2020
, Accepted 16th April 2020
First published on 28th April 2020
Abstract
Natural gas, consisting primarily of methane, is found in carbonate reservoirs of which calcite is major component. However, the complexity and heterogeneity of carbonate reservoirs remain a major challenge in estimating ultimate recovery. Herein, density functional theory calculations are employed to study the effect of surface morphology on the adsorption of CH4 on the surface of CaCO3 (calcite). Among the 9 different surface symmetries considered, the strongest adsorption (and consequently the largest adsorption capacity) of methane is found for the 110 surface of the material. In fact, the adsorption capacity of this surface is more than an order of magnitude larger than the one for the 104 surface, which is the lowest energy surface for the calcite. The obtained results are explained by structural analysis and charge calculations. These findings can be useful for the estimation of the ultimate gas recovery taking into account heterogeneous porosity and permeability of the carbonate reservoirs.
1 Introduction
Methane (CH4), which is the main component of the natural gas, is considered to be a cleaner source of energy compared to coal and petroleum. Recent research activities in the field are directed towards enhanced gas recovery (EGR)1 and also estimated ultimate recovery (EUR)2 in different gas reservoirs. Particular interest is given to carbonate reservoirs as they are valued to contain about 50% of the global hydrocarbon resources in the Middle East.3,4 However, carbonate reservoirs need circumspection as it can be challenging to predict the quality of the natural gas, and guarantee high recovery from this rock type. The major difficulties are the complex and heterogeneous nature of carbonate reservoirs.5,6
Atomistic scale modelling often provide a fundamental insight into the nature of gas adsorption (e.g., chemisorption or physisorption) on the surface of different reservoir materials. The outcome of such studies is used as an input for pore-scale modelling, which requires an extensive knowledge of the surface morphology on the adsorption of different types of gas molecules on these surfaces. Pore studies are fundamental for EUR, which is an essential part for securing the energy cores in the near future.7
Molecular simulations have proved to be a useful tool in complementing experimental results by providing insights which may be difficult to deduce experimentally e.g., enhanced gas recovery applications.7–9 Density functional theory (DFT) has been applied in studying the calcite surfaces10–17 with a main focus on the lowest energy surface symmetries. First-principles calculations are also used to study the adsorption of methane on different surfaces. However, to the best of our knowledge there is no detailed work that describes methane adsorption on different calcite surfaces. Most articles in the literature focused only on the most stable 104 surface.18–25 In this work, DFT calculations are employed to study the effect surface morphologies on the adsorption properties of methane on calcite. 9 different surfaces are considered including the lowest energy 104 surface. The strongest adsorption is obtained for the 110 surface. The estimated adsorption capacity if this surface is found to be more than an order of magnitude larger than the 104 surface. Geometrical surface and charge analysis are studied to give insight into the nature of adsorption. These findings can be useful for pore modelling of carbonate rocks.
2. Computational details
All calculations are conducted using VASP (5.4.4.) code26 employing periodic boundary conditions. The revised generalized gradient approximation of Perdew, Burke, and Ernzerhof (PBE-GGA) which gives better equilibrium structural parameters than the Local Density Approximation (LDA)27,28 was used for exchange-correlation energy for all elements. For the description of the ion–electron interactions, the Projected Augmented Wave (PAW) pseudopotentials were employed.29,30 Due to the importance of dispersion forces in describing surfaces and interfaces, the semi-empirical correction by Grimme (DFT+D3) was included.31,32 A 3 × 3 × 1 k-point sampling is used for all considered structures and the plane wave cut-off energy was 282.84 eV.
Calcite has a hexagonal crystal structure with a R![[3 with combining macron]](https://www.rsc.org/images/entities/char_0033_0304.gif) c space group. The experimental bulk geometry was downloaded from the database in materials studio33 with lattice parameters of a = b = 4.99 Å and c = 17.061 Å.9,34 The isolated adsorbate molecule (CH4) was modeled using the gamma k-point sampling in a periodic box of 10 × 10 × 10 Å3 to avoid the interactions with the periodic images. A vacuum region was extended to 10 Å in the z direction and applied on all surfaces to avoid interaction with the neighboring cells. Nine surface morphologies were studied (Table 1) and these surfaces were selected from the literature.10,35 However, the studied surfaces account for most of the component of calcite. The first two layers on all the studied surfaces were allowed to relax while the rest was fixed to replicate the bulk nature. The number of layers for all the surfaces was not equally the same, as different supercell was used for each surface depending on its termination. For the adsorption calculations, the CH4 molecule was placed within this vacuum region. The Quantum ATK virtual Nano lab was used for building the models and visualization of results.36,37
c space group. The experimental bulk geometry was downloaded from the database in materials studio33 with lattice parameters of a = b = 4.99 Å and c = 17.061 Å.9,34 The isolated adsorbate molecule (CH4) was modeled using the gamma k-point sampling in a periodic box of 10 × 10 × 10 Å3 to avoid the interactions with the periodic images. A vacuum region was extended to 10 Å in the z direction and applied on all surfaces to avoid interaction with the neighboring cells. Nine surface morphologies were studied (Table 1) and these surfaces were selected from the literature.10,35 However, the studied surfaces account for most of the component of calcite. The first two layers on all the studied surfaces were allowed to relax while the rest was fixed to replicate the bulk nature. The number of layers for all the surfaces was not equally the same, as different supercell was used for each surface depending on its termination. For the adsorption calculations, the CH4 molecule was placed within this vacuum region. The Quantum ATK virtual Nano lab was used for building the models and visualization of results.36,37
Table 1 Symmetry and lattice parameters of the considered calcite surfaces
| Surface |
Lattice parameters (Å) |
# of layers |
# of atoms |
Type |
| 104 |
a = 16.19; b = 9.98; c = 20.05 |
3 |
120 |
Pure |
| 100 |
a = 27.64; b = 9.94; c = 20.34 |
6 |
200 |
Pure |
| 110 |
a = 8.10, b = 12.14; c = 20.05 |
4 |
80 |
Pure |
| 001-Ca terminated |
a = b = 9.98; c = 25.64 |
6 |
120 |
Pure |
| 001-CO3 terminated |
a = b = 9.98; c = 25.64 |
6 |
116 |
Pure |
| 101-Ca terminated |
a = 12.75; b = 9.184; c = 22.68 |
6 |
120 |
Pure |
| 101-CO3 terminated |
a = 12.75; b = 9.184; c = 22.68 |
6 |
116 |
Pure |
| 103 |
a = 21.57; b = 9.913; c = 20.42 |
3 |
160 |
Stepped |
| 105 |
a = 9.98; b = 17.06; c = 25.25 |
3 |
208 |
Stepped |
3. Results and discussion
3.1 Surface energies
Nine calcite surfaces were studied (see Fig. 1), their lattice parameters and surface symmetries are shown in Table 1. Both the 001 and the 101 surfaces have two facets each, as they could be terminated in two different ways (i.e., calcium terminated or carbonate terminated). Surface energies of the considered systems are calculated using:38–41| |
 | (1) |
where Eslab the total energy of each is relaxed surface slab, Ebulk is the total energy of the bulk unit cell of calcite, Nslab is the number of the CaCO3 unit in each surface slab, and Aslab is the surface area. The calculated surface energies are shown in Fig. 2. The calcium terminated 001 surface (001-Ca) has the highest surface energy (1.84 J m−2), whereas, the 104 surface has the lowest energy (0.57 J m−2). This value was in agreement with De Leeuw et al.'s work10 which had the 104 surface energy as 0.59 J m−2. The 103 and 105 stepped surfaces are derivatives of the 104 surface. The 103 surface is an offset of one atomic layer down the 104 surface in the 101 cleavage plane while the 105 surface is an atomic layer down which is cleaved at the 0001 plane.13 This is reflected in their surface energies as they are the second and third most stable surfaces (Fig. 2).
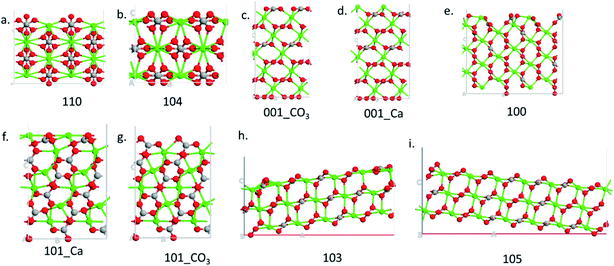 |
| | Fig. 1 Side view of the different surfaces. | |
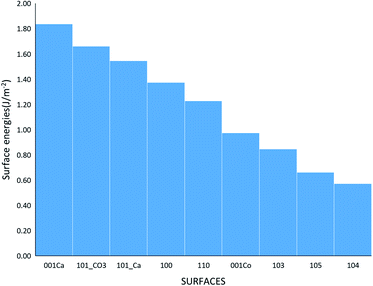 |
| | Fig. 2 The surface energies of the different calcite surfaces. | |
3.2 Adsorption energies
For the adsorption study, various adsorption sites were considered. Specifically, the methane molecule was localized on top of Ca, C and O atoms (Table S2†). In the case of stepped surfaces one set of adsorption studies is carried out on all the elements at the top step (upper) and another at the bottom step (lower). This was done to observe if there is any significant difference in the adsorption property since the 103 and 105 surfaces are not in one plane unlike the pure surfaces (Table S2†). The adsorption energies are calculated using the following equation:| | |
Eads = Esurface+CH4 − Esurface − ECH4
| (2) |
where, Esurface is the total energy of the slab, ECH4 is the total energy of the isolated gas molecule and Esurface+CH4 is the total energy of the slab with the gas molecule. In this formula, a stronger adsorption correlated with a more negative value of Eads.42 The calculated total energies and resulting adsorption energies for different adsorption sites are given in Table S2† for all the considered surfaces. Fig. 3 shows the lowest adsorption energy values (dots, right axis) for all the systems together with the surface energy values (columns, left axis). The strongest adsorption is obtained for the 110 surface (Eads = −1.91 eV), whereas the 101_CO3 surface has the weakest adsorption (Eads = −0.061 eV). The lowest energy surface (104) resulted in the second weakest adsorption among the studied morphologies. The value of the adsorption for this surface (Eads = −0.085 eV) is in good agreement with the energy reported in an earlier work.9 The adsorption energies for the other surfaces are in the range of −0.09 eV to −0.55 eV. It is important to note that the higher the surface energy, the higher the adsorption energy. However, some exceptions occur such as the 001-Ca, and 101_Ca which are both characterized by high surface energy and low adsorption energy. This may be due to the fact that both surfaces are not well terminated, and so the exposed Ca atoms could affect the adsorption. This applies also to the 101_CO3, surface but due to the carbonate instead.
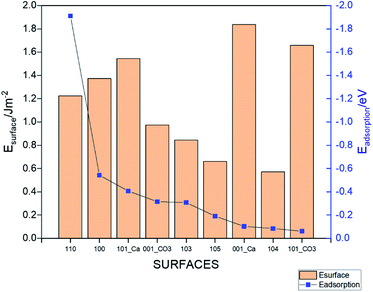 |
| | Fig. 3 The adsorption energies (dots, right axis) and surface energies (columns, left axis) of the different calcite surfaces. | |
In what follows, we mainly concentrate on the adsorption properties of 110 surface which provides the strongest adsorption for methane. Analysis are also conducted for the 104 surface as a reference. The adsorption capacity of these two surfaces, which is the amount of the adsorbate (i.e., methane) per unit area43 is calculated using:
| |
 | (3) |
where,
n and
A implies the number of molecules adsorbed and the area of the calcite surface respectively. The calculated adsorption capacities of both the 110 and 104 surfaces are shown in
Fig. 3. The 104 surface stopped adsorbing starting from 4
th methane molecules (
i.e., positive adsorption energy is obtained), whereas 110 surface can adsorb up to 24 methane molecules.
Fig. 4a shows the optimized geometry of the 110 surface with 24 methane molecules adsorbed. Thus, the 110 surface had an adsorption capacity that was about one order of magnitude larger than the most stable 104 surface.
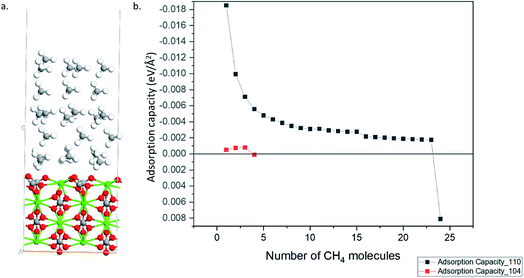 |
| | Fig. 4 (a) Optimized structure calcite 110 surface with 24 CH4 molecules (Ca–Green; O–Red; C–Grey; H–White). (b) Adsorption capacity of 110 and 104 surfaces. | |
3.3 Structural and charge analysis
To find the reasons for the large adsorption property of the 110 surface, structural and charge analysis were carried out. The structures analysis shows that the 104 surface remains unaltered during the adsorption processes (i.e., no structural changes are obtained after methane adsorption) (Fig. 5d and e). However, significant changes are obtained in the case of 110 surface after the gas adsorption (Fig. 5b and e). The oxygen from the carbonate, which is located vertically on the 110 surface (Fig. 5a), rotates by about 90° after the gas molecule adsorption (Fig. 5b and the ESI Video†). The bond distance between the center of mass of the methane molecule (carbon atom) and the calcium atom in the two surfaces show that the 110 surface has a shorter bond distance (d = 3.20 Å, Fig. 5b) as compared to the case of 104 surface (d = 3.88 Å, Fig. 5e). This corroborates the stronger adsorption of the gas molecule on 110 surface of calcite.
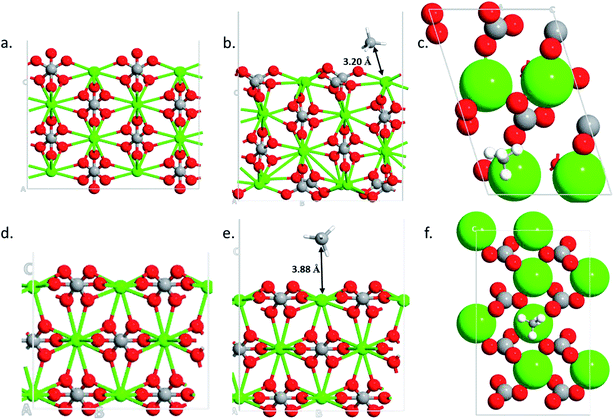 |
| | Fig. 5 Optimized structures of 110 clean surface (a), CH4 adsorption side- (b) and top-view (c) and optimized structures of 104 clean surface (d), CH4 adsorption side- (e) and top-view (f). | |
To further understand the obtained peculiarities in the adsorption properties of methane on the surface of calcite, partial charge calculations are conducted for both 104 and 110 surface. The density derived electrostatic and chemical (DDEC) charge method,44,45 which is known to be the most accurate charge partitioning method for complex systems,46 was employed. The calculated total charge of CH4 molecule on top of 104 surface is q = 0.01|e|, which confirmed weak interaction of the molecule with that surface, whereas, in the case of 110 surface, the total charge of the molecule becomes q = 0.023|e|. Such larger charge transfer further explains the obtained larger adsorption energy observed in the 110 surface. To better visualize the charge transfer between the molecule and the substrate, we plotted in Fig. 6 the electron difference density calculated as the difference between the self-consistent valence charge density and the superposition of atomic valence densities. Stronger charge exchange between the methane molecule and 110 surface of the calcite (Fig. 6b) is clearly visible as compared to the case of 104 surface (Fig. 6a).
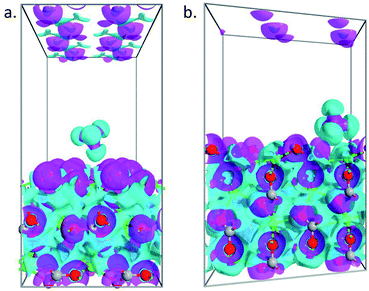 |
| | Fig. 6 Electron difference density plots for the adsorption of methane on 104 (a) and 110 (b) surface of calcite. The isosurfaces are taken as ±0.05 e Å−3. | |
3.4 Size effect on adsorption
Finally, we study the effect of calcite thickness in the model systems on the adsorption of methane. Fig. 7 shows the optimized structures for 104 and 110 surfaces for 4 and 5 layers, respectively. As in the case of smaller layers (see Fig. 5) the distance from the substrate to the molecule is smaller in the case of 110 surface, indicating to stronger interaction of the molecule with this surface. Indeed, 110 surface gives smaller adsorption energy (−1.919 eV, see Table 2) as compared to 104 surface (−0.089 eV, see Table 2). Thus, no qualitative changes are obtained about the effect of surface symmetry on the adsorption properties of the material for larger simulation cell with 110 surface having larger adsorption energy that 104 surface. The increase in the slab thickness increases the adsorption energies slightly for both cases. We would like to not that have 4 to 5 layers of the materials for the simulations is enough for calculating the adsorption of small molecules on calcite.47
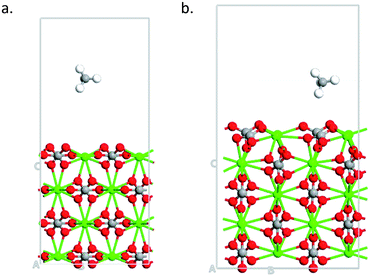 |
| | Fig. 7 Optimized structures of methane adsorbed on (a) 4-layers of 104 surface (b) 5-layers of 110 surface. | |
Table 2 Symmetry and lattice parameters of 104 and 110 surfaces
| Surface |
Lattice parameters (Å) |
# of layers |
# of atoms |
Adsorption energy (eV) |
| 104 |
a = 16.19; b = 9.98; c = 20.05 |
3 |
120 |
−0.085 |
| 104 |
a = 16.19; b = 9.98; c = 22.71 |
4 |
165 |
−0.089 |
| 110 |
a = 8.10, b = 12.14; c = 20.05 |
4 |
80 |
−1.910 |
| 110 |
a = 8.10, b = 12.14; c = 22.61 |
5 |
105 |
−1.919 |
4. Conclusions
Using DFT calculations we study the effect of surface morphologies on the adsorption properties of methane on CaCO3. We found that Ca rich 001 surface has the highest surface energy, whereas 104 is the lowest energy surface. Interestingly, the 110 surface shows the highest adsorption capacity which is more than an order of magnitude larger than the one obtained for the lowest energy 104 surface. Structural analysis and partial charge calculations show that such larger adsorption originates from the larger charge transfer between the molecule and the substrate and structural changes on the surface during the adsorption process. These findings will be useful for fundamental understanding of the gas adsorption on calcite surfaces and provide useful information for pore-scale modeling required for EUR studies.
Conflicts of interest
There are no conflicts to declare.
Acknowledgements
The authors would like to acknowledge the support of Qatar National Research Fund (a member of Qatar Foundation) through Grant # NPRP11S-1228-170138. The findings herein are the sole responsibility of the authors. Also, the computational resources provided by Texas A&M University in Qatar are appreciated.
References
- A. Sakhaee-Pour and S. L. Bryant, Fuel, 2015, 143, 467–475 CrossRef CAS.
- N. C. Wardlaw and J. P. Cassan, Bull. Can. Pet. Geol., 1978, 26, 572–585 Search PubMed.
- Petro-physics and Rock Physics of Carbonate Reservoirs, ed. K. H. Singh and R. M. Joshi, 2020 Search PubMed.
- Z. R. Beydoun, J. Pet. Geol., 1986, 9, 5–27 CrossRef.
- K. Vasudevan, in Petro-physics and Rock Physics of Carbonate Reservoirs, Springer Singapore, 2020, pp. 15–27 Search PubMed.
- T. P. Burchette, Geol. Soc. Spec. Publ., 2012, 370, 17–37 CrossRef CAS.
- J. D. Wind, D. R. Paul and W. J. Koros, J. Membr. Sci., 2004, 228, 227–236 CrossRef CAS.
- R. Faiz and M. Al-Marzouqi, Sep. Purif. Technol., 2011, 76, 351–361 CrossRef CAS.
- G. Carchini, I. Hussein, M. J. Al-Marri, R. Shawabkeh, M. Mahmoud and S. Aparicio, Appl. Surf. Sci., 2019, 504, 144575 CrossRef.
- N. H. De Leeuw and S. C. Parker, J. Phys. Chem. B, 1998, 102, 2914–2922 CrossRef CAS.
- A. O. Alghamdi, M. B. Alotaibi and A. A. Yousef, Interaction of Ionic Species with Calcite and Oil Components in Waterflooding-Theoretical Study, in IOR 2017-19th European Symposium on Improved Oil Recovery, European Association of Geoscientists & Engineers, 2017, vol. 2017, no. 1, pp. 1–12 Search PubMed.
- F. M. Hossain, G. E. Murch, I. V. Belova and B. D. Turner, Solid State Commun., 2009, 149, 1201–1203 CrossRef CAS.
- N. H. De Leeuw and S. C. Parker, J. Chem. Soc., Faraday Trans., 1997, 93, 467–475 RSC.
- M. Prencipe, F. Pascal, C. M. Zicovich-Wilson, V. R. Saunders, R. Orlando and R. Dovesi, Phys. Chem. Miner., 2004, 31, 559–564 CrossRef CAS.
- R. S. Alvim, F. C. D. A. Lima, V. M. Sánchez, T. F. Headen, E. S. Boek and C. R. Miranda, RSC Adv., 2016, 6, 95328–95336 RSC.
- M. E. Arroyo-De Dompablo, M. A. Fernández-González and L. Fernández-Díaz, RSC Adv., 2015, 5, 59845–59852 RSC.
- D. Di Tommaso, S. E. R. Hernández, Z. Du and N. H. D. Leeuw, RSC Adv., 2012, 2, 4664–4674 RSC.
- R. L. Martin, M. N. Shahrak, J. A. Swisher, C. M. Simon, J. P. Sculley, H.-C. Zhou, B. Smit and M. Haranczyk, J. Phys. Chem. C, 2013, 117, 20037–20042 CrossRef CAS.
- M. Errahali, G. Gatti, L. Tei, L. Canti, A. Fraccarollo, M. Cossi and L. Marchese, J. Phys. Chem. C, 2014, 118, 10053–10060 CrossRef CAS.
- S. Tesson and A. Firoozabadi, J. Phys. Chem. C, 2018, 122, 23528–23542 CrossRef CAS.
- Z. Jin and A. Firoozabadi, Fluid Phase Equilib., 2014, 382, 10–20 CrossRef CAS.
- H. Tanaka, M. El-Merraoui, W. A. Steele and K. Kaneko, Chem. Phys. Lett., 2002, 352, 334–341 CrossRef CAS.
- B. S. Bunnik and G. J. Kramer, J. Catal., 2006, 242, 309–318 CrossRef CAS.
- Y. Qiang Zhu, H. Su, Y. Jing, J. Guo and J. Tang, Appl. Surf. Sci., 2016, 387, 379–384 CrossRef.
- N. X. Qiu, Y. Xue, Y. Guo, W. J. Sun and W. Chu, Comput. Theor. Chem., 2012, 992, 37–47 CrossRef CAS.
- G. Kresse and D. Joubert, Phys. Rev. B: Condens. Matter Mater. Phys., 1999, 59, 1758–1775 CrossRef CAS.
- L. M. Yang, E. Ganz, S. Svelle and M. Tilset, J. Mater. Chem. C, 2014, 2, 7111–7125 RSC.
- J. P. Perdew, K. Burke and M. Ernzerhof, Phys. Rev. Lett., 1996, 77, 3865–3868 CrossRef CAS PubMed.
- H. Toulhoat, P. Raybaud, S. Kasztelan, G. Kresse and J. Hafner, Catal. Today, 1999, 50, 629–636 CrossRef CAS.
- P. E. Blöchl, Phys. Rev. B: Condens. Matter Mater. Phys., 1990, 41, 5414–5416 CrossRef PubMed.
- J. B. A. Davis, F. Baletto and R. L. Johnston, J. Phys. Chem. A, 2015, 119, 9703–9709 CrossRef CAS PubMed.
- S. Grimme, J. Antony, S. Ehrlich and H. Krieg, ChemPhysChem, 2011, 12(17), 3414–3420 CrossRef PubMed.
- Dassault Systèmes BIOVIA, Material Studio, Dassault Systèmes, San Diego, 2017 Search PubMed.
- G. Carchini, I. Hussein, M. J. Al-Marri, R. Shawabkeh and S. Aparicio, in Third EAGE WIPIC Workshop: Reservoir Management in Carbonates, European Association of Geoscientists & Engineers, 2019, vol. 2019, pp. 1–5 Search PubMed.
- S. Kerisit, S. C. Parker and J. H. Harding, J. Phys. Chem. B, 2003, 107, 7676–7682 CrossRef CAS.
- S. Smidstrup, T. Markussen, P. Vancraeyveld, J. Wellendorff, J. Schneider, T. Gunst, B. Verstichel, D. Stradi, P. A. Khomyakov, U. G. Vej-Hansen, M.-E. Lee, S. T. Chill, F. Rasmussen, G. Penazzi, F. Corsetti, A. Ojanperä, K. Jensen, M. L. N. Palsgaard, U. Martinez, A. Blom, M. Brandbyge and K. Stokbro, J. Phys.: Condens. Matter, 2020, 32, 1–36 CrossRef PubMed.
- A. T. Onawole, I. A. Hussein, M. E. M. Ahmed, M. A. Saad and S. Aparicio, J. Mol. Liq., 2020, 302, 1–10 CrossRef.
- X. Tian, T. Wang, L. Fan, Y. Wang, H. Lu and Y. Mu, Appl. Surf. Sci., 2018, 427, 357–362 CrossRef CAS.
- R. Tran, Z. Xu, B. Radhakrishnan, D. Winston, W. Sun, K. A. Persson and S. P. Ong, Scientific Data, 2016, 3(1), 1–13 CrossRef PubMed.
- M. J. Ungerer, D. Santos-Carballal, A. Cadi-Essadek, C. G. C. E. Van Sittert and N. H. De Leeuw, J. Phys. Chem. C, 2019, 123, 27465–27476 CrossRef CAS PubMed.
- R. Hamdan and H.-P. Cheng, Bull. Am. Phys. Soc., 2012, 57 Search PubMed.
- M. S. Kuklin, K. Honkala and H. Häkkinen, J. Phys. Chem. C, 2019, 123, 7758–7765 CrossRef CAS.
- S. Mokhatab and W. A. Poe, Handbook of natural gas transmission and processing, Gulf professional publishing, 2012 Search PubMed.
- T. A. Manz and N. G. Limas, RSC Adv., 2016, 6, 47771–47801 RSC.
- N. G. Limas and T. A. Manz, RSC Adv., 2016, 6, 45727–45747 RSC.
- M. E. Madjet, F. El-Mellouhi, M. A. Carignano and G. R. Berdiyorov, J. Appl. Phys., 2016, 119, 165501 CrossRef.
- A. Schlapka, M. Lischka, A. Groß, U. Käsberger and P. Jakob, Phys. Rev. Lett., 2003, 91, 016101 CrossRef CAS PubMed.
Footnote |
| † Electronic supplementary information (ESI) available. See DOI: 10.1039/d0ra02471f |
|
| This journal is © The Royal Society of Chemistry 2020 |
Click here to see how this site uses Cookies. View our privacy policy here.  Open Access Article
 a,
Ibnelwaleed A. Hussein
 *a,
Giuliano Carchinia,
A. Sakhaee-Pourb and
Golibjon R. Berdiyorov*c
![[3 with combining macron]](https://www.rsc.org/images/entities/char_0033_0304.gif) c space group. The experimental bulk geometry was downloaded from the database in materials studio33 with lattice parameters of a = b = 4.99 Å and c = 17.061 Å.9,34 The isolated adsorbate molecule (CH4) was modeled using the gamma k-point sampling in a periodic box of 10 × 10 × 10 Å3 to avoid the interactions with the periodic images. A vacuum region was extended to 10 Å in the z direction and applied on all surfaces to avoid interaction with the neighboring cells. Nine surface morphologies were studied (Table 1) and these surfaces were selected from the literature.10,35 However, the studied surfaces account for most of the component of calcite. The first two layers on all the studied surfaces were allowed to relax while the rest was fixed to replicate the bulk nature. The number of layers for all the surfaces was not equally the same, as different supercell was used for each surface depending on its termination. For the adsorption calculations, the CH4 molecule was placed within this vacuum region. The Quantum ATK virtual Nano lab was used for building the models and visualization of results.36,37
c space group. The experimental bulk geometry was downloaded from the database in materials studio33 with lattice parameters of a = b = 4.99 Å and c = 17.061 Å.9,34 The isolated adsorbate molecule (CH4) was modeled using the gamma k-point sampling in a periodic box of 10 × 10 × 10 Å3 to avoid the interactions with the periodic images. A vacuum region was extended to 10 Å in the z direction and applied on all surfaces to avoid interaction with the neighboring cells. Nine surface morphologies were studied (Table 1) and these surfaces were selected from the literature.10,35 However, the studied surfaces account for most of the component of calcite. The first two layers on all the studied surfaces were allowed to relax while the rest was fixed to replicate the bulk nature. The number of layers for all the surfaces was not equally the same, as different supercell was used for each surface depending on its termination. For the adsorption calculations, the CH4 molecule was placed within this vacuum region. The Quantum ATK virtual Nano lab was used for building the models and visualization of results.36,37


