DOI:
10.1039/D0RA02960B
(Paper)
RSC Adv., 2020,
10, 23417-23430
Chitosan/MCM-48 nanocomposite as a potential adsorbent for removing phenol from aqueous solution
Received
1st April 2020
, Accepted 7th June 2020
First published on 19th June 2020
Abstract
A new hybrid mesoporous nanocomposite (CMCM-48) based on chitosan and silica MCM-48 was considered as a potential adsorbent for removing phenol from aqueous solutions (toxic liquid waste) in a batch process. The new composite adsorbent was characterized by scanning electron microscopy (SEM), Fourier transform infrared spectroscopy (FT-IR), X-ray diffraction (XRD), and nitrogen adsorption–desorption isotherms. The adsorption isotherm studies were analyzed using linear and nonlinear Langmuir, Freundlich and Dubinin–Radushkevich models for the optimum conditions when the initial phenol concentration, pH, adsorption temperature and time were 10–500 mg L−1, 3–10, 25.5 °C and 300 min, respectively. It was revealed that the experimental results agree well with the Dubinin–Radushkevich model, i.e. the correlation coefficient R2 was 0.983085. The adsorption kinetics was modeled with linear and nonlinear pseudo-first-order, pseudo-second-order and intra particle diffusion kinetic models. The pseudo-second-order model was the best for describing the adsorption process with a correlation coefficient R2 = 0.99925. The stability of the equilibrium data was studied for a phenol sorbent with a maximum adsorption capacity of 149.25 mg g−1. The results verified that the synthesized CMCM-48 was an efficient adsorbent for removing phenol from aqueous solutions.
Introduction
Pollution of drinking water with chemical compounds from different industries is one of the major environmental issues that face humanity. Wastewaters containing organic pollutants such as phenolic compounds represent a serious risk to water quality and human health such as cancer, poisoning, and malformation.1 It is commonly known that, among water pollutants, phenolic compounds have poor biodegradability, high toxicity even at low concentrations and high possibility of accumulation within the environment. Accordingly, phenol has been considered as a priority pollutant by the United States Environmental Protection Agency (USEPA) and the National Pollutant material Release Inventory (NPRI) of Canada.2,3 Phenol is a weak acid that has a carcinogenic nature and causes environmental problems when it exists in natural water. Phenolic compounds are important for different industrial activities such as oil refining, paint, plastic, petrochemical, pharmaceutical, paper, pulp, and wood products.4,5
The discharge of those phenolic compounds into the environment without treatment could result in serious risks to humans, animals, and aquatic systems.1 Thus, it is crucial to develop new materials and effective strategies to remove those pollutants from wastewaters. There are several available treatment methods such as electrochemical oxidation, chemical oxidation, extraction, distillation, redox reactions, membrane separation, photocatalytic degradation, precipitation, solvent extraction, and adsorption techniques. Recently, the tendency of phenolic compounds removal involves the adsorption process that could effectively remove a variety of inorganic and organic pollutants from wastewater through three mechanisms, i.e., chemical adsorption, physical adsorption, and ion exchange adsorption.6 In the adsorption process, the molecules of the contaminants are preserved on the adsorbent surface and thus may be separated from the water. Various adsorbents have been explored widely for phenol removal such as carbon nanotubes,7 activated carbon,8 modified diatomite,9 chitosan (CS)10,11 and mesoporous silica.12 Chitosan is one of the most promising adsorbents because chitosan may be considered as a natural compound produced from chitin which has the following advantages: (i) it exists with abundance, (ii) it has brilliant properties such as biocompatibility, biodegradability, and non-toxicity, (iii) its microstructure can be modified in many ways (cross-linking, grafting, functionalization for forming composites, etc.). Moreover, chitosan is an efficient sorbent owing to the presence of amino and hydroxyl groups on its polymeric backbone that can serve as chelating and reaction sites between pollutants and chitosan (metals, ions, phenols, dyes, pharmaceutical drugs, pesticides, herbicides, etc.).13 However, CS can be dissolved in acidic solutions, leading to agglomeration and gel forming, which makes it difficult for CS to disperse and prevents certain hydroxyl and amino groups from chelating metal ions.14 To increase the adsorption capacity and enhance the acid resistance, CS is modified by various chemical or physical approaches. Mesostructured inorganic silica as such as CM-48, MCM-41, M, MSU, and SBA are good adsorbents due to their high surface area and pore volume, and uniform pore size.15 MCM-48 was considered as one of the famous mesoporous silica materials with an interwoven and branched pore structure which make it an excellent material for adsorbing phenol from aqueous solutions16 owing to its regular pore structure, large surface area, and adjustable pore size. The objective of the present work is to explore the possibility of using a new CS/MCM-48 nanocomposite material (CMCM-48) for removing phenol, as organic hazardous waste, from the aqueous wastewater. The new proposed material has the advantage of low-cost and high surface area. The influence of operational parameters such as temperature, pH, contact time and the initial concentration of phenol pollutant solution on the adsorption capacity of CMCM-48was studied. Additionally, the adsorption features were modeled isothermally and kinetically.
Materials and experimental method
Chemicals and reagents
Tetraethyl orthosilicate (TEOS, 98%), chitosan, HCl (37%), acetone, acetic acid, glutaraldehyde (Glu), cetyltrimethylammonium bromide (CTAB) and MCM-48 given as (CTS) from Sigma-Aldrich with purity grade 98%.
Adsorbate and solution
Sigma-Aldrich supplied analytical-reagent grade phenol. The stock solution can be prepared by dissolving, without pH change, the required amount of phenol in dual distilled water. Sequent dilutions were obtained to obtain operating solutions of the desired concentrations.
Synthesis of mesoporous chitosan–silica composites
The one-pot preparation procedure of TEOS5/5.5–15-CTS2@95 using tetraethyl orthosilicate (TEOS) was used as a silicon precursor. In these notation, the numbers 5/5.5 is the added mass of TEOS in grams, the number 15 is the volume (25%) in ml of Glu, the number 2 is the mass of CTS in grams, and the 95 denotes the aging temperature (°C). The preparation procedures include the following: firstly, TEOS (12.5 g) was dissolved into deionized water (DI, 12.5 g).17,18 Secondly, after the reaction mixture was homogenized by stirring for 1 h at 313 K, another portion of the TEOS solution was added dropwise, followed by stirring for 1.5 h. Thirdly, the hydrothermal reaction was statically performed at 368 K (95 °C) for another 20 h. The synthesized nanocomposite was collected by filtration, washed with water/ethanol (40 mL approximately 6 times). Finally, after the addition of chitosan (2.0 g, 0.012 mol) dissolved in acetic acid (50 mL, 2%) and Glu solution (15 mL, 25%), the mixture was stirred for 4.5 h at 313 K (the final sample was dried at 323 K for 10.1 g of the final product, referred to as TEOS 5/5.5–15-CTS2@95).
Characterization of materials
The CMCM-48 composite was examined using a double beam UV-vis spectrophotometer (Shimadzu, Japan). The pH was estimated by using a pH meter (Eosan). The surface functional groups were detected on a Spectra One FT-IR spectrophotometer in the range 500–4000 cm−1. The morphology of the mesoporous materials was examined using a scanning electron microscope (SEM)(JEOL). The concentrations of metal ions coexisted during a mixture solution were determined by inductively coupled plasma-optical emission spectroscopy (ICP-OES) employing a PE-8000 mass spectrometer (PerkinElmer, Wellesley, MA). Elemental analysis of materials was carried out using a Flash EA 1112 elemental analyzer. X-ray diffraction (XRD) was utilized to identify the crystal structure of CMCM-48 samples. XRD patterns were recorded with a Philips 1830 powder X-ray diffractometer, using the Cu-Kα radiation source of wavelength 1.5406 Å for 2 h, ranging from 0.8° to 6.0°, with a 2θ step size of 0.01° and a step time of 1 s. Adsorption–desorption isotherms of synthesized samples were obtained at 77 K (−196 °C) on micromeritic model ASAP 2010 sorptometer to determine an average pore diameter. Pore size distributions were calculated by the Barrett–Joyner–Halenda (BJH) method, while the surface area of the sample was measured by the Brunauer–Emmett–Teller (BET) method in the range of relative pressures between 0.05 and 0.20.
Batch equilibrium isotherm
In adsorption equilibrium, experiments were conducted using the batch contact technique. A set of 250 mL Erlenmeyer flasks, wherever solutions of phenol (200 mL) with varying initial concentrations (10, 50, 250, and 500 mg L−1) were added in these flasks. The effect of experimental parameters, such as adsorbent dosage (0.2 mg), pH value (3–10), initial phenol concentration (10–500 mg L−1) and contact time (300 min) was studied using batch processing. The influence of equal masses of 0.20 g of CMCM-48 of particle size 150 μm was added to phenol solutions and each sample was kept in an isothermal shaker of 120 rpm at 30 ± 1 °C for 24 h to reach the equilibrium of the solid–solution mixture at constant pH. A similar procedure was followed for another set of Erlenmeyer flask containing the same phenol concentration without CMCM-48 to be used as a blank. Then, the flasks were removed from the shaker. The final phenol concentration in the solution was evaluated using a double beam UV–vis spectrophotometer (Shimadzu, Japan) at λmax = 270 nm wavelength. The phenol adsorption capacity qe (mg g−1) and removal efficiency R (%) efficiency were calculated using eqn (1) and (2), respectively:
Adsorption capacity:
| |
 | (1) |
Removal efficiency:18,19
| |
 | (2) |
where
C0 is the initial and
Ce is the final concentration in the phenol solutions (mg L
−1),
V (L) is the volume of the adsorbate solution, and
W (g) is the mass of dry adsorbent used. The pH of the solution was adjusted using the required volumes of either 0.1 M HCL and/or 0.1 N NaOH before adding the adsorbent.
The techniques of the kinetic experiments were studied in contrast to those of the equilibrium studies. The aqueous samples were taken at various periods of time, and the phenol concentrations were measured similarly.
Results and discussion
Characterization of CMCM-48
The FT-IR spectra of MCM-48 and chitosan were shown in Fig. 1. Fig. 1A reflects the characteristic peaks of MCM-48. The peak at 3400 cm−1 is corresponding to O–H stretching vibration in (–COOH group). The peaks at 3005 and 2900 and 1600 cm−1 are corresponding to C–H stretching vibration and C![[double bond, length as m-dash]](https://www.rsc.org/images/entities/char_e001.gif) O stretching mode, respectively. The peaks at 1150 and 900 cm−1 are associated with Si–O vibration, which corresponds to characteristic peaks of SiO2. Fig. 1B shows the FT-IR spectrum of CMCM-48. Besides the SiO2, two new peaks at 1600 and 1550 cm−1 correspond at the C–O stretching vibration of NHCO and the N–H bending of NH2; the large peak at 3440 cm−1 was triggered by simultaneous vibrations of O–H and N–H as the –NH2 absorption band moved to a lower value.
O stretching mode, respectively. The peaks at 1150 and 900 cm−1 are associated with Si–O vibration, which corresponds to characteristic peaks of SiO2. Fig. 1B shows the FT-IR spectrum of CMCM-48. Besides the SiO2, two new peaks at 1600 and 1550 cm−1 correspond at the C–O stretching vibration of NHCO and the N–H bending of NH2; the large peak at 3440 cm−1 was triggered by simultaneous vibrations of O–H and N–H as the –NH2 absorption band moved to a lower value.
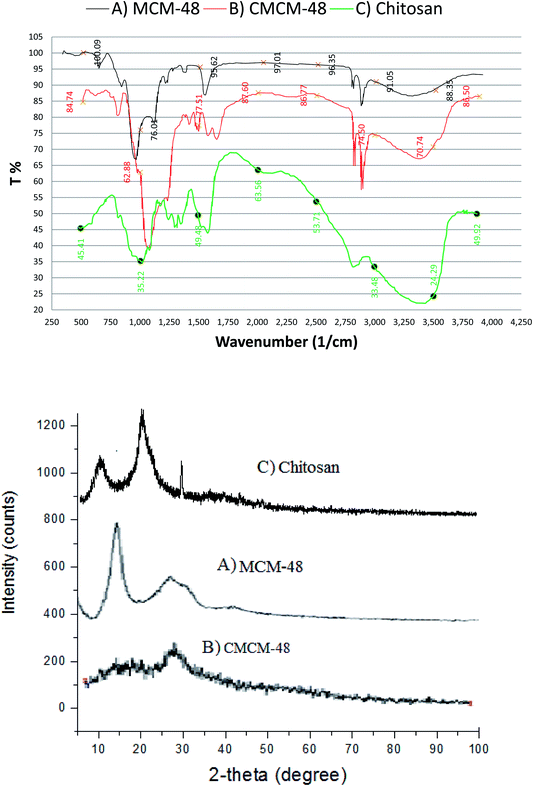 |
| | Fig. 1 FT-IR spectra and XRD analysis of the synthesized MCM-48 (A), CMCM-48 (B) and (C) chitosan. | |
The absorption of C–O–C stretch appeared at 1152 cm−1 and the C–O stretch was found at 1074 cm−1. According to the results, the wave number obtained was the characteristic absorption of chitosan. The characteristic spectrum of the chitosan–silica was not different from the spectrum of chitosan as there was only a narrow shift of wave number and addition of new peak. In the spectrum of the chitosan–silica membrane, wave number shifted from 3384 cm−1 to 3367 cm−1 which indicated the interaction between OH groups of silica and N–H of chitosan. The presence of absorption at 1076 cm−1 showed the vibration of Si–O–Si while at 897 cm−1, respectively.20
FTIR spectra of chitosan are shown in Fig. 1C. The peak observed at 3447 cm−1 is attributed to –NH2 and –OH groups stretching vibration. This peak is sharper in the chitosan indicating that the hydrogen bonding is enhanced. The peaks at 1657 cm−1 and 1598 cm−1 are attributed to the CONH2 and NH2 groups, respectively. The other significant band for CN was observed at 1411 cm−1 owing to –CH2 wagging.21
The XRD pattern of the prepared magnetic MCM-48 is presented in Fig. 1. The result showed relatively well defined XRD pattern for magnetic MCM-48 material, with one strong peak around 2.45 and two small peaks at 4.25 and 4.83 that were assigned to (100), (110), and (200) planes, respectively. Moreover, the fourth peak at 6.44 can be observed and indexed as (210) in the hexagonal system. The observed well-resolved diffraction peaks come from the typical MCM-48.
The XRD pattern of chitosan prepared from waste prawn shells exhibited two characteristic broad diffraction peaks at 2θ around 9.63 and 20.53 that are typical fingerprints of semi-crystalline chitosan as indicated in Fig. 1. The peaks around 9.63 and 20.53 are related to crystal-I and crystal-II in chitosan structure and both of these peaks are due to a high degree of crystallinity to the prepared chitosan.22
XRD patterns for CMCM-48 are shown in Fig. 1. The obtained characteristic diffraction peaks for CMCM-48 are consistent with those in the literature, which indicated that the mesomorphic orders of MCM-48 remain intact on inclusion of chitosan.22 Compared with XRD diffractograms of MCM-41-PAA, however, the apparent decrease in intensity of the (100) diffraction peaks for CMCM-48 in Fig. 1 and other peaks were not observed, suggesting that the ordered structure of nanocomposites was slightly changed due to change of the inherent order caused by the formation of CMCM-48.
As seen in Fig. 2, the SEM image shows the morphology and porosity of the chitosan-based mesoporous silica with a large surface area that could sustain phenol adsorption. The SEM images showed a homogeneous dispersion of the white striped CS with the mesoporous material, forming a spherical structure.
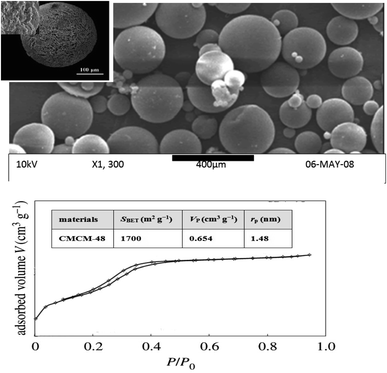 |
| | Fig. 2 SEM micrograph and N2 adsorption–desorption isotherms of CMCM-48 nanocomposite. | |
The nitrogen adsorption–desorption isotherms over the surface of the CMCM-48 as well as the pore size distribution curves of various prepared samples are illustrated in Fig. 2. Three well-distinguished regions of the adsorption isotherms are evident: (i) monolayer–multilayer adsorption, (ii) capillary condensation and (iii) multilayer adsorption on the outer particle surface. Apparently, CMCM-48 exhibits type IV isotherm with a distinct capillary condensation step, which is a characteristic pattern of mesoporous materials according to IUPAC classification. N2 adsorption–desorption isotherms of CMCM-48 illustrate a clear H1-type hysteresis loop in the relative pressure range between 0.13 and 0.48, implying the presence of very regular mesoporous channels. Collapse of the hysteresis loop is indicated with pronounced narrowing of pore radius, indicating the presence of mesopores.
Effect of pH value on phenol adsorption
The initial pH of adsorption phenol played a significant role in the adsorption of phenol onto CMCM-48. To study the influence of pH, all the experiments were performed at a temperature of 25.5 °C and phenol initial concentration of 500 mg L−1 using different pH values in the range 3–10. The pH was analyzed by adding few drops of diluted either 0.1 N NaOH or 0.1 N HCl. Fig. 3 illustrates the variation of adsorption capacity with different values of pH, which reveal that the phenol adsorption is maximum up pH value of 8 after which it decreases as the pH increases. This could be attributed to the effect of pH on the surface properties and the degree of ionization of the adsorbate. Here, phenol being as a weak acid with pKa value ≈ 9.89 is dissociated at pH > pKa. The reason could be also due to the electrostatic repulsion force between the negative surface charge of the phenol and the cationic surface of the nanocomposite. While at acidic pH, the percentage removal was higher because phenol was unionized and the dispersion interaction was predominant.
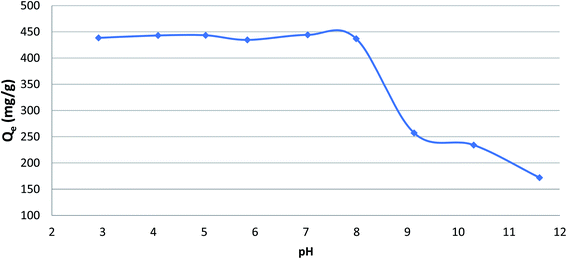 |
| | Fig. 3 Effect of pH on the adsorption of phenol onto CMCM-48 (initial concentration = 500 mg L−1, contact time = 120 min, the adsorbent dosage = 0.1 g, temperature = 25.5 °C). | |
Effect of temperature
Fig. 4 reveals the influence of temperature on the phenol percentage removal (R%)at temperatures 298 and 318 K over the adsorption system from 298 to 318 K to 50 °C.The behavior of the graph shows that the maximum removal was 86.33, 78.38 and 77.77% at temperatures 298, 305 and 318 K respectively. It appears that the decrease in removal percentage of phenol with increasing temperature because of the occurred damage to the active binding sites and weakening of the binding forces between the phenolic and adsorbent molecules.
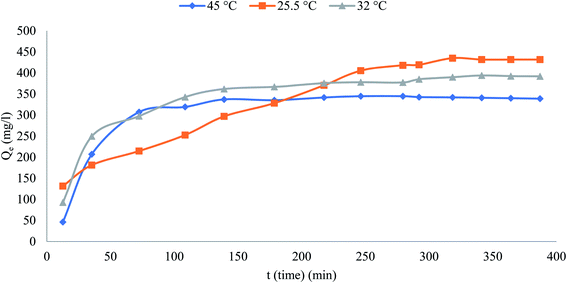 |
| | Fig. 4 Effect of temperature on removal on phenol% (initial concentration = 500 mg L−1, the adsorbent dosage = 0.1 g). | |
Effect of contact time
Fig. 5 depicts the influence of adsorption time in the range from 0 to300 min on the adsorption capacity and removal efficiency of the phenol at various initial concentrations (50, 100, 250 and 500 mg L−1). The figure indicates that the adsorption capacity reaches a plateau immediately after a very short contact time especially for initial concentration 50–250 mg L−1. For the highest initial concentration, it took slightly longer time to reach the plateau. Eventually, a plateau is attained in all curves indicating that the adsorbent is saturated at this level. The adsorption capacity of phenol increased quickly with increased adsorption time at the initial period. Specifically, under the conditions of initial phenol concentration 500 mg L−1 during the initial 80 min and reached equilibrium at around 200 min. The adsorption rates responded quickly due to the accessibility of more adsorption/vacant sites at the initial stage.23
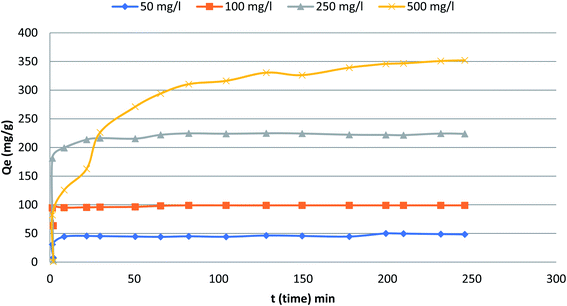 |
| | Fig. 5 The variation of adsorption with time at different initial phenol concentrations (the adsorbent dosage = 0.1 g, temperature = 25.5 °C). | |
Effect of adsorbent mass
The effect of adsorbent dose on the removal of phenol was studied by varying the dose of adsorbent from 0.05 to 0.35 g L−1 (Fig. 6). The adsorption capacity of phenol removal steeply increased with the adsorbent loading up to 0.35 g L−1. The increased adsorption of phenol by increasing the amount of adsorbent is due to an increase in the active sites and effective surface in the adsorbent.
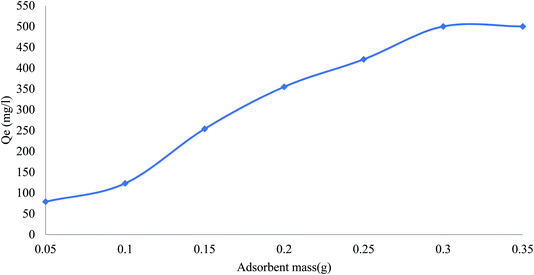 |
| | Fig. 6 Effect of adsorbent dose on removal efficiency of pollutants by CMCM-48 (contact time = 120 min, pH = 4, pollutants concentration = 500 mg L−1). | |
Adsorption isotherms
The adsorption isotherm is principally described as how solutes interact with adsorbents and optimize the critical adsorption capacity. Therefore, adsorption data of phenol on CMCM-48 were employed to test Langmuir, Freundlich, and Dubinin–Radushkevich isotherm models, used to explain the relationship between the amount (qe) adsorbed by the phenol and the concentration of the equilibrium (Ce).
Langmuir isotherm
The Langmuir isotherm assumed that the physical monolayer adsorption takes place at a finite number of homogeneous sites with the adsorbent.24 Then it is assumed that when phenol occupies a site, no further adsorption can take place at the surface.
It is generally applicable for homogenous surface. The general form of the expression is given by eqn (3)
| |
 | (3) |
where,
Ce was the equilibrium concentration (mg L
−1),
QL (mg g
−1) and
KL (L mg
−1) are the Langmuir's constants.
The linear Langmuir adsorption form can be represented as follows:
| |
 | (4) |
where
Ce (mg L
−1) is the equilibrium concentration of the adsorbate,
qe (mg g
−1) is the phenol adsorbed amount per unit mass of adsorbent,
Qo is associated with adsorption capacity and
KL is Langmuir constant which determines the energy of adsorption (L mg
−1).
Fig. 7 shows the linear relationship of Ce/qe versus Ce using the obtained experimental data, which suggests the Langmuir model applicability (R2 = 0.98), which is monolayer adsorption at the outer surface of the adsorbent. The constants of Qo and Calculated from the slope and intercept of the plot, respectively are listed in Table 1.
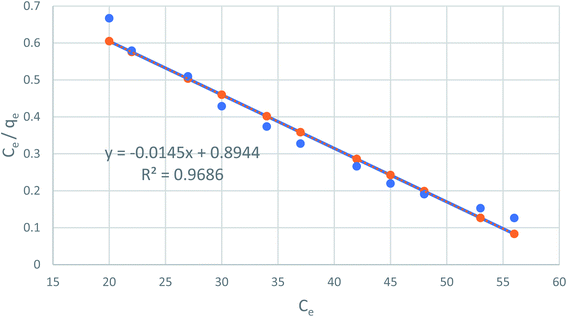 |
| | Fig. 7 The Langmuir adsorption isotherm of phenol on CMCM-48 at 25.5 °C. | |
Table 1 Data showing the values of the linear adsorption isotherms obtained for phenol adsorption on CMCM-48 nanocomposite
| Isotherm equation |
CMCM-48 |
| Temperature |
298 |
![[thin space (1/6-em)]](https://www.rsc.org/images/entities/char_2009.gif) |
| Langmuir |
| Qo (mg g−1) |
69.0151 |
| KL (L mg−1) |
0.0162 |
| R2 |
0.968635 |
| RL |
0.11–0.55 |
![[thin space (1/6-em)]](https://www.rsc.org/images/entities/char_2009.gif) |
| Freundlich |
| Kf (mg g−1) |
0.012474 |
| n |
0.391051 |
| R2 |
0.984616 |
![[thin space (1/6-em)]](https://www.rsc.org/images/entities/char_2009.gif) |
| D–R |
| qm (mg g−1) |
365.7985 |
| β (mol2 kJ−2) |
0.000196 |
| E (kJ mol−1) |
−50.4713 |
| R2 |
0.85714 |
The essential characteristics of the Langmuir isotherm can be defined in terms of a dimensionless separation factor (RL) identified as:
| |
 | (5) |
where
KL is the Langmuir constant and (
Co) is the maximum phenol concentration (mg L
−1). The value of
RL illustrates the type of the isotherm to be either favorable (0 <
RL < 1), unfavorable (
RL > 1), linear (
RL = 1), or irreversible (
RL = 0). The
RL value was estimated to be 0.0309 and this again confirmed that the Langmuir adsorption isotherm was favorable for phenol adsorption onto CMCM-48 under the used conditions in this study.
Freundlich isotherm
Freundlich isotherm is commonly described as the multilayer adsorption of phenol occurs on a heterogeneous surface and the phenol adsorbed amount increases with increasing concentration.25
The Freundlich isotherm fit an empirical equation expressed as:
where
KF is roughly an indicator of the adsorption capacity for phenol and (1/
n) of the adsorption intensity. The value of
n > 1 represents a favorable adsorption condition. The linear Freundlich form of
eqn (6) is:
| |
 | (7) |
Fig. 8 reveals the straight line with a slope of (1/n) and an intercept of ln(KF) when ln(qe) is plotted versus ln(Ce). The value of n was estimated to be 2.48, indicating that the favorable physical adsorption. Vander-Waal's forces involved in adsorption.
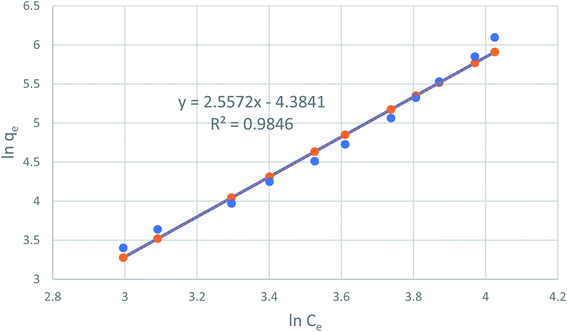 |
| | Fig. 8 Freundlich adsorption isotherm of phenol onto CMCM-48 at 25.5 °C. | |
Dubinin–Radushkevich isotherm model
Dubinin–Radushkevich isotherm is generally expressed as the Gaussian energy distribution with adsorption mechanism onto a heterogeneous surface.24,26 The model has successfully fitted the intermediate-range and maximum solute activities of concentrations data well. The linear D–R isotherm form is given as:| |
ln![[thin space (1/6-em)]](https://www.rsc.org/images/entities/char_2009.gif) Qe = ln Qe = ln![[thin space (1/6-em)]](https://www.rsc.org/images/entities/char_2009.gif) Qm − βε2 Qm − βε2
| (8) |
where qe is the phenol adsorbed amount per unit mass of adsorbent (mg g−1), Qm is theoretical isotherm saturation capacity (mg g−1), β is the constant of the sorption energy (mol2 kJ−2), and ε is Polanyi potential, which is described as| |
 | (9) |
where T is the temperature of the solution (K) and R is the gas constant and is equal to 8.314 J mol−1 K−1. The values of qm and β are calculated from the plot, as shown in Fig. 8 plotting of ln qe versus ε2, are illustrated in Table 1 and Fig. 9.
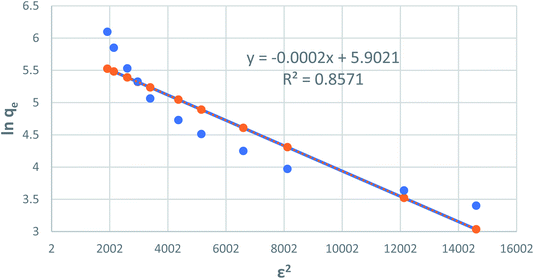 |
| | Fig. 9 Dubinin–Radushkevich adsorption isotherm of phenol onto CMCM-48 at 25.5 °C. | |
Fig. 10 shows Langmuir, Freundlich and Dubinin–Radushkevich adsorption isotherms of the phenol by nonlinear analysis while Table 2 shows the values of the corresponding isotherm parameters and the correlation coefficients (R2) for each parameter. In Table 2 and Fig. 10, high R2 value are obtained by fitting the experimental data into the Langmuir isotherm model (R2 > 0.973) and the Dubinin–Radushkevich isotherm model (V > 0.946), as compared with the Freundlich isotherm model (R2 > 0.858). These suggest that both Langmuir and Dubinin–Radushkevich isotherm models can satisfactory fit the experimental data, while Freundlich isotherm model cannot. As shown, the values of maximum adsorption capacity determined using the Langmuir model was 59.5 mg P g−1 for CMCM-48. These values are near the experimental adsorbed amounts and correspond closely to the adsorption isotherm plateau, which indicates that the modeling of Langmuir for the adsorption system is acceptable. Moreover, the adsorption mechanism of the experimental system might be caused by the monolayer adsorption. The values of the theoretical monolayer saturation capacity in the Dubinin–Radushkevich model, obtained using non-linear regression, are all lower than the experimental amounts corresponding to the adsorption isotherm plateau, indicating that the modeling of Dubinin–Radushkevich for the adsorption system is unacceptable. Therefore, by comparison, the order of the isotherm best fits the four sets of experimental data in this study is Langmuir > Dubinin–Radushkevich > Freundlich.
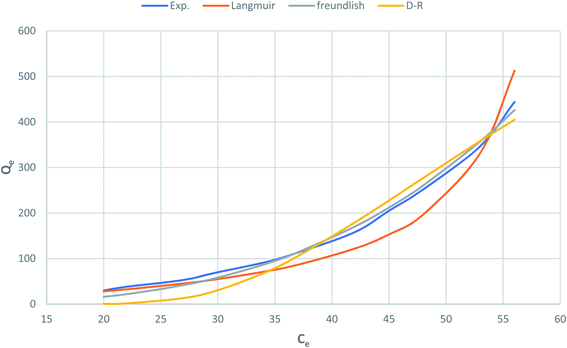 |
| | Fig. 10 Nonlinear plot of adsorption isotherm models for phenol adsorption onto CMCM-48 nanocomposite. | |
Table 2 Data showing the values of the non-linear adsorption isotherms obtained for phenol adsorption on CMCM-48 nanocomposite
| Isthermal model |
| Langmuir model |
Qmax |
KL |
R2 |
RL |
| |
59.5 |
0.016 |
0.973328 |
1.0 |
| Isthermal model |
| Freundlich isotherm |
KF |
n |
R2 |
| |
0.001132 |
0.313542 |
0.858497 |
| Isthermal model |
| D–R model |
qm |
β |
R2 |
E |
| |
1171.557 |
0.000552 |
0.945618 |
30.0861 |
Adsorption kinetics
Kinetic studies predict adsorption rate constants such as adsorption mechanism and adsorption efficiency. The capability of the pseudo-first and pseudo-second-order kinetic models was evaluated at a constant temperature of 25.5 °C.
The kinetic adsorption data were treated with pseudo-first-order kinetic model:
| |
 | (10) |
where
qe and qt refer to the adsorption capacity (mg g
−1) at equilibrium and at any time,
t (h), respectively, and
k1 is the pseudo-first-order sorption rate constant of (h
−1). Integration of
eqn (10) for the boundary conditions
t = 0 to
t and
qt = 0 to
qt, gives
eqn (11) below:
| |
 | (11) |
Eqn (11) can be rearranged to give eqn (12):
| |
 | (12) |
The slope and intercept of the graph of log (qe − qt) versus t (Fig. 11) were used to estimate the first-order rate constant k1. It can be seen from the results that the experimental (qe) values do not match well with the measured ones, which means that the application of the pseudo-first-order isotherm to the adsorption of the phenol cycle is not feasible.
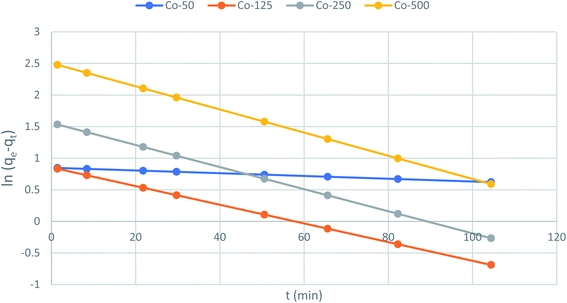 |
| | Fig. 11 Pseudo-first-order kinetics for adsorption of phenol onto CMCM-48 (initial concentration = 500 mg L−1, the adsorbent dosage = 0.1 g, temperature = 25.5 °C). | |
The kinetic data were further analyzed with the pseudo-second-order kinetics. The pseudo-second-order equation is also based on the sorption capacity rate, it provides the best correlation of the experimental data and the adsorption's mechanism is chemically rate controlling.
The equation of pseudo-second-order kinetics is expressed as follows:27
| |
 | (13) |
where
k2 is the pseudo-second-order adsorption rate constant (g mg
−1 h
−1). Integrating
eqn (13) for the boundary condition
t = 0 to
t and
qt = 0 to
qt, gives
eqn (14):
| |
 | (14) |
Which is the integrated rate law for a pseudo-second-order reaction. Eqn (14) can be rearranged to obtain a linear form as eqn (15):
| |
 | (15) |
The second-order rate constant k2can be obtained from the slope and intercept of the plot of t/qt versus t (Fig. 11). The nonlinear equations are expressed in Table 3. The results of the rate constant studies for different initial phenol concentrations by the pseudo-first-order and second-order models and their linear and nonlinear forms are listed in Table 4.
Table 3 The nonlinear equations for Pseudo-first and second-order kinetics
| Isotherm |
Nonlinear form |
| Pseudo first-order |
qt = qe(1−e−k1) |
| Type 2, pseudo second-order |
 |
Table 4 Kinetics parameters for the adsorption phenol on CMCM-48 nanocomposite
| Co (mg L−1) |
qe,exp (mg g−1) |
Pseudo-first-order kinetic model |
Pseudo-second-order kinetic model |
| qe,cal (mg g−1) |
k1 (h−1) |
R2 |
qe,cal (mg g−1) |
k2 (g mg−1 h−1) |
R2 |
| Linear adsorption kinetics models |
| 50 |
42 |
49 |
0.654 |
0.587 |
48 |
0.258 |
0.999 |
| 100 |
78 |
20 |
0.321 |
0.633 |
97 |
0.078 |
0.999 |
| 250 |
200 |
100 |
0.957 |
0.959 |
248 |
0.024 |
0.999 |
| 500 |
300 |
120 |
0.456 |
0.966 |
422 |
0.047 |
1.000 |
![[thin space (1/6-em)]](https://www.rsc.org/images/entities/char_2009.gif) |
| Nonlinear adsorption kinetics models |
| 50 |
42 |
50 |
0.214 |
0.687 |
50.2 |
0.654 |
0.995 |
| 100 |
78 |
22 |
0.376 |
0.423 |
99 |
0.341 |
0.989 |
| 250 |
200 |
111 |
0.321 |
0.979 |
255 |
0.432 |
0.969 |
| 500 |
300 |
132 |
0.567 |
0.826 |
472 |
0.875 |
0.999 |
From the analysis, it can be seen that the qe (experimented) values are relatively similar to those of the qe (calculated) values for the pseudo-second order. It can therefore be inferred that the adsorption of phenol to CMCM-48 nanocomposite is represented in a pseudo-second-order kinetic model. As well as the concern of R2, the applicability of the kinetic models was further proved through normalized standard deviation Δq (%) defined as:
| |
 | (16) |
where the subscripts ‘cal’ and ‘exp’ refer to the calculated and experimental values, respectively and
n is the number of data points. The higher the
R2 value and the lower the Δ
q (%) value the better a match is indicated.
Table 2 lists the values acquired for the Δ
q (%). The results recommended that the overall rate of the phenol adsorption process appeared to be controlled by the chemisorption process and the pseudo-second-order adsorption mechanism was predominant (
Fig. 12).
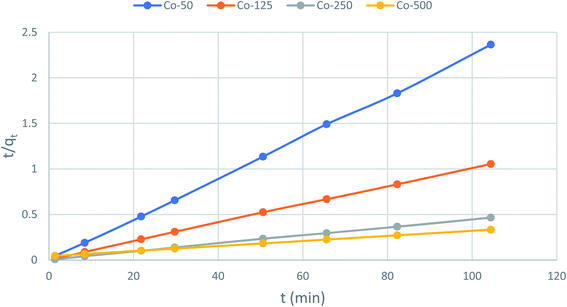 |
| | Fig. 12 Pseudo-second-order kinetics for adsorption of phenol onto CMCM-48 (initial concentration = 500 mg L−1, the adsorbent dosage = 0.1 g, temperature = 25.5 °C). | |
Intraparticle diffusion modeling
Based on the above findings, neither the pseudo-first-order nor the second-order model can evaluate the diffusion mechanism, the kinetic effects have been defined by the intraparticle diffusion model to reveal the diffusion mechanism, which is represented as:twhere q is the phenol adsorbed amount (mg g−1) at time t, ki is intraparticle diffusion constant (mg g−1 min−0.5), and c is the intercept. The constants were calculated and listed in Table 5. If the c value is zero, the adsorption rate is organized by the intraparticle diffusion for the entire adsorption period. Though, the plot of q against t0.5 usually shows more than one linear component, and if the slope of the first component is not zero, the diffusion of the boundary layer at the beginning controls the rate of adsorption. As shown in Fig. 13, the plots were not linear over an all, which meant more than one process had an adsorption effect. The related phenol adsorption pattern on CMCM-48 at different initial concentrations is among the key observations. The multiple nature observed in the intraparticle diffusion plot has been reported to indicate that intraparticle diffusion is not strictly rate-controlling. In addition, external mass transfer of phenol molecules to sorbent particles, particularly during the initial reaction phase, was also significant in the sorption process.
Table 5 Constant intraparticular diffusion for different initial concentrations of phenols
| Linear model |
Nonlinear model |
| Co (mg L−1) |
ki1 (mg g−1 h−0.5) |
R2 |
Co (mg L−1) |
ki1 (mg g−1 h−0.5) |
R2 |
| 50 |
12.4 |
0.958 |
50 |
12.9 |
0.932 |
| 100 |
41.02 |
0.988 |
100 |
43.11 |
0.954 |
| 250 |
16.4 |
0.956 |
250 |
17.01 |
0.987 |
| 500 |
19.2 |
0.928 |
500 |
20.11 |
0.988 |
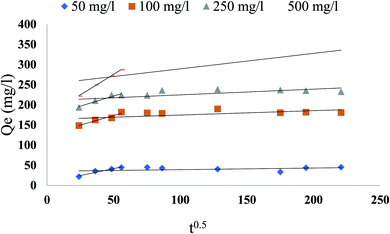 |
| | Fig. 13 Intra-particle diffusion plot for phenol adsorption at 25.5 °C on CMCM-48 for various initial concentrations of phenol. | |
The kinetic isotherm parameters were obtained using the linear least-squares regression method and trial-and-error nonlinear regression method in the Microsoft Excel. The nonlinear and the linearized expressions of the pseudo-first22 and pseudo-second order kinetic22 isotherms are shown in Tables 2 and 4 The lower R2 value shows that pseudo-first order kinetic model was not an appropriate to explain the sorption kinetics. The pseudo-second order kinetic model could be linearized and simple linear regression would result in different parameter estimates.28 In nonlinear method, “solver add-in” of Microsoft Excel was used for determining the pseudo-first order and pseudo second-order kinetic parameters by trial-and-error. Experimental data with the pseudo-first order and pseudo second kinetic model obtained by using the nonlinear method for the sorption of phenol using CMCM-48 was shown (Fig. 14 a–d). It was observed that the nonlinear pseudo first order equation exhibited higher R2 values than the linear form (Table 4). Moreover, the calculated qe value from non-linear pseudo-first order equation was very close to the experimental qe value. The best and worse fit of experimental kinetic data in pseudo first-order kinetics by both nonlinear and linear methods suggested that kinetics was transforming to the worse while linearizing the non-linear pseudo first-order kinetics expression. Hence linear pseudo-first order kinetic expression would be inappropriate to check whether the experimental kinetic was following a first-order kinetics and leaving the nonlinear first-order expression as a better option. From Table 4, it was observed that the kinetic parameters associated with the pseudo-second-order model calculated by linear and nonlinear methods varied a little. No problem was found while using nonlinear method regarding transformations of nonlinear pseudo-second order equation to linear forms, and also they were in the same error structures. Though the values of R2 for nonlinear pseudo second order was almost similar to nonlinear pseudo-second order, but the calculated qe from nonlinear pseudo-second order was more close to the experimental qe value than the difference between qe,exp to qe,cal of linear expression. This simply showed that nonlinear model had an advantage over the linear model (Table 4).
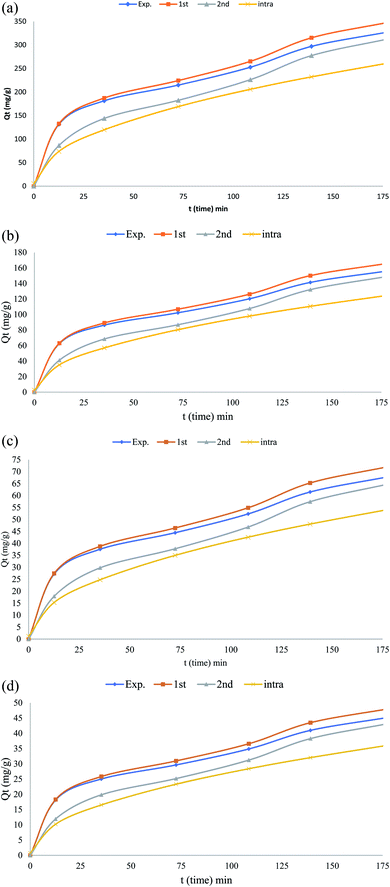 |
| | Fig. 14 (a) Nonlinear adsorption kinetics of phenol on the CMCM-48 nanocomposite (initial concentration = 50 mg L−1, the adsorbent dosage = 0.1 g, temperature = 25.5 °C), (b) nonlinear adsorption kinetics of phenol on the CMCM-48 nanocomposite (initial concentration = 125 mg L−1, the adsorbent dosage = 0.1 g, temperature = 25.5 °C), (c) nonlinear adsorption kinetics of phenol on the CMCM-48 nanocomposite (initial concentration = 250 mg L−1, the adsorbent dosage = 0.1 g, temperature = 25.5 °C), (d) nonlinear adsorption kinetics of phenol on the CMCM-48 nanocomposite (initial concentration = 500 mg L−1, the adsorbent dosage = 0.1 g, temperature = 25.5 °C). | |
Reusability of adsorbent
To determine the likelihood of CMCM-48 adsorbent being regenerated and reused, six cycles of adsorption–desorption were performed using a phenol solution. Desorption behavior was performed under optimum conditions using an aqueous solution of (anhydrous ethanol![[thin space (1/6-em)]](https://www.rsc.org/images/entities/char_2009.gif) :
:![[thin space (1/6-em)]](https://www.rsc.org/images/entities/char_2009.gif) water = 2
water = 2![[thin space (1/6-em)]](https://www.rsc.org/images/entities/char_2009.gif) :
:![[thin space (1/6-em)]](https://www.rsc.org/images/entities/char_2009.gif) 1). Fig. 15 shows that in six cycles, the removal rate of phenol (R%) gradually decreased from 92.94% to 48.13% for phenol solution. The large decrease of removal due to the loss of the associated adsorbent material during the repeated cycles. These results indicate that CMCM-48 adsorbent could perform effectively for reusability even after six cycles.
1). Fig. 15 shows that in six cycles, the removal rate of phenol (R%) gradually decreased from 92.94% to 48.13% for phenol solution. The large decrease of removal due to the loss of the associated adsorbent material during the repeated cycles. These results indicate that CMCM-48 adsorbent could perform effectively for reusability even after six cycles.
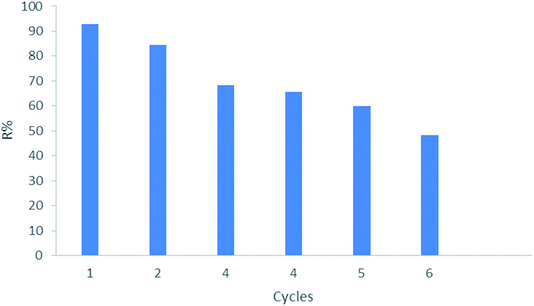 |
| | Fig. 15 Reuse effect ofCMCM-48 for the adsorption of phenol (initial concentration = 500 mg L−1, contact time = 120 min, the adsorbent dosage = 0.1 g, temperature = 25.5 °C). | |
Comparison with other studies
Table 6 reveals that the adsorption efficiency of CMCM-48 is higher than the majority of adsorbents. In short, taking into account the process characteristics of this work, CMCM-48 as a low-cost sorbent not only decreases the amount of chitosan required for cheap use, but also has a high adsorption capacity and good mechanical stability, which recognizes that CMCM-48 is a decent choice for economically viable.
Table 6 Maximum adsorption capacity (qmax) values of phenol on CMCM-48 compared with other reported adsorbents in the literature
| Adsorbent |
qmax (mg g−1) |
Ref. |
| WPT-CTAB |
0.05 |
29 |
| Sawdust |
2 |
30 |
| Eggshell waste |
7.63 |
31 |
| MMT–CTAB |
10.48 |
29 |
| magnetic N-methyl-D glucamine |
13.44 |
32 |
| Natural clay |
15 |
33 |
| Diethylenetriamine–ctivated carbon |
18.12 |
34 |
| Magnetic biosorbent |
59 |
|
| Ca–bentonite–chitosan |
125 |
35 |
| β-Cyclodextrin–chitosan |
92.18 |
36 |
| GA–chitosan |
51.68 |
37 |
| MCM-48–chitosan |
149.25 |
This work |
Conclusion
The removing of phenol from aqueous solutions using chitosan-based MCM-48 nanocomposite as adsorbent was investigated using batch processing. The results illustrate the effect of the experimental parameters on the ability of adsorption for phenol, such as adsorbent dosage, pH value, initial concentrations, and contact time. The maximum adsorption capacity to remove phenol of 149.25 mg g−1 occurred at pH = 8. Equilibrium studies indicate that the data fit very well in the Dubinin–Radushkevich model based on the correlation coefficient (R2 = 0.983085). The adsorption kinetics indicated that the pseudo-second-order isotherm model is better described in the adsorption process. The desorption studies conducted using phenol demonstrated the positive potential of CMCM-48 adsorbent regeneration and reuse, the adsorbents used in this study give many promising advantages for commercial purposes in the future. The results verified that the CMCM-48 prepared is economically promising for wastewater treatment.
Conflicts of interest
There are no conflicts to declare.
References
- X. Sun, C. Wang, Y. Li, W. Wang and J. Wei, Treatment of phenolic wastewater by combined UF and NF/RO processes, Desalination, 2015, 355, 68–74 CrossRef CAS.
- R. Evans, Revised Emergency Planning and Community Right-to-Know Act (EPCRA), Section 313, Toxic Chemical Release reporting for calendar year 1998, Oak Ridge Y-12 Plant, TN (US), 2000 Search PubMed.
- L. G. C. Villegas, N. Mashhadi, M. Chen, D. Mukherjee, K. E. Taylor and N. Biswas, A short review of techniques for phenol removal from wastewater, Curr. Pollut. Rep., 2016, 2, 157–167 CrossRef CAS.
- P. Kazemi, M. Peydayesh, A. Bandegi, T. Mohammadi and O. Bakhtiari, Stability and extraction study of phenolic wastewater treatment by supported liquid membrane using tributyl phosphate and sesame oil as liquid membrane, Chem. Eng. Res. Des., 2014, 92, 375–383 CrossRef CAS.
- S. Mohammadi, A. Kargari, H. Sanaeepur, K. Abbassian, A. Najafi and E. Mofarrah, Phenol removal from industrial wastewaters: a short review, Desalin. Water Treat., 2015, 53, 2215–2234 CrossRef CAS.
- A. E. Ofomaja, Kinetic study and sorption mechanism of methylene blue and methyl violet onto mansonia (Mansonia altissima) wood sawdust, Chem. Eng. J., 2008, 143, 85–95 CrossRef CAS.
- A. S. Deb, V. Dwivedi, K. Dasgupta, S. M. Ali and K. Shenoy, Novel amidoamine functionalized multi-walled carbon nanotubes for removal of mercury (II) ions from wastewater: combined experimental and density functional theoretical approach, Chem. Eng. J., 2017, 313, 899–911 CrossRef.
- G. Mezohegyi, F. P. van der Zee, J. Font, A. Fortuny and A. Fabregat, Towards advanced aqueous dye removal processes: a short review on the versatile role of activated carbon, J. Environ. Manage., 2012, 102, 148–164 CrossRef CAS PubMed.
- S. Li, D. Li, F. Su, Y. Ren and G. Qin, Uniform surface modification of diatomaceous earth with amorphous manganese oxide and its adsorption characteristics for lead ions, Appl. Surf. Sci., 2014, 317, 724–729 CrossRef CAS.
- L. S. Rocha, Â. Almeida, C. Nunes, B. Henriques, M. A. Coimbra, C. B. Lopes, C. M. Silva, A. C. Duarte and E. Pereira, Simple and effective chitosan based films for the removal of Hg from waters: Equilibrium, kinetic and ionic competition, Chem. Eng. J., 2016, 300, 217–229 CrossRef CAS.
- X. Zhu, R. Yang, W. Gao and M. Li, Sulfur-modified chitosan hydrogel as an adsorbent for removal of Hg (II) from effluents, Fibers Polym., 2017, 18, 1229–1234 CrossRef CAS.
- N. Fellenz, P. Martin, S. Marchetti and F. Bengoa, Aminopropyl-modified mesoporous silica nanospheres for the adsorption of Cr (VI) from water, J. Porous Mater., 2015, 22, 729–738 CrossRef CAS.
- J. Marques Jr, S. Lütke, T. Frantz, J. Espinelli Jr, R. Carapelli, L. Pinto and T. Cadaval Jr, Removal of Al (III) and Fe (III) from binary system and industrial effluent using chitosan films, Int. J. Biol. Macromol., 2018, 120, 1667–1673 CrossRef CAS PubMed.
- Y. Fu, X. Xu, Y. Huang, J. Hu, Q. Chen and Y. Wu, Preparation of new diatomite–chitosan composite materials and their adsorption properties and mechanism of Hg (II), R. Soc. Open Sci., 2017, 4, 170829 CrossRef PubMed.
- R. Sanz, G. Calleja, A. Arencibia and E. S. Sanz-Pérez, Amino functionalized mesostructured SBA-15 silica for CO2 capture: Exploring the relation between the adsorption capacity and the distribution of amino groups by TEM, Microporous Mesoporous Mater., 2012, 158, 309–317 CrossRef CAS.
- J. W. Lee, W. G. Shim and H. Moon, Adsorption equilibrium and kinetics for capillary condensation of trichloroethylene on MCM-41 and MCM-48, Microporous Mesoporous Mater., 2004, 73, 109–119 CrossRef CAS.
- M. Fathy, M. A. Zayed and Y. M. Moustafa, Synthesis and applications of CaCO3/HPC core–shell composite subject to heavy metals
adsorption processes, Heliyon, 2019, 5, e02215 CrossRef PubMed.
- H. H. El-Maghrabi, R. Hosny, M. Ramzi, M. A. Zayed and M. Fathy, Preparation and Characterization of Novel Magnetic ZnFe2O4–Hydroxyapatite Core–Shell Nanocomposite and Its Use as Fixed Bed Column System for Removal of Oil Residue in Oily Wastewater Samples, Egypt. J. Pet., 2019, 28, 137–144 CrossRef.
- G. L. Dotto, T. Cadaval and L. Pinto, Preparation of bionanoparticles derived from Spirulina platensis and its application for Cr (VI) removal from aqueous solutions, J. Ind. Eng. Chem., 2012, 18, 1925–1930 CrossRef CAS.
- I. A. Wonnie Ma, S. Ammar, S. Bashir, M. Selvaraj, M. A. Assiri, K. Ramesh and S. Ramesh, Preparation of Hybrid Chitosan/Silica Composites Via Ionotropic Gelation and Its Electrochemical Impedance Studies, Prog. Org. Coat., 2020, 145, 105679 CrossRef CAS.
- J. Diosa, F. Guzman, C. Bernal and M. Mesa, Formation mechanisms of chitosan-silica hybrid materials and its performance as solid support for KR-12 peptide adsorption: Impact on KR-12 antimicrobial activity and proteolytic stability, J. Mater. Res. Technol., 2020, 9, 890–901 CrossRef CAS.
- M. Jabli, Synthesis, characterization, and assessment of cationic and anionic dye adsorption performance of functionalized silica immobilized chitosan bio-polymer, Int. J. Biol. Macromol., 2020, 153, 305–316 CrossRef CAS PubMed.
- Y. Ide, N. Ochi and M. Ogawa, Effective and selective adsorption of Zn2+ from seawater on a layered silicate, Angew. Chem., Int. Ed., 2011, 50, 654–656 CrossRef CAS PubMed.
- A. Dąbrowski, Adsorption—from theory to practice, Adv. Colloid Interface Sci., 2001, 93, 135–224 CrossRef.
- A. Dada, A. Olalekan, A. Olatunya and O. Dada, Langmuir, Freundlich, Temkin and Dubinin–Radushkevich isotherms studies of equilibrium sorption of Zn2+ unto phosphoric acid modified rice husk, IOSR J. Appl. Chem., 2012, 3, 38–45 CrossRef.
- A. Günay, E. Arslankaya and I. Tosun, Lead removal from aqueous solution by natural and pretreated clinoptilolite: adsorption equilibrium and kinetics, J. Hazard. Mater., 2007, 146, 362–371 CrossRef PubMed.
- Y.-S. Ho and G. McKay, Pseudo-second order model for sorption processes, Process Biochem., 1999, 34, 451–465 CrossRef CAS.
- Y. Wang, C. Peng, E. Padilla-Ortega, A. Robledo-Cabrera and A. López-Valdivieso, Cr(VI) adsorption on activated carbon: mechanisms, modeling and limitations in water treatment, J. Environ. Chem. Eng., 2020, 104031 CrossRef CAS.
- Z. Ceylan, D. Mustafaoglu and E. Malkoc, Adsorption of phenol by MMT-CTAB and WPT-CTAB: Equilibrium, kinetic, and thermodynamic study, Part. Sci. Technol., 2018, 36, 716–726 CrossRef CAS.
- A. Meniai, The use of sawdust as by product adsorbent of organic pollutant from wastewater: adsorption of phenol, Energy Procedia, 2012, 18, 905–914 CrossRef.
- H. Daraei, A. Mittal, M. Noorisepehr and F. Daraei, Kinetic and equilibrium studies of adsorptive removal of phenol onto eggshell waste, Environ. Sci. Pollut. Res., 2013, 20, 4603–4611 CrossRef CAS PubMed.
- S. Tural, M. Ş. Ece and B. Tural, Synthesis of novel magnetic nano-sorbent functionalized with N-methyl-D-glucamine by click chemistry and removal of boron with magnetic separation method, Ecotoxicol. Environ. Saf., 2018, 162, 245–252 CrossRef CAS PubMed.
- M. Djebbar, F. Djafri, M. Bouchekara and A. Djafri, Adsorption of phenol on natural clay, Appl. Water Sci., 2012, 2, 77–86 CrossRef CAS.
- T. A. Saleh, S. O. Adio, M. Asif and H. Dafalla, Statistical analysis of phenols adsorption on diethylenetriamine-modified activated carbon, J. Cleaner Prod., 2018, 182, 960–968 CrossRef CAS.
- P. L. Hariani, F. Fatma, F. Riyanti and H. Ratnasari, Adsorption of phenol pollutants from aqueous solution using Ca-Bentonite/Chitosan composite, Jurnal Manusia dan Lingkungan, 2015, 22, 233–239 CrossRef.
- Q. Y. Chen, J. B. Xiao, X. Q. Chen, X. Y. Jiang, H. Z. Yu and M. Xu, The adsorption of phenol, m-cresol and m-catechol on
a β-cyclodextrin derivative-grafted chitosan and the removal of phenols from industrial wastewater, Adsorpt. Sci. Technol., 2006, 24, 547–558 CrossRef CAS.
- M. Salari, M. H. Dehghani, A. Azari, M. D. Motevalli, A. Shabanloo and I. Ali, High performance removal of phenol from aqueous solution by magnetic chitosan based on response surface methodology and genetic algorithm, J. Mol. Liq., 2019, 285, 146–157 CrossRef CAS.
|
| This journal is © The Royal Society of Chemistry 2020 |
Click here to see how this site uses Cookies. View our privacy policy here.  Open Access Article
 *c
*c


![[double bond, length as m-dash]](https://www.rsc.org/images/entities/char_e001.gif) O stretching mode, respectively. The peaks at 1150 and 900 cm−1 are associated with Si–O vibration, which corresponds to characteristic peaks of SiO2. Fig. 1B shows the FT-IR spectrum of CMCM-48. Besides the SiO2, two new peaks at 1600 and 1550 cm−1 correspond at the C–O stretching vibration of NHCO and the N–H bending of NH2; the large peak at 3440 cm−1 was triggered by simultaneous vibrations of O–H and N–H as the –NH2 absorption band moved to a lower value.
O stretching mode, respectively. The peaks at 1150 and 900 cm−1 are associated with Si–O vibration, which corresponds to characteristic peaks of SiO2. Fig. 1B shows the FT-IR spectrum of CMCM-48. Besides the SiO2, two new peaks at 1600 and 1550 cm−1 correspond at the C–O stretching vibration of NHCO and the N–H bending of NH2; the large peak at 3440 cm−1 was triggered by simultaneous vibrations of O–H and N–H as the –NH2 absorption band moved to a lower value.


![[thin space (1/6-em)]](https://www.rsc.org/images/entities/char_2009.gif)
![[thin space (1/6-em)]](https://www.rsc.org/images/entities/char_2009.gif)
![[thin space (1/6-em)]](https://www.rsc.org/images/entities/char_2009.gif)


![[thin space (1/6-em)]](https://www.rsc.org/images/entities/char_2009.gif) Qe = ln
Qe = ln![[thin space (1/6-em)]](https://www.rsc.org/images/entities/char_2009.gif) Qm − βε2
Qm − βε2


![[thin space (1/6-em)]](https://www.rsc.org/images/entities/char_2009.gif)


![[thin space (1/6-em)]](https://www.rsc.org/images/entities/char_2009.gif) :
:![[thin space (1/6-em)]](https://www.rsc.org/images/entities/char_2009.gif) water = 2
water = 2![[thin space (1/6-em)]](https://www.rsc.org/images/entities/char_2009.gif) :
:![[thin space (1/6-em)]](https://www.rsc.org/images/entities/char_2009.gif) 1). Fig. 15 shows that in six cycles, the removal rate of phenol (R%) gradually decreased from 92.94% to 48.13% for phenol solution. The large decrease of removal due to the loss of the associated adsorbent material during the repeated cycles. These results indicate that CMCM-48 adsorbent could perform effectively for reusability even after six cycles.
1). Fig. 15 shows that in six cycles, the removal rate of phenol (R%) gradually decreased from 92.94% to 48.13% for phenol solution. The large decrease of removal due to the loss of the associated adsorbent material during the repeated cycles. These results indicate that CMCM-48 adsorbent could perform effectively for reusability even after six cycles.


