 Open Access Article
CuO and CeO2 assisted Fe2O3/attapulgite catalyst for heterogeneous Fenton-like oxidation of methylene blue
Ting Zhang *a,
Lingyu Donga,
Jianhua Dub,
Chunyuan Qiana and
Yi Wanga
aDepartment of Petrochemical Engineering, Lanzhou University of Technology, Lanzhou, P. R. China. E-mail: zhangting@lut.edu.cn
bGlobal Center of Environmental Remediation, University of Newcastle, NSW 2308, Australia
First published on 19th June 2020
Abstract
In this paper, CuO and CeO2 were screened as co-catalyst components for Fe2O3/attapulgite (ATP) catalyst, and three new catalysts (CuO–Fe2O3/ATP, CeO2–Fe2O3/ATP and CuO–CeO2–Fe2O3/ATP) were prepared for degradation of methylene blue (MB). The three catalysts' characteristics were determined by BET, XRD, FT-IR, SEM and XPS. MB degradation in different systems and at different pH values was also studied. Under the conditions of H2O2 concentration of 4.9 mmol L−1, catalyst dosage of 5 g L−1, pH of 5, reaction temperature of 60 °C and MB initial concentration of 100 mg L−1, the as-synthesized catalysts showed much greater reaction rate and degradation efficiency of MB than Fe2O3/ATP catalyst. In addition, the reusability of the as-prepared composites was evaluated. The intermediate products of MB degradation were identified by LC-MS and the possible degradation process of MB was put forward.
Introduction
With the rapid development of industry and agriculture, more and more organics, especially refractory organics, have been synthesized and used. As a result, more and more wastewater containing organics has been discharged into water in the environment and caused serious pollution. Methylene blue (MB), a common cationic dye, with a molecular weight of 373.90, is frequently used in textile, cosmetic and pharmaceutical industries. MB can cause permanent injury to humans and animals on inhalation and ingestion, and the risk of the presence of this dye in water may include a burning effect of the eye, nausea, vomiting and diarrhea.1 Many techniques can be applied to refractory organics removal: photocatalysis,2 biological treatment,3 adsorption,4 ozonation,5 photolysis,6 Fenton7,8 and Fenton-like processes.9–11 Among these techniques, heterogeneous Fenton reaction has become a research focus for its reusability, no secondary pollutants and wide pH range.12–20 UV light,12 electricity14 and ultrasonic treatment15 are often used as an assistant in heterogeneous Fenton reaction in degrading organics.Attapulgite (ATP) is a kind of mixed mineral material with two-dimensional layered and rod-like structure containing water and rich magnesium aluminate. Due to its advantages of low cost, abundant reserves, high mechanical strength, good chemical stability, strong practicability, high exchange capacity and environmental friendly, it can be used in many fields like adsorbents, catalysts or doped materials for the preparation of composites, which has attracted extensive attention of researchers.21–24 In ATP applications, employing ATP as catalyst base has been made a great progress. For examples, Zhao et al.25,26 prepared silver and copper modified ATP/TiO2 photocatalysts by a hydrolysis method for the degradation of methylene blue. Zhang et al.27 obtained ATP/SnO2–TiO2 via an in situ sol–gel method and investigated its photocatalytic removal ability of the methyl orange under ultraviolet radiation. Li et al.28 prepared ATP/Ce1−xZrxO2 nanocomposite as catalyst for the degradation of methylene blue. Attapulgite can be used as a carrier alone or in combination with other materials.29–31 Metal oxides (Fe2O3, ZnO, CuO, etc.) can be employed as active components, which have similar catalytic effects to Fe2+ or Cu2+. We have investigated the degradation of sodium dodecyl benzene sulfonate (SDBS) and methylene blue in solution with Fe2O3/attapulgite catalyst and the results demonstrated that Fe2O3/attapulgite has good abilities of catalysis and degradation of SDBS and MB.29,32,33 Considering the interaction between different catalytic active components can change the catalytic activity of the catalysts, two or more metal oxides are often used to prepare multi-active components catalysts.34,35
The purpose of this work is to screen metal oxides as co-catalysis components for Fe2O3/ATP, and the assistant-catalytic degradation properties of screened metal oxides were studied.
Experimental
Materials
Ferric nitrate (Fe(NO3)3·9H2O), copper nitrate (Cu(NO3)2·3H2O), H2O2(30% w/w), methylene blue (MB, C16H18ClN3S·3H2O), sodium hydroxide (NaOH), sulfuric acid (H2SO4), hydrochloric acid (HCl) were supplied by chemical reagent companies and all of them were analytical grade. Attapulgite clay (ATP) was produced from Xuyi, Jiangsu, with the chemical contents of SiO2 57.006%, TiO2 0.893%, Al2O3 8.583%, Fe2O3 4.641%, SO3 0.007%, MnO2 0.034%, MgO 8.456%, CaO 0.216%, K2O 0.094%, and Na2O 0.948%, and no further purification is carried out during the experiments. Distilled water used throughout the experiments was self-made by our laboratory.Preparation of ATP-based catalysts
20 g ATP clay was mixed with 1 mol L−1 HCl with magnetic stirring for 1 hour, then ATP was separated by filtration and dry at 105 °C for 2 hours. The dried ATP was ground, sieved and calcined at 600 °C for 2 hours to obtain purified ATP clay powder as catalyst carrier. Weigh a certain Fe(NO3)3·9H2O and other metal salts (such as Cu(NO3)2·3H2O, Ce(NO3)3·6H2O, Ni(NO3)2, Co(NO3)2·6H2O, etc.), and mix them at a certain ratio. The mixture of the metal salts were dissolved in 195 mL of water, and the purified ATP clay was put into the metal salts solution, sonicated for 30 min and separated by filtration. Then the samples were dried at 110 °C for 2 hours, and calcined at 300 °C for 2 hours to obtain metal oxides assisted Fe2O3/ATP catalysts. The diameter of the catalysts is about 70 μm.| Samples | Assistant components | Mass ratio of metal salts | |
|---|---|---|---|
| a Cu(s) means Cu(NO3)2·3H2O, Fe(s) means Fe(NO3)3·9H2O and Ce(s) means Ce(NO3)3·6H2O. | |||
| SA1-1 | CuO | Cu(s)![[thin space (1/6-em)]](https://www.rsc.org/images/entities/char_2009.gif) : :![[thin space (1/6-em)]](https://www.rsc.org/images/entities/char_2009.gif) Fe(s) Fe(s) |
0.3![[thin space (1/6-em)]](https://www.rsc.org/images/entities/char_2009.gif) : :![[thin space (1/6-em)]](https://www.rsc.org/images/entities/char_2009.gif) 4.7 4.7 |
| SA1-2 | 0.5![[thin space (1/6-em)]](https://www.rsc.org/images/entities/char_2009.gif) : :![[thin space (1/6-em)]](https://www.rsc.org/images/entities/char_2009.gif) 4.5 4.5 |
||
| SA1-3 | 0.7![[thin space (1/6-em)]](https://www.rsc.org/images/entities/char_2009.gif) : :![[thin space (1/6-em)]](https://www.rsc.org/images/entities/char_2009.gif) 4.3 4.3 |
||
| SA1-4 | 1.0![[thin space (1/6-em)]](https://www.rsc.org/images/entities/char_2009.gif) : :![[thin space (1/6-em)]](https://www.rsc.org/images/entities/char_2009.gif) 4.0 4.0 |
||
| SA1-5 | 1.5![[thin space (1/6-em)]](https://www.rsc.org/images/entities/char_2009.gif) : :![[thin space (1/6-em)]](https://www.rsc.org/images/entities/char_2009.gif) 3.5 3.5 |
||
| SA2-1 | CeO2 | Ce(s)![[thin space (1/6-em)]](https://www.rsc.org/images/entities/char_2009.gif) : :![[thin space (1/6-em)]](https://www.rsc.org/images/entities/char_2009.gif) Fe(s) Fe(s) |
0.3![[thin space (1/6-em)]](https://www.rsc.org/images/entities/char_2009.gif) : :![[thin space (1/6-em)]](https://www.rsc.org/images/entities/char_2009.gif) 4.7 4.7 |
| SA2-2 | 0.5![[thin space (1/6-em)]](https://www.rsc.org/images/entities/char_2009.gif) : :![[thin space (1/6-em)]](https://www.rsc.org/images/entities/char_2009.gif) 4.5 4.5 |
||
| SA2-3 | 0.7![[thin space (1/6-em)]](https://www.rsc.org/images/entities/char_2009.gif) : :![[thin space (1/6-em)]](https://www.rsc.org/images/entities/char_2009.gif) 4.3 4.3 |
||
| SA2-4 | 1.0![[thin space (1/6-em)]](https://www.rsc.org/images/entities/char_2009.gif) : :![[thin space (1/6-em)]](https://www.rsc.org/images/entities/char_2009.gif) 4.0 4.0 |
||
| SA2-5 | 1.5![[thin space (1/6-em)]](https://www.rsc.org/images/entities/char_2009.gif) : :![[thin space (1/6-em)]](https://www.rsc.org/images/entities/char_2009.gif) 3.5 3.5 |
||
| SA3-1 | CuO–CeO2 | Cu(s)![[thin space (1/6-em)]](https://www.rsc.org/images/entities/char_2009.gif) : :![[thin space (1/6-em)]](https://www.rsc.org/images/entities/char_2009.gif) Ce(s) Ce(s)![[thin space (1/6-em)]](https://www.rsc.org/images/entities/char_2009.gif) : :![[thin space (1/6-em)]](https://www.rsc.org/images/entities/char_2009.gif) Fe(s) Fe(s) |
0.5![[thin space (1/6-em)]](https://www.rsc.org/images/entities/char_2009.gif) : :![[thin space (1/6-em)]](https://www.rsc.org/images/entities/char_2009.gif) 0.5 0.5![[thin space (1/6-em)]](https://www.rsc.org/images/entities/char_2009.gif) : :![[thin space (1/6-em)]](https://www.rsc.org/images/entities/char_2009.gif) 4.0 4.0 |
| SA3-2 | 0.7![[thin space (1/6-em)]](https://www.rsc.org/images/entities/char_2009.gif) : :![[thin space (1/6-em)]](https://www.rsc.org/images/entities/char_2009.gif) 0.3 0.3![[thin space (1/6-em)]](https://www.rsc.org/images/entities/char_2009.gif) : :![[thin space (1/6-em)]](https://www.rsc.org/images/entities/char_2009.gif) 4.0 4.0 |
||
| SA3-3 | 0.3![[thin space (1/6-em)]](https://www.rsc.org/images/entities/char_2009.gif) : :![[thin space (1/6-em)]](https://www.rsc.org/images/entities/char_2009.gif) 0.7 0.7![[thin space (1/6-em)]](https://www.rsc.org/images/entities/char_2009.gif) : :![[thin space (1/6-em)]](https://www.rsc.org/images/entities/char_2009.gif) 4.0 4.0 |
||
| SA3-4 | 0.5![[thin space (1/6-em)]](https://www.rsc.org/images/entities/char_2009.gif) : :![[thin space (1/6-em)]](https://www.rsc.org/images/entities/char_2009.gif) 1.0 1.0![[thin space (1/6-em)]](https://www.rsc.org/images/entities/char_2009.gif) : :![[thin space (1/6-em)]](https://www.rsc.org/images/entities/char_2009.gif) 3.5 3.5 |
||
| SA3-5 | 1.0![[thin space (1/6-em)]](https://www.rsc.org/images/entities/char_2009.gif) : :![[thin space (1/6-em)]](https://www.rsc.org/images/entities/char_2009.gif) 0.5 0.5![[thin space (1/6-em)]](https://www.rsc.org/images/entities/char_2009.gif) : :![[thin space (1/6-em)]](https://www.rsc.org/images/entities/char_2009.gif) 3.5 3.5 |
||
Characterization
The N2 adsorption isotherm of the sample was measured at −196 °C using an ASAP 2010 type specific surface area measuring instrument manufactured by Micromiritcs (USA), and the specific surface area, pore volume and pore diameter were calculated by the BET equation. The apparent morphology of the catalyst was observed by JSM-5500 scanning electron microscopy (SEM). The acceleration voltage was 20 kV, and the surface of the catalyst was treated by Pt. Each sample before degradation was tested using a Nicolet AVTAR 360 FT-IR infrared spectrometer with a scan range of 4500 cm−1 to 400 cm−1. The crystal form was identified using a Panalytical X'Pert PRO XRD instrument with operating voltages and currents of 40 kV and 150 mA, diffraction angles of 5° to 80°, and scanning steps of 0.02° s−1.The intermediate products of aromatic ring were determined by HPLC-MS, which is performed by an Agilent 1200 high performance liquid chromatography and a 6130 quadrupole mass spectrometer. The column used for separation is a ZORBAX Eclipse XDB-C18 column (5 μm, 4.6 × 150 mm). The mobile phase is a mixture of methanol and formic acid (40/60, V/V), with a flow rate of 0.5 mL min−1, an injection volume of 20 μL and a chamber temperature of 30 °C. The mass spectrometer detector operates with selective ion monitoring (SIM) at the negative electrode. The operating conditions are: debris guidance of 90, dry gas flow rate of 12 L min−1, sprayer pressure 45 of lb sq−1, dry gas temperature of 300 °C, steam temperature of 150 °C, capillary voltage of 2500 V, corona current of 4 μA and voltage of 2000 V.
Experimental methods
1 g L−1 MB stock solution was prepared using distilled water for dilution to the concentration required for subsequent experiments. 180 mL of distilled water and 20 mL of MB stock solution (1 g L−1) were placed in an Erlenmeyer flask to obtain 200 mL of a 100 mg L−1 MB solution. The pH was adjusted with sulfuric acid (1![[thin space (1/6-em)]](https://www.rsc.org/images/entities/char_2009.gif) :
:![[thin space (1/6-em)]](https://www.rsc.org/images/entities/char_2009.gif) 9) and the Erlenmeyer flask was placed in a water bath thermostat. Add a certain amount of catalysts and hydrogen peroxide to the Erlenmeyer flask, turn on the shaker at 120 rpm for 100 min, and start timing. The supernatant was taken every 10 min to measure the absorbance, and the absorbance of the MB solution was measured by UV-1900 ultraviolet-visible spectrophotometer at λ = 664 nm. The degradation ratio of the MB solution can be calculated by the following formula:
9) and the Erlenmeyer flask was placed in a water bath thermostat. Add a certain amount of catalysts and hydrogen peroxide to the Erlenmeyer flask, turn on the shaker at 120 rpm for 100 min, and start timing. The supernatant was taken every 10 min to measure the absorbance, and the absorbance of the MB solution was measured by UV-1900 ultraviolet-visible spectrophotometer at λ = 664 nm. The degradation ratio of the MB solution can be calculated by the following formula:
 | (1) |
Measurement of ·OH concentration
·OH will react with salicylic acid to produce a chemical substance called 2,3-dihydroxybenzoic acid with maximum absorption peak at the wavelength of 510 nm. So ·OH can be measured by following method: 100 mL salicylic acid standard solution was placed in a 250 mL conical flask, after adding 1 g L−1 as-synthesized catalysts and 0.1 mL 30% (w/w) H2O2, the conical bottle was placed in water bath under 60 °C. Every 10 minutes the ·OH concentration of the solution was measured by UV-1900 ultraviolet-visible spectrophotometer at λ of 510 nm.Results and discussion
Screening of co-catalyst components
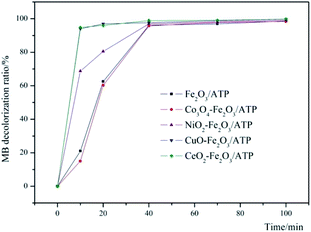
In order to make sure which metal oxide has the synergistic effect with Fe2O3/ATP, four metal oxide precursors were chosen to corporate with Fe2O3/ATP and their co-catalysis properties were studied. The experimental conditions are: catalyst dosage of 5 g L−1, H2O2 concentration of 4.9 mmol L−1, pH value of 5, reaction temperature of 60 °C and MB initial concentration of 100 mg L−1. The results can be seen in Fig. 1. Except Co3O4, the other tested metal oxides all had assist-catalytic effect to Fe2O3/ATP catalyst according to the higher decolorization ratios of MB by co-catalysts than that by only Fe2O3/ATP. CuO and CeO2 presented excellent assist-catalytic performances and the MB decolorization ratios can reach over 95% within 10 min reaction when catalyzing by CuO–Fe2O3/ATP or CeO2–Fe2O3/ATP. All catalysts had close and almost same decolorization ratios of MB within 70 min and 100 min reaction, which were over 97% and over 99% respectively. The decolorization ratios of MB by CuO–Fe2O3/ATP and CeO2–Fe2O3/ATP can reach 99.72% and 99.75% respectively within 100 min reaction. Compared with Fe2O3/ATP catalyst, CuO–Fe2O3/ATP and CeO2–Fe2O3/ATP expressed excellent catalytic performances during the early stage of the reaction (0–30 min), indicating that the co-catalytic effect of CuO and CeO2 is to drastically enhance the catalytic reacting rate.Optimization of catalysts preparation
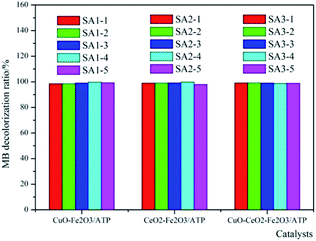
According to Fig. 1, CuO and CeO2 were chosen as assistant components of Fe2O3/ATP. That means, Cu(NO3)2·3H2O and Ce(NO3)3·6H2O were used as precursors to prepare the co-catalysts. In order to make sure preparing catalysts at which proportion of the precursors can get the high catalytic efficiency, different mass ratios of metal salts were employed to prepare the catalysts, as can be seen in Table 1.The co-effects of CuO or CeO2 with Fe2O3/ATP on their catalytic performances are studied and the results were shown in Fig. 2. The MB decolorization experiments were carried out at different mass ratios of metal salts on the ATP support. As can be seen from Fig. 2, the proportion of precursors did not heavily affect the catalytic performances of the catalysts, and the decolorization ratios are almost the same at different mass ratios of metal salts on the ATP support. The results show that the catalysts of CuO–Fe2O3/ATP and CeO2–Fe2O3/ATP had better catalytic performance when the proportion of the assistant precursor component to the total-active components of catalyst is 1![[thin space (1/6-em)]](https://www.rsc.org/images/entities/char_2009.gif) :
:![[thin space (1/6-em)]](https://www.rsc.org/images/entities/char_2009.gif) 5, while the different proportions in CuO–CeO2–Fe2O3/ATP made almost no difference in MB decolorization. Under optimum preparation conditions, the degradation ratios of MB by CuO–Fe2O3/ATP and CeO2–Fe2O3/ATP and CuO–CeO2–Fe2O3/ATP were 99.71%, 99.73% and 99.11%, separately.
5, while the different proportions in CuO–CeO2–Fe2O3/ATP made almost no difference in MB decolorization. Under optimum preparation conditions, the degradation ratios of MB by CuO–Fe2O3/ATP and CeO2–Fe2O3/ATP and CuO–CeO2–Fe2O3/ATP were 99.71%, 99.73% and 99.11%, separately.
Characterization
Table 2 is the BET measurement results of catalysts samples. As can be seen that the BET surface areas of CuO–Fe2O3/ATP, CeO2–Fe2O3/ATP and CuO–CeO2–Fe2O3/ATP are all high than ATP, which means that introducing metal oxides to ATP can enhance the surface area of ATP and the metal oxides can act as the upholders between ATP rod-shaped particles. The BET surface areas of CuO–Fe2O3/ATP and CeO2–Fe2O3/ATP are almost the same, while CuO–CeO2–Fe2O3/ATP has higher surface area than the two catalysts above.| Samples | BET surface area (m2 g−1) | Total pore volume (cm3 g−1) | Average pore diameter (nm) |
|---|---|---|---|
| CuO–Fe2O3/ATP | 127.65 | 9.13 | 0.34 |
| CeO2–Fe2O3/ATP | 121.57 | 9.58 | 0.29 |
| CuO–CeO2–Fe2O3/ATP | 150.83 | 9.38 | 0.35 |
| ATP | 114.50 | 8.29 | 0.24 |
Nitrogen adsorption–desorption isotherms were measured to determine the specific surface area and pore structure of these four samples, as shown in Fig. 3. The adsorption–desorption curves of the four samples show type II isotherms according to IUPAC classification, representing their microporous structure, which is in accordance with the characteristic result of SEM images. Both of samples clearly show H3 hysteresis loops indicating material with flaky granules or slotted pores, and there is no adsorption limit in the region of high relative pressure. After coated by metal oxides, the samples have higher adsorption capacity than ATP, and their pore sizes become smaller (1.0–170 nm of CuO–Fe2O3/ATP, 1.9–190 nm of CeO2–Fe2O3/ATP, 2.0–140 nm of CuO–CeO2–Fe2O3/ATP) compared with those of ATP (1.9–232 nm), which also is in accordance with the characteristic results of SEM images.
 | ||
| Fig. 3 Nitrogen adsorption–desorption isotherms and pore-size distribution curves of (a) CuO–Fe2O3/ATP, (b) CeO2–Fe2O3/ATP, (c) CuO–CeO2–Fe2O3/ATP and (d) ATP. | ||
SEM micrographs were collected to illustrate the morphologies of ATP and as-prepared catalysts samples, as depicted in Fig. 4. Rod-shaped particles with lengths of 500–700 nm and widths of 100–150 nm are visible in Fig. 4a. After the introduction of iron and copper or cerium species into ATP, nano-Fe2O3 and CuO or CeO2 particles with diameters ranging from 10–50 nm were stuck to the surface of ATP according to the Fig. 4b–d. The Fe2O3 and CuO or CeO2 particles were not very clearly distinguished from the SEM images; however, metal oxide nanoparticles were well dispersed on ATP particles as circled in TEM images. The elemental composition of the as-synthesized CuO–Fe2O3/ATP, CeO2–Fe2O3/ATP and CuO–CeO2–Fe2O3/ATP composites from energy dispersive spectrometry (EDS) (Fig. 4e–g) stated that the composites contained Cu, Fe and Ce.
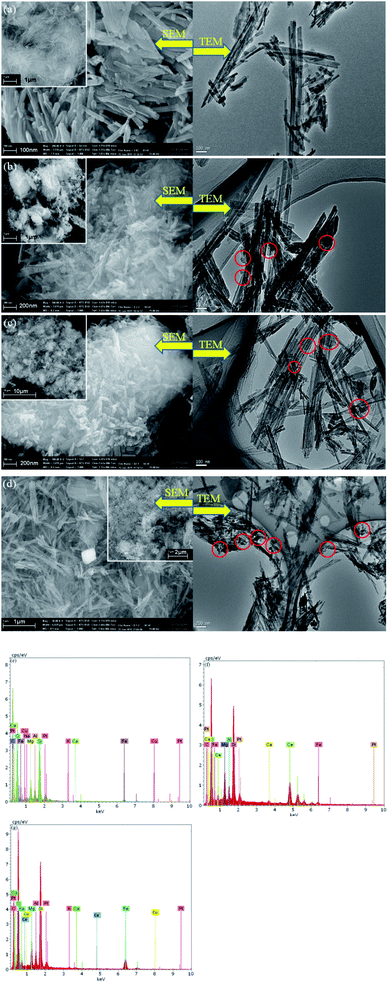 | ||
| Fig. 4 SEM and TEM micrographs of (a)ATP, (b) CuO–Fe2O3/ATP, (c) CeO2–Fe2O3/ATP and (d) CuO–CeO2–Fe2O3/ATP; EDS of (e) CuO–Fe2O3/ATP, (f) CeO2–Fe2O3/ATP and (g) CuO–CeO2–Fe2O3/ATP. | ||
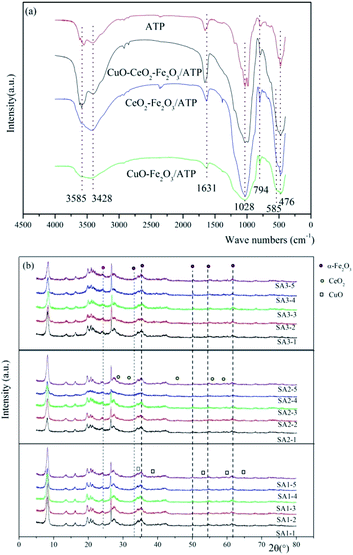
The FT-IR results of ATP, CuO–Fe2O3/ATP, CeO2–Fe2O3/ATP and CuO–CeO2–Fe2O3/ATP can be seen in Fig. 5a. The strong wide absorption bands appeared at 3420 cm−1 associated with the surface hydroxyl groups. The weak sharp absorption bands at 1630 cm−1 is flexural vibrations of water H–O–H. The strong wide absorption bands at 1040 cm−1 is dissymmetry stretching vibrations of Si–O–Si, and the absorption bands at 777 cm−1 and 476 cm−1 are symmetry stretching and flexural vibrations of Si–O.36 Some peaks were observed at lower wave numbers (480 cm−1 and 565 cm−1) corresponding to vibration modes of Fe–O bonds of Fe2O3 nanoparticles on the surface of ATP.37 Absorption bands of Cu–O and Ce–O bonds cannot be seen in Fig. 5a due to the low loading deposition level.
Fig. 5b shows the wide-angle XRD diffractions of as-synthesized CuO–Fe2O3/ATP, CeO2–Fe2O3/ATP and CuO–CeO2–Fe2O3/ATP composites. The diffraction peak at 2θ = 8.2° was assigned to attapugite.36 The diffraction peak at 26.5° was assigned to quartz and the peaks at 19–22° belonged to kaolinite and quartz, which are all the impurities of attapulgite clay.36 The diffraction peaks at 2θ = 24.1, 33.1, 40.8, 49.4, 54, and 62.4° were assigned to α-Fe2O3 (JCPDS data: 89-596),38 the diffraction peaks at 2θ = 35.6, 38.7, 53.5, 58.3 and 65.9° were assigned to CuO(PDF#80-1268),39 and the diffraction peaks at 2θ = 28.3, 32.5, 47.2, 56.1 and 59.0° were assigned to CeO2 (PDF #34-0394).40 XRD diffractions of SA1 showed crystallization of Fe2O3 and CuO, XRD diffractions of SA2 showed crystallization of Fe2O3 and CeO2, and XRD diffractions of SA3 showed crystallization of Fe2O3, CuO and CeO2. The intensity peaks of Fe2O3, CuO and CeO2 were all very low resulting from low loading deposition level, well dispersion, and poor crystalline with a small size of metal oxide particles in the composites.
The chemical states of metal elements in the three catalysts were studied by XPS analysis and their responding XPS characteristic spectrums are shown in Fig. 6. In comparison, the binding energies of C 1s and O 1s of the samples were almost no change, which reveals that the loading metal oxides did not affect the valent states of C and O (Fig. 6a). The survey spectra of the samples confirm that besides C and O, Fe were also present in these three samples, while Cu and Ce cannot be seen due to the low loading deposition level, which agree well with the explanation of XRD results. The peaks at 531 eV (Fig. 6b) in three samples were due to O 1s bonded to Fe (Cu, Ce) and Si, whereas the peaks at higher binding energy of 532.4 eV were ascribed to the presence of OH– group,41 indicating surface hydroxyl groups of ATP. The peaks at 285.7 eV, 286.2 eV and 286.8 eV (Fig. 6c) in three samples were due to C 1s bonded to H, N and O, which might be formed during the roasting of the samples. High resolution XPS spectrum of Fe 2p in Fig. 3d located at the binding energies of 713.6 eV and 726.8 eV were indicative of Fe 2p3/2 and Fe 2p1/2 of the oxidation state Fe3+ in three samples, respectively.42
 | ||
| Fig. 6 XPS spectra of (a) full spectra, (b) O 2p spectra, (c) C 1s spectra, and (d) Fe 2p spectra of three samples. | ||
Degradation of methylene blue
In order to determine the catalytic degradation performance of these three heterogeneous catalysts, comparison experiments were carried out to treat MB dye wastewater in the presence of (i) only H2O2 with the reaction conditions of H2O2 concentration 4.9 mmol L−1, pH 5, reaction temperature 60 °C and MB initial concentration 100 mg L−1, (ii) catalyst only (CuO–Fe2O3/ATP, CeO2–Fe2O3/ATP or CuO–CeO2–Fe2O3/ATP) with the reaction conditions of catalyst dosage 5 g L−1, pH 5, reaction temperature 60 °C and MB initial concentration 100 mg L−1, and (iii)both catalyst and H2O2 with the reaction conditions of H2O2 concentration 4.9 mmol L−1, catalyst dosage 5 g L−1, pH 5, reaction temperature 60 °C and MB initial concentration 100 mg L−1. The results were shown in Fig. 7a. It can be seen that when only H2O2 is present in the system, the degradation ratio of MB is relatively low, which showed that MB can be oxidized and degraded by H2O2 but the efficiency is not very high. When the system only contains one of the catalysts, the decolorization ratio of MB can reach around 60% due to the adsorptive ability or the catalytic reaction occurring on catalysts with light and oxygen. And it also can be seen that CuO–Fe2O3/ATP has higher adsorption performance than CeO2–Fe2O3/ATP or CuO–CeO2–Fe2O3/ATP, which can be explained by the fact that Ce has larger atom size and more positive charge than Cu and Fe, so it has larger repulsive interaction than Cu and Fe when ATP adsorbing the cationic dye methylene blue. When both catalysts and H2O2 were all present in MB containing solution, over 90% decolorization ratios of MB can be obtained within 10 min reaction. Especially in CuO–Fe2O3/ATP/H2O2 and CuO–CeO2–Fe2O3/ATP/H2O2 systems, the decolorization ratio of MB reached 95% within 10 min reaction, which means CuO has the better co-catalysis performance than CeO2, and CuO and CeO2 have a synergy in assistant-catalysis of the CuO–CeO2–Fe2O3/ATP catalyst.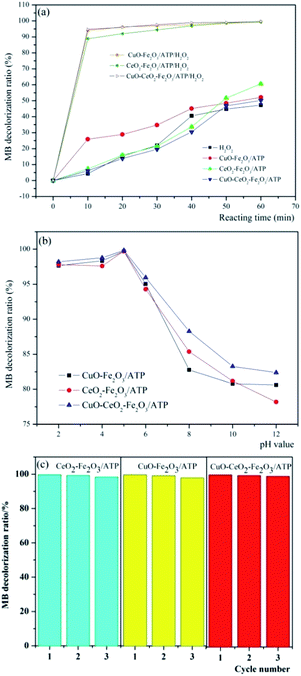 | ||
| Fig. 7 Decolorization of MB by (a) different systems and (b) three catalysts with H2O2 at different pH value, and (c) the reusability of catalysts. | ||
Compared with other conditions, pH value plays an important role in catalytic degradation of MB. The decolorization of MB in aqueous solution in the presence of three different catalysts was studied in the pH range between 2 and 12. Fig. 7b shows the decolorization efficiencies of MB after 60 min at different pH values with an initial solution containing 100 mg L−1 MB, 5 g L−1 catalyst and 4.9 mmol L−1 H2O2. Almost complete decolorization ratios were achieved at pH 5 (99.76%, 99.73% and 99.83% of CuO–Fe2O3/ATP, CeO2–Fe2O3/ATP and CuO–CeO2–Fe2O3/ATP respectively). The stability of H2O2 was dependent on pH value. H2O2 seldom decomposed at acidic pH, and most of the H2O2 was transformed to OH radicals when catalyzed by the catalysts. At alkaline pH conditions, a lot of H2O2 decomposed to H2O and O2 and only a small part of H2O2 was catalysed and produced OH radicals.33 And the oxidation potential of OH radicals was shown to be lower in alkaline than in acidic conditions.43
Three times repeated decolorization experiments were performed to test the stability of these three catalysts (Fig. 7c). After each decolorization experiment, the catalyst will be filtered and washed by distilled water to ensure recycling. After the first run, the decolorization efficiencies of MB were all over 99% in three heterogeneous Fenton systems. In subsequent runs, the decolorization efficiencies just decreased a little. At the end of the third runs, the efficiencies were still as high as 98%. The experiments showed that catalyst Fe2O3/ATP did not lose its catalytic function (active Fe2O3 or CuO or CeO2) from the catalyst surface after several runs, which is suitable for practical application.
Mechanism of the degradation of MB
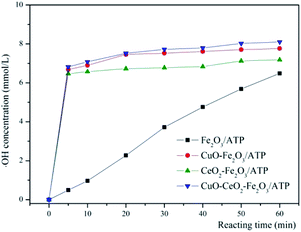
In literatures, the processes of degrading organic matters by heterogeneous Fenton systems often were interpreted by conforming to the theory of free radicals, that is to say, the organics degradation process is mainly based on the oxidation of ·OH.44–48 In order to prove the degradation of MB processes by these catalysts belonging to heterogeneous Fenton reactions, the ·OH trapping experiments were also carried out to prove that MB degradation reaction is a heterogeneous Fenton process. The ·OH trapping experiments were conducted under the optimized condition of pH 5, reaction temperature 60 °C, catalysts dosage 5 g L−1, and H2O2 concentration 4.9 mmol L−1. The ·OH concentration produced in the reaction at different times were measured, shown in Fig. 8. As can be seen that with the reaction time increased, the ·OH concentration increased accordingly, and the ·OH concentrations of CuO–Fe2O3/ATP/H2O2, CeO2–Fe2O3/ATP/H2O2 and CuO–CeO2–Fe2O3/ATP/H2O2 systems were much higher than that of Fe2O3/ATP/H2O2 system, which were according with the results of Fig. 7a and explained the excellent MB decolorization performances of the former three systems.The intermediate products of MB degradation were identified by LC-MS after 100 min catalytic reaction by CuO–CeO2–Fe2O3/ATP/H2O2 system. The main identified products were benzoquinone ([M – H]-m/z 107, RT 3.161 min), hydroquinone ([M – H]-m/z 109, RT 3.098 min), catechol ([M − H]-m/z 109, RT 3.308 min), resorcinol ([M − H]-m/z 109, RT 5.098 min).
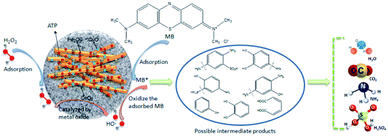
According to the identified main aromatic intermediate products, the possible degradation process of MB in CuO–CeO2–Fe2O3/ATP/H2O2 catalytic system, for example, was shown in Fig. 9. Firstly, H2O2 was adsorbed by the catalyst and decomposed on the surface of it and generated ·OH radicals, then ·OH radicals attacked the –S![[double bond, length as m-dash]](https://www.rsc.org/images/entities/char_e001.gif) bond and –N
bond and –N![[double bond, length as m-dash]](https://www.rsc.org/images/entities/char_e001.gif) bond of MB, splitting the macromolecular MB into two parts. The second step was that ·OH radicals oxidized the products into phenol, diphenol and other products. Because of the presence of electron donor –OH on the benzene ring, phenol and diphenol are particularly conducive to the electrophilic attack of ·OH, especially in the presence of –OH on the ortho and para positions. Phenol can be oxidized to hydroquinone, catechol, resorcinol and so on. Diphenol can be oxidized to benzoquinone quickly. In the third step, the intermediate products of aromatic ring were further oxidized by ·OH to short chain carboxylic acids such as fumaric acid, oxalic acid, formic acid, etc., which can be quickly degraded to CO2 and H2O.
bond of MB, splitting the macromolecular MB into two parts. The second step was that ·OH radicals oxidized the products into phenol, diphenol and other products. Because of the presence of electron donor –OH on the benzene ring, phenol and diphenol are particularly conducive to the electrophilic attack of ·OH, especially in the presence of –OH on the ortho and para positions. Phenol can be oxidized to hydroquinone, catechol, resorcinol and so on. Diphenol can be oxidized to benzoquinone quickly. In the third step, the intermediate products of aromatic ring were further oxidized by ·OH to short chain carboxylic acids such as fumaric acid, oxalic acid, formic acid, etc., which can be quickly degraded to CO2 and H2O.
The degradation of MB by as-synthesis catalyst compared with other catalysts
The catalytic performances of as-synthesized catalysts were compared with different catalysts from recent literatures.49–54 The reaction condition and degradation efficiency of these catalysts are listed in Table 3. Since each study evaluated the removal capacity under different conditions, direct comparison among catalysts is challenging, but the relative performance of these as-synthesized catalysts can be evaluated indirectly.| Catalysts | Optimal reaction conditions | η% | ||||||
|---|---|---|---|---|---|---|---|---|
| pH | C(H2O2)/mM | C (cat)/g L−1 | C (MB)/mg L−1 | T/°C | Time/min | V/mL | ||
| Fe3O4/TiO2 core/shell nanotubes49 | 3 | 8900 | 50 | 1870 | 25 | 5 | 1 | 99 |
| Fe(II)Fe(III)-LDHs50 | 3 | 0.01 | 1.0 | 10 | 25 | 60 | 100 | 100 |
| Fe3O4/MWCNTs carbon nanotubes51 | 3.5 | 10 | 0.5 | 74.78 | 25 | 30 | — | 99 |
| C–Fe2O3 (ref. 52) | — | 245 | 0.5 | 50 | 40 | 420 | 200 | 96 |
| NC-CuFe (ref. 53) | — | 245 | 0.5 | 50 | 40 | 180 | 200 | 97.4 |
| MgFeO4 (ref. 54) | 4 | 20 | 0.5 | 50 | 20 | 30 | 50 | 98 |
| CuO–CeO2–Fe2O3/ATP | 5 | 4.9 | 5 | 100 | 60 | 60 | 200 | 99.8 |
Table 3 shows the comparison of different heterogeneous Fenton catalysts for MB degradation. It can be seen that the Fe3O4/TiO2 core–shell nanotube catalyst49 can decolorize high MB pollutant concentration in a short time and reach a high decolorization ratio, but the concentration of H2O2 and catalyst used in the reaction is relatively high, and the volume of pollutant solution is very small. In Fe(II) Fe(III)-LDHs nanotubes/H2O2 system,50 it also can achieve a high decolorization ratio with relatively low concentration of H2O2 and catalyst due to its low MB concentration. Fe3O4/MWCNTs51 showed its good catalytic performance with small amount of catalyst and short reaction time. C–Fe2O3 (ref. 52) and NC-CuFe53 also have high MB degradation ratio at almost same condition, but the reaction time is very long (420 min and 180 min respectively). While the degradation efficiency of MB on CuO–CeO2–Fe2O3/ATP composite within 60 min was higher than that of Fe3O4/TiO2 core/shell nanotubes, and even Fe3O4/MWCNTs carbon nanotubes, C–Fe2O3, NC-CuFe and MgFeO4 (ref. 54) under visible light. The degradation efficiency was lower than that of Fe(II)Fe(III)-LDHs, but the reaction pH of CuO–CeO2–Fe2O3/ATP/H2O2 was not so harsh. Therefore, CuO–CeO2–Fe2O3/ATP composite prepared by the facile method is expected to reduce the cost of catalyst for large scale application.
Conclusions
In this study, two metal oxides, CuO and CeO2, were screened as co-catalyst components for Fe2O3/ATP, and three catalysts (CuO–Fe2O3/ATP, CeO2–Fe2O3/ATP and CuO–CeO2–Fe2O3/ATP) were prepared for degradation of a phenothiazine dye MB. The three catalysts samples were determined by BET, XRD, FT-IR, SEM and XPS. The characterization results showed that the doping two or three metal oxides on ATP did not change the surface morphology and some characteristics of ATP, for example the adsorption capacity, but dramatically promote their catalytic performances. CuO and CeO2 can be good co-catalysis components for Fe2O3/ATP catalyst; still they have synergy effect in CuO–CeO2–Fe2O3/ATP catalyst to degrade MB. MB degradation ratios at acid conditions were higher than that at alkaline conditions due to decomposing capacity of H2O2 at different pH value, and at pH 5, MB decolorization by the heterogeneous Fenton systems had the highest ratios. Under the optimum conditions, MB degradation ratios of the three systems (CuO–Fe2O3/ATP, CeO2–Fe2O3/ATP and CuO–CeO2–Fe2O3/ATP) can reach 99.76%, 99.73% and 99.83%, separately. The repeatable tests showed that the as-synthesized catalysts can be reused for many times, which meets the trend of low carbon lifestyle. The intermediate products of MB degradation were identified by LC-MS. According to the main identified products, the possible degradation process of MB in CuO–CeO2–Fe2O3/ATP/H2O2 catalytic system was put forward.Conflicts of interest
There are no conflicts to declare.Acknowledgements
This work was financially supported by the National Natural Science Foundation of China (Grant No. 51302123).References
- K. Vignesh, M. Rajarajan and A. Suganthi, J. Ind. Eng. Chem., 2014, 20, 3826 CrossRef CAS.
- C. T. Chekem, V. Goetz, Y. Richardson, G. Plantard and J. Blin, Catal. Today, 2019, 328, 183 CrossRef.
- E. Xenofontos, A. M. Tanase, I. Stoica and I. Vyrides, Bio Technol., 2016, 33, 305 CAS.
- J. Huang, J. Hazard. Mater., 2009, 168, 1028 CrossRef CAS PubMed.
- Y. Ji, Z. Pan, D. Yuan and B. Lai, Clean, 2018, 46, 1700666 Search PubMed.
- T. Zhang, L. Cheng, L. Ma, F. Meng, R. G. Arnold and A. E. Sáez, Chemosphere, 2016, 161, 349 CrossRef CAS PubMed.
- J. Xu, Y. Long and D. Shen, J. Hazard. Mater., 2017, 323, 674 CrossRef CAS PubMed.
- Z. Wu, F. J. Yuste-Córdoba, P. Cintas and Z. Wu, Ultrason. Sonochem., 2018, 40, 3 CrossRef CAS PubMed.
- G. R. Agladze, G. S. Tsurtsumia, B. I. Jung, J. S. Kim and G. Gorelishvili, J. Appl. Electrochem., 2007, 37, 985 CrossRef CAS.
- J. Liang, S. Komarov, N. Hayashi and E. Kasai, J. Mater. Cycles. Waste Manag, 2007, 9, 47 CrossRef CAS.
- M. Derakhshan and M. Fazeli, J. Biol. Eng., 2018, 12, 10 CrossRef PubMed.
- F. F. Dias, A. A. S. Oliveira and A. P. Arcanjo, Appl. Catal., B, 2016, 186, 136 CrossRef CAS.
- Y. Zhang, P. Wu and Z. Chen, Mater. Res. Bull., 2019, 113, 14 CrossRef CAS.
- M. Ghasemi, A. Khataee and P. Gholami, J. Environ. Manage., 2019, 248, 109236 CrossRef CAS PubMed.
- G. M. S. ElShafei, F. Z. Yehia, O. I. H. Dimitry and A. M. Badawi, Ultrason. Sonochem., 2014, 21, 1358 CrossRef CAS PubMed.
- L. Sun, Y. Yao and L. Wang, Chem. Eng. J., 2014, 240, 413 CrossRef CAS.
- M. L. Rache, A. R. García and H. R. Zea, Appl. Catal., B, 2014, 146, 192 CrossRef CAS.
- S. Fukuchi, R. Nishimoto, M. Fukushima and Q. Zhu, Appl. Catal., B, 2014, 147, 411 CrossRef CAS.
- N. Zhang, C. Xue, K. Wang and Z. Fang, Chem. Eng. J., 2020, 380, 122516 CrossRef CAS.
- S. Chen, Y. Wu and G. Li, Appl. Clay Sci., 2017, 136, 103 CrossRef CAS.
- X. Wu, W. Zhu, X. Zhang, T. Chen and R. L. Frost, Appl. Clay Sci., 2011, 52, 400 CrossRef CAS.
- Q. Fan, D. Shao, Y. Lu, W. Wu and X. Wang, Chem. Eng. J., 2009, 150, 188 CrossRef CAS.
- W. Wu, Q. Fan, J. Xu, Z. Niu and S. Lu, Appl. Radiat. Isot., 2007, 65, 1108 CrossRef CAS PubMed.
- J. Huang, X. Wang, Q. Jin, Y. Liu and Y. Wang, J. Environ. Manage., 2007, 84, 229 CrossRef CAS PubMed.
- D. F. Zhao, J. Zhou and N. Liu, Mater. Sci. Eng., 2006, 431, 256 CrossRef.
- D. F. Zhao, J. Zhou and N. Liu, Mater. Charact., 2007, 58, 249 CrossRef CAS.
- L. L. Zhang, F. J. Lv, W. G. Zhang, R. Q. Li, H. Zhong, Y. J. Zhao, Y. Zhang and X. J. Wang, Hazard Mater., 2009, 171, 294 CrossRef CAS PubMed.
- X. Li, C. Ni, C. Yao and Z. Chen, Appl. Catal., B, 2012, 117–118, 118 CrossRef CAS.
- T. Zhang and Z. R. Nan, Desalin. Water Treat., 2016, 57, 4633 CAS.
- J. Huang, Y. Liu, Q. Jin, X. Wang and J. Yang, J. Hazard. Mater., 2017, 143, 541 CrossRef PubMed.
- H. Tian, Q. Guo and D. Xu, J. Power Sources, 2010, 195, 2136 CrossRef CAS.
- T. Zhang, Res. J. Chem. Environ., 2013, 17, 32 Search PubMed.
- T. Zhang, M. Chen and S. Yu, Desalin. Water Treat., 2017, 63, 275 CrossRef CAS.
- H. B. Hadjltaief, M. B. Zina and M. E. Galvez, J. Photochem. Photobiol., A, 2016, 315, 25 CrossRef.
- S. Chai, G. Zhao, P. Li, Y. Lei, Y. Zhang and D. Li, J. Phys. Chem. C, 2011, 115, 18261 CrossRef CAS.
- Q. H. Fan, D. D. Shao, J. Hu, W. S. Wu and X. K. Wang, Surf. Sci., 2008, 602, 778 CrossRef CAS.
- A. I. Zárate-Guzmán, L. V. González-Gutiérrez, L. A. Godínez, A. Medel-Reyes, F. Carrasco-Marín and L. A. Romero-Cano, Chemosphere, 2019, 224, 698 CrossRef PubMed.
- A. T. Vu, T. N. Xuan and C. H. Lee, J. Water Process Eng., 2019, 28, 169 CrossRef.
- M. Sun, Y. Lei, H. Cheng, J. Ma, Y. Qin, Y. Kong and S. Komarneni, J. Alloys Compd., 2020, 825, 154036 CrossRef CAS.
- G. Xian, G. Zhang, H. Chang, Y. Zhang, Z. Zou and X. Li, J. Environ. Manage., 2019, 234, 265 CrossRef CAS PubMed.
- I. M. Ismail, B. Abdallah and M. Abou-Kharroub, Nucl. Instrum. Methods Phys. Res., Sect. B, 2012, 271, 102 CrossRef CAS.
- J. Qu, T. Che, L. Shi, Q. Lu and S. Qi, Chin. Chem. Lett., 2019, 30, 1198 CrossRef CAS.
- S. P. Sun and A. T. Lemley, J. Mol. Catal. A: Chem., 2011, 349, 71 CrossRef CAS.
- S. H. Tian, Y. T. Tu, D. S. Chen, X. Chen and Y. Xiong, Chem. Eng. J., 2011, 169, 31 CrossRef CAS.
- A. Zhang, N. Wang, J. Zhou, P. Jiang and G. Liu, J. Hazard. Mater., 2012, 201–202, 68 CrossRef CAS PubMed.
- T. Liu, H. You and Q. Chen, J. Hazard. Mater., 2009, 162, 860 CrossRef CAS PubMed.
- Q. Chen, P. Wu, Y. Li, N. Zhu and Z. Dang, J. Hazard. Mater., 2009, 168, 901 CrossRef CAS PubMed.
- A. Y. Zhang, W. K. Wang, D. N. Pei and H. Q. Yu, Water Res., 2016, 92, 78 CrossRef CAS PubMed.
- M. Abbas, B. P. Rao, V. Reddy and C. G. Kim, Ceram. Int., 2014, 40, 11177 CrossRef CAS.
- Q. Wang, S. Tian, J. Long and P. Ning, Catal. Today, 2014, 224, 41 CrossRef CAS.
- J. Deng, X. H. Wen and J. Li, Acta Sci. Circumstantiae, 2014, 34, 1436 CAS.
- B. Ren, Y. Xu, C. Zhang, L. Zhang, J. Zhao and Z. Liu, J. Taiwan Inst. Chem. Eng., 2019, 97, 170 CrossRef CAS.
- B. Ren, J. Miao, Y. Xu, Z. Zhai, X. Dong, S. Wang, L. Zhang and Z. Liu, J. Clean. Prod., 2019, 240, 118143 CrossRef CAS.
- A. Ivanets, M. Roshchina, V. Srivastava, V. Prozorovich, T. Dontsova, S. Nahirniak, V. Pankov, A. Hosseini-Bandegharaei, H. N. Tran and M. Sillanpää, Colloids Surf., A, 2019, 571, 17 CrossRef CAS.
| This journal is © The Royal Society of Chemistry 2020 |

