 Open Access Article
Creative Commons Attribution 3.0 Unported Licence
Operando sulfur speciation during sulfur poisoning-regeneration of Ru/SiO2 and Ru/Al2O3 using non-resonant sulfur Kα1,2 emission†
Dzulija Kuzmenko ab,
Adam H. Clark
 a,
Tilman Schildhauera,
Jakub Szlachetko*c and
Maarten Nachtegaal
 *a
*a
aPaul Scherrer Institut (PSI), CH-5232 Villigen, Switzerland. E-mail: maarten.nachtegaal@psi.ch
bDepartment of Chemistry and Applied Biosciences, ETH Zürich, Vladimir-Prelog-Weg 1-5, 8093 Zürich, Switzerland
cInstitute of Nuclear Physics, Polish Academy of Sciences, 31-342 Krakow, Poland. E-mail: jakub.szlachetko@ifj.edu.pl
First published on 21st April 2020
Abstract
A periodic oxidative regeneration of a sulfur-poisoned methanation catalyst is an alternative to the expensive state-of-the-art process of syngas cleaning using wet scrubbers. Here we have employed operando X-ray emission spectroscopy (XES) to study sulfur speciation on Ru/SiO2 and Ru/Al2O3 during methanation in the presence of H2S and subsequent regeneration in dilute O2 at 360 °C. XES allowed us to obtain semi-quantitative sulfur speciation and to monitor changes in the absolute sulfur concentration. It was established that Al2O3, in contrast to SiO2, forms sulfite/sulfate species by reacting with SO2, which is released from the poisoned Ru surface upon oxidative treatment. The concentration of sulfite/sulfate species is reduced upon switching the feed to H2/CO while no simultaneous increase in sulfide concentration is observed. For both catalysts, the regenerative treatment removes adsorbed sulfur as SO2 only partially, which we propose is the main reason for the incomplete activity recovery of the poisoned catalyst after regeneration.
1. Introduction
The production of methane from dry biomass consists of four main process steps: biomass gasification, syngas cleaning to remove catalyst poisons such as sulfur-containing compounds (H2S, COS, and thiophene), methanation (CO + 3H2 ⇌ CH4 + H2O) and removal of H2O and CO2. The second step, syngas cleaning, is currently energy inefficient since it requires cooling of syngas to ambient temperature between the gasification and methanation steps, which are performed at around 850 °C and 400 °C respectively.1,2 We have been exploring an alternative process, where the low temperature syngas cleaning step is skipped and the methanation catalyst is periodically regenerated after sulfur poisoning which would make the whole dry biomass to methane process more energy efficient.3We have reported recently that the ability to regenerate sulfur poisoned ruthenium nanoparticles, as measured by its methanation activity, is improved when ruthenium nanoparticles are supported on a sulfur-inert support, SiO2 compared to Al2O3.4 This was attributed to a higher Ru dispersion and lower sulfur storage of SiO2 upon multiple poisoning-regeneration cycles. With the help of in situ diffuse reflectance infrared spectroscopy, we were able to monitor the speciation of some of the sulfur species, where the formation of sulfate and sulfite species was observed when the poisoned sulfided catalyst was exposed to dilute oxygen. During subsequent exposure to methanation conditions (H2/CO) the intensity of the sulfate and sulfite peak decreased, but we could not determine if this was related to a reduction of sulfate and sulfite species to gas phase SO2 or to the sulfate reduction and subsequent adsorption of sulfides since diffuse reflectance spectroscopy did not allow detecting sulfides. Another open question is how efficient the regeneration process is, i.e. what percentage of initially adsorbed sulfur is removed from the catalyst surface via oxidative treatment. To answer these questions, it would be valuable to find ways to quantitatively trace sulfur speciation under operando conditions.
In that context, X-ray spectroscopy would be a possible solution since it allows for detecting all sulfur species. Our group has recently reported a study on the mechanism of sulfur poisoning on Ru/Al2O3 by using in situ sulfur K-edge X-ray absorption (XAS),5 where we proposed that sulfate species, formed during oxidative regeneration, under subsequent reducing conditions convert to H2S, which re-poisons Ru nanoparticles. However, S K-edge XAS only provided qualitative information. On the other hand, semi-quantitatively sulfur speciation under operando conditions should be accessible by sulfur X-ray emission spectroscopy (XES). Indeed, while XAS probes the unoccupied states and has many overlapping features, reflecting not only the sulfur oxidation state but also the local coordination of the sulfur atom,6 XES gives information on the occupied states and primarily reflects the nuclear charge. The sulfur Kα1,2 emission signal appears in the XES spectrum as a doublet, which can be readily fitted with a convolution of two pseudo-Voigt function peaks. For different sulfur oxidation states, only a systematic shift in peak energy position and a slight change in the ratio of Kα1 to Kα2 intensity have been observed.7 This allows obtaining quantitative sulfur speciation from XES using, for example, a linear combination fitting approach, quick and straightforward. In addition, since the X-ray emission signal intensity is directly proportional to the number of sulfur atoms in the beam, the changes in signal intensity can be used to estimate the changes in sulfur concentration. We have recently reported the development of a dedicated non-resonant XES setup including operando cell that allows to study sulfur speciation at low concentrations and in a time-resolved manner.8 Here, by employing non-resonant sulfur X-ray emission spectroscopy, we investigate the poisoning and regeneration mechanisms of sulfur-poisoned Ru nanoparticles supported on SiO2 and Al2O3. The key difference between the two catalysts arises from the ability of Al2O3 to form sulfates by reacting with SO2, which is released from the Ru surface upon oxidative treatment. By using operando non-resonant S XES, we show that for both catalysts, oxidative treatment at 360 °C only partially removes adsorbed sulfur as SO2. Sulfur remains adsorbed on the metal surface as sulfite/sulfate species. When the oxygen supply is removed, these oxidized species are reduced back to sulfide, which is the reason for the incomplete activity recovery.
2. Experimental
Non-resonant sulfur XES measurements were carried out using a dedicated S XES von Hamos spectrometer including an operando spectroscopic cell8 installed at the SuperXAS beamline of the Swiss Light Source (SLS), Villigen, Switzerland. The SLS operates at 400 mA and 2.4 GeV. The polychromatic beam from a 2.9 Tesla superbend magnet was collimated by a Si-coated mirror at 2.5 mrad and subsequently monochromatized by a Si (111) channel-cut crystal. Downstream of the monochromator, a Rh-coated toroidal mirror was used to focus the incident X-rays to a spot size of 100 × 100 μm at the sample position. The incoming X-ray energy was calibrated by using an Fe foil in transmission mode at the start of the experiment. The dedicated XES spectrometer9 was enclosed in a stainless steel chamber evacuated by a turbo pump to 10−3 to 10−4 mbar. In this vacuum chamber a 15 cm bending radius Si (111) von Hamos crystal was placed on a motorized stage allowing to fine tune the crystal position in focusing direction. A charge-coupled device (CCD) detector (Andor DO440, 2048 × 512 array with 13.5 × 13.5 μm pixels), which was thermoelectrically cooled to −30 °C, was used as a position sensitive detector. The chip length, consisting of 2048 pixels, allows measuring the X-ray emission energy range from 2.255 to 2.348 keV in a single acquisition. An aluminized 6 μm thick Mylar window was placed in front of the CCD chip to prevent visible light from reaching the chip. According to Bragg's law, the center of the Si (111) von Hamos crystal diffracts not only the Kα emission but also triple the energy of the sulfur Kα emission, i.e. 6.921 keV. Hence, the incident energy for non-resonant XES was set to be around 6.9 keV since this allowed us to observe both sulfur Kα emission and elastic scattering of the incident 6.9 keV beam in the same spectrum. The elastic scattering peak position was subsequently used for CCD pixel to energy calibration.For performing operando experiments, the operando cell9 was filled with ca. 15 mg of 3% Ru/SiO2 and Ru/Al2O3, prepared according to ref. 4. The operando cell is operated at atmospheric pressure and is equipped with a thermocouple close to the catalyst bed. A 7 μm thin Kapton film was used as window material. The cell was heated to 360 °C (10 °C min−1 ramp) while He was flowing through the cell. Subsequently, the catalyst was treated with the following gas sequence: methanation in the presence of inorganic sulfur (0.5 vol% CO, 2.5 vol% H2, 100 ppm H2S), He flush, oxidative regeneration (1 vol% O2), He flush and methanation without sulfur poisons (0.5 vol% CO, 2.5 vol% H2). The gases were dosed with mass flow controllers (Bronkhorst) and the gas phase after the reactor cell was analyzed with a quadrupole mass spectrometer (Max 300-LG, Extrel).
Reference compounds (Ag2S, FeS2, S, Na2SO3 and Na2SO4) were purchased from Sigma Aldrich and used as received. The powders were crushed using a pestle and mortar and subsequently pressed in a 0.5 cm diameter pellet without addition of any binder. Emission spectra were recorded for 60 seconds, apart for the elemental S sample, where an acquisition time of 5 seconds was sufficient to obtain a high signal-to-noise ratio.
The raw spectra were baseline corrected and normalised by the total area under the peak using an in-house written Python script. The normalised spectra of the reference compounds were used for fitting operando spectra. The following procedure for fitting the reference non-resonant XES spectra was followed: pseudo-Voigt peak functions10 were fitted to Kα1 and Kα2 emission peaks of the reference compounds and the extracted values are peak center, full width at half maximum (FWHM). The peak profile of the reference compounds was used for fitting the unknown operando spectra. The data treatment was performed using Origin software.
3. Results and discussion
3.1. Reference sulfur compounds
The spectra of various sulfur reference compounds Ag2S (S2−), FeS2 (S1−), S (S0), Na2SO3 (S4+) and Na2SO4 (S6+) were previously measured by our group8 and the published spectra are shown in Fig. 1 to help the readers with in situ spectra interpretation. In these spectra, the Kα1 and Kα2 lines can be clearly resolved, and an energy shift for various sulfur oxidation states is also observed, similar to previously reported values.7,11,12 Table S1 in ESI† gives the parameters (peak center, FWHM etc.) extracted from fitting the reference and used for fitting of the operando spectra described below.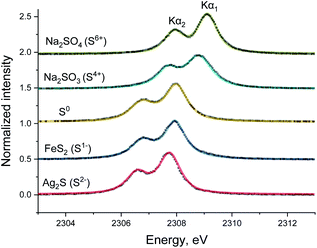 | ||
| Fig. 1 Sulfur Kα1,2 emission spectra (dotted black line) and the corresponding pseudo-Voigt peak function fit (colored full line) of reference compounds: Ag2S, FeS2, S, Na2SO3, and Na2SO4.9 | ||
3.2. Ru/SiO2
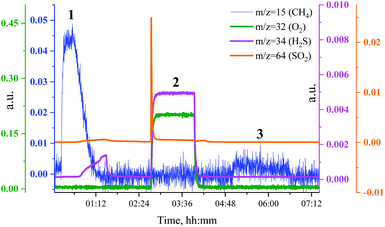
To investigate the relationship between the catalyst methanation activity and its structure during sulfur poisoning and regeneration, we have carried out H2S poisoning, oxidative regeneration and subsequent sulfur-free methanation of Ru/SiO2 while simultaneously measuring non-resonant X-ray emission spectra. Fig. 2 shows the mass spectrometer (MS) traces for CH4 (m/z = 15), O2 (m/z = 32 and m/z = 34), H2S (m/z = 34) and SO2 (m/z = 64) recorded during poisoning (H2/CO/H2S labelled 1), regeneration (O2 labelled 2) and subsequent sulfur-free methanation (H2/CO labelled 3) of Ru/SiO2. Note that the increase in m/z = 34, that accompanies the increase in m/z = 32 during oxidation, is solely due to oxygen, because the O atom has two important isotopes: 16O and 18O and hence the O2 molecule produces m/z = 32 and m/z = 34 fragments. The initial level of methane production, when Ru/SiO2 is treated with H2/CO/H2S, decreases gradually because of H2S adsorption on the active sites of Ru nanoparticles. The breakthrough of H2S is observed as the catalyst loses its methanation activity (m/z = 34 in Fig. 2). After methanation activity dropped to zero, the catalyst is treated with dilute oxygen to remove adsorbed sulfur atoms as SO2, which was detected as a spike in the MS data (m/z = 64 in Fig. 2). In the subsequent sulfur-free H2/CO treatment, we see a small recovery of methanation activity (m/z = 15 in Fig. 2). The recovered methanation activity is smaller than that reported in our previous studies4 probably due to the lower regeneration temperature (360 °C vs. 430 °C) used in this operando experiment.Fig. 3 shows the non-resonant XES spectra for all stages of the sulfur poisoning-regeneration cycle for methanation over a Ru/SiO2 catalyst. First, we observe a peak corresponding to reduced sulfur species (Fig. 3, black), which likely results from dissociative adsorption of H2S on the ruthenium surface since SiO2 is not known to form sulfides. In situ DRIFTS is not able to detect this reduced species4 likely because of the low IR intensity of this species and/or their vibration frequency being beyond the detectable range.13 Upon exposure to dilute oxygen, we see that the emission peak shifts to higher energy and its intensity decreases by ca. a factor of two (Fig. 3, red). The intensity decrease suggests that around half of the sulfidic species leave the metal surface as gas phase SO2, consistent with the observation of a spike of SO2 in the MS trace signal (Fig. 2, orange). The remaining oxidized species could be located on the support, SiO2, or on the Ru nanoparticles. We have previously shown4 using in situ DRIFTS that sulfur species were only observed upon treatment of sulfur poisoned Ru/SiO2 as a small peak at 1425 cm−1 (which was assigned to sulfate species on SiO2 (ref. 14–17)) when the O2 concentration is increased from 1 to 5% (Fig. S1†). Importantly, due to absorption of IR radiation below 1250 cm−1 by bulk Si–O bonds, we were only able to examine the region above 1250 cm−1 for in situ DRIFTS experiment. This implies that all species appearing below 1250 cm−1 will be invisible. This could have potentially masked sulfate species, as they could appear below 1250 cm−1,18 formed when sulfur poisoned Ru/SiO2 was treated with 1% O2 in Ar.
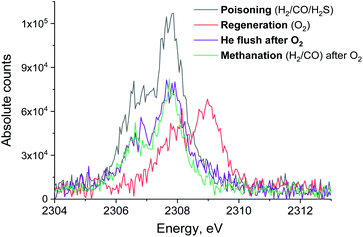 | ||
| Fig. 3 S Kα XES spectra of Ru/SiO2 in H2/CO/H2S (black), O2 (red) and subsequent pure He (purple) and H2/CO atmospheres (green). Integration time for each spectrum is 13 minutes. | ||
When the flow of oxygen is switched to pure He, the non-resonant XES spectra show that S4+/S6+ species are fully converted to S2− (Fig. 3, purple), indicating that S4+/S6+ species are not stable in the absence of oxygen. No significant changes to the XES spectrum are observed when CO and H2 are introduced in the feed (Fig. 3, green). We propose that the sulfidic species present after the oxidative regeneration (and flushing with inert gas) are blocking the active sites for methanation and cause the loss of Ru/SiO2 methanation activity. We also observe that when the gas feed is switched to O2, the intensity of the emission peak decreases by half, indicating that only half of the sulfur species at the position where the X-ray beam impinges the sample desorb as SO2. This means that at the temperature of this experiment, 360 °C, only half of the poisoning species are removed from the surface. Increasing the temperature of the oxidative treatment could improve the regeneration efficiency because more sulfur atoms could desorb as SO2.
3.3. Ru/Al2O3
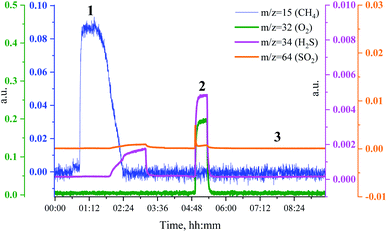
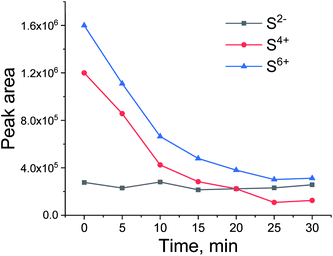
To see if the methanation activity of the Ru/Al2O3 catalyst recovers after sulfur poisoning, we have carried out H2S poisoning, oxidative regeneration and subsequent sulfur-free methanation of Ru/Al2O3. In addition, non-resonant X-ray emission spectra were acquired simultaneously at each stage. Fig. 4 shows the MS traces for CH4 (m/z = 15), O2 (m/z = 32, m/z = 34), H2S (m/z = 34) and SO2 (m/z = 64) recorded during poisoning (H2/CO/H2S labelled 1), regeneration (O2 labelled 2) and subsequent sulfur-free methanation (H2/CO labelled 3) over a Ru/Al2O3 catalyst. When treated with H2/CO/H2S, Ru/Al2O3 also experienced methanation activity loss. However, deactivation of Ru/Al2O3 (and for H2S to break through) is ca. twice slower than observed for Ru/SiO2 (cf. Fig. 2 and 4). As we have previously proposed,4 this could result from two causes. First, since Ru/Al2O3 has a smaller initial particle size than Ru/SiO2, there are more active sites and hence the deactivation is slower. Secondly, H2S adsorbs on to the Al2O3 surface, which also slows down deactivation of Ru nanoparticles. After regeneration however, no methanation activity is observed probably because of the long H2S treatment resulting in a high sulfur coverage that made oxygen adsorption on to the poisoned surface difficult or due to a low regeneration temperature. In addition, the SO2 signal during oxidative regeneration for Ru/Al2O3 is much smaller than for Ru/SiO2 (cf. Fig. 2 and 4, the scale for the SO2 signal is kept the same in Fig. 2 and 4 to simplify comparison), suggesting that the Al2O3 support reacts with SO2 released from Ru nanoparticles upon oxidative regeneration.Fig. 5 shows the non-resonant XES spectra for all stages of the sulfur poisoning-regeneration cycle for Ru/Al2O3. As for Ru/SiO2, after H2/CO/H2S treatment we observe a spectrum, which corresponds to sulfidic species (Fig. 5, black). When the poisoned catalyst is contacted with oxygen, SO2 is removed from the surface of the metal and reacts with Al2O3, forming S4+ and S6+ species. When looking at raw counts (Fig. 5, cf. black and red), we observe that the signal intensity of these oxidized species is higher than the intensity of the sulfide. The observed signal intensity change can be explained by the fact that the X-rays are probing the middle of the reactor: SO2 desorbed from the metal surface at the inlet of the reactor reacts with Al2O3 in the middle (also probably the outlet of the reactor) increasing the overall signal intensity. When the flow is switched from 1% O2 to pure He (Fig. 5, cf. red and purple), we observe the appearance of a small shoulder at lower energies. Fig. 6 shows the fit of this spectrum with a linear combination of S4+ and S6+ references. When adding 10% of the S2− reference to the linear combination of S4+ and S6+ references, the fit also accounts for the low energy shoulder-like feature as is shown in Fig. 7. This can be explained by the presence of two different oxidized species – one on the surface of the metal and another one on the support. The former as in the case of Ru/SiO2 (Fig. 3) are converted to S2− when the oxygen supply is switched off, while the latter, presumably, in the form of Al2(SO4)3, are stable even without oxygen in the feed. After 30 minutes of subsequent H2/CO treatment (Fig. 5, green) a decrease of the sulfate signal intensity is observed. Fig. 8 shows the sulphur XES signal temporal evolution during H2/CO treatment and Fig. 9 shows the peak area of each species every 5 minutes derived from fitting (Fig. S2–S7 in ESI†) of the spectra using S2−, S4+, S6+ references. The fitting parameters of the references and the percentage of each reference component in the fit of the in situ spectra are given in Tables S1 and S2† respectively. From Fig. 9, we can conclude that the absolute concentration of S4+ and S6+ is decreasing while the concentration of S2− stays constant during H2/CO treatment.
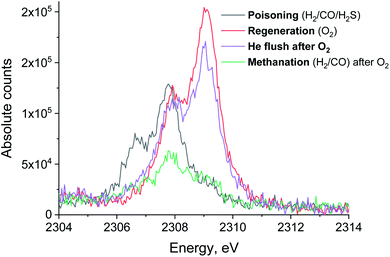 | ||
| Fig. 5 S XES spectrum of Ru/Al2O3 in H2/CO/H2S (black), O2 (red) and subsequent pure He (purple) and H2/CO atmosphere (green). Integration time for each spectrum is 13 minutes. | ||
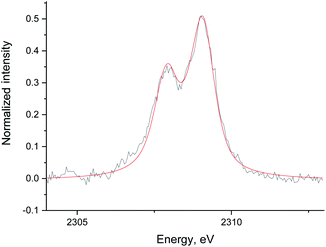 | ||
| Fig. 6 The data (black) and fit (red) of the Ru/Al2O3 S XES spectrum in He without S2− reference added. The data was background corrected and normalized by integral intensity. | ||
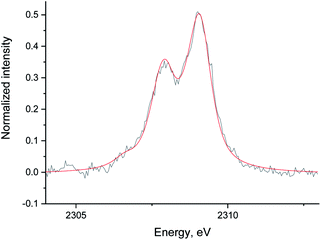 | ||
| Fig. 7 The data (black) and fit (red) of the Ru/Al2O3 S XES spectrum in He with S2− reference added. The data was background corrected and normalized by integral intensity. | ||
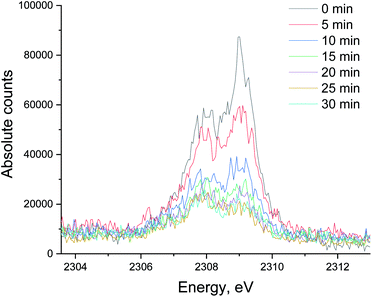 | ||
| Fig. 8 The evolution of the sulfur XES signal during H2/CO treatment after oxidative regeneration of Ru/Al2O3. Integration time for each spectrum is 5 minutes. | ||
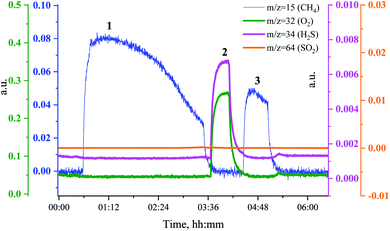
In a separate experiment, Ru/Al2O3 was exposed to H2/CO/H2S at the same temperature and gas flow for a shorter period, which resulted in an incomplete deactivation and methanation activity being observed in the MS traces after oxidative treatment. Fig. 10 shows the MS traces for CH4 (m/z = 15), O2 (m/z = 32 and m/z = 34), H2S (m/z = 34) and SO2 (m/z = 64) recorded during poisoning (H2/CO/H2S labelled 1), regeneration (O2 labelled 2) and sulfur-free methanation (H2/CO labelled 3). The methanation activity is not fully lost due to poisoning and, importantly, no H2S breakthrough is seen (Fig. 10, pink). Further, no or only a very small SO2 peak is visible upon O2 addition.
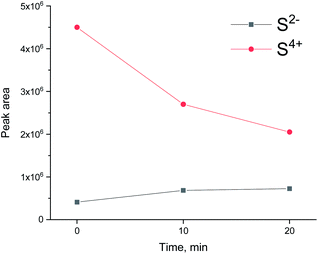
The evolution of XES spectra during H2/CO treatment is shown in Fig. 11 and the peak area for each species is shown in Fig. 12 (fitting in S8–S10 in ESI†). Overall, we observe a decrease in the total area of the peak as H2/CO treatment proceeds, the intensity of the oxidized species (S4+ only could be fitted) peak decreases and there is a small increase in the peak area of S2−. This suggests that there is possibly a small chance of a partial sulfite reduction to sulfide for a partially poisoned catalyst. Most of the oxidized species however are reduced to gas phase SO2 rather than to adsorbed sulfidic species.
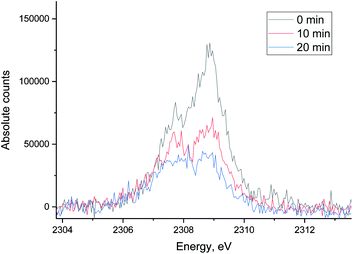 | ||
| Fig. 11 The evolution of sulfur XES signal during H2/CO treatment after oxidative regeneration of Ru/Al2O3. Integration time for each spectrum is 10 minutes. | ||
3.4. Proposed mechanism
By combining all results presented here, we propose the following mechanisms of sulfur transport on Ru/SiO2 and Ru/Al2O3 (Fig. 13). On Ru/SiO2, around half of the S2−/S1− species, formed on the surface of the Ru metal during poisoning via dissociative adsorption of H2S, are oxidized upon oxygen introduction at 360 °C and released as gas phase SO2 while the other half remains bound to the metal surface as a mixture of S4+/S6+ species. As oxygen is removed from the feed, S4+/S6+ species on the Ru nanoparticle surface are reduced back to S2−/S1− and subsequent H2/CO treatment does not change the speciation significantly. The main difference for Ru/Al2O3 is that oxidation also produces S4+/S6+ species bound to the support, Al2O3, which are stable when oxygen is removed from the feed and are partially removed (likely reduced to gas phase species) when H2/CO is introduced. In addition, for Ru/Al2O3, the mechanism also depends on the sulfur surface coverage established during H2S poisoning. For high coverage, no increase in S2− species concentration accompanies S4+/S6+ partial removal, while for low coverage we see a small increase in S2− species as the number of S4+/S6+ species decreases. This can be explained by the difference in the availability of adsorption sites on Ru: a heavily poisoned catalyst has less sites which are available for sulfide re-adsorption.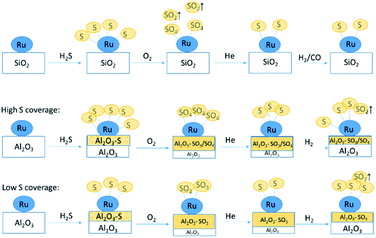 | ||
| Fig. 13 Proposed mechanism of sulfur poisoning and regeneration of Ru/SiO2 (top) and Ru/Al2O3 (middle and bottom). | ||
4. Conclusions
In order to understand the influence of periodic oxidative regeneration of sulfur-poisoned methanation catalysts as alternative to cost intensive low temperature scrubbers, mechanistic studies are indispensable. Based on the previous study of sulfur poisoning-regeneration of a Ru/Al2O3 catalyst using operando sulfur K-edge XAS, the reduction of sulfate species, formed during oxidative regeneration, under subsequent reducing conditions to sulfides was proposed. However, since no exact reference compound spectra were available, only qualitative information was obtained. We have shown here that operando non-resonant X-ray emission spectroscopy is an alternative powerful technique for studying sulfur speciation. In contrast to XAS, XES allowed us to monitor the changes in the absolute concentration of various sulfur species during poisoning-regeneration and determine the proportion of each oxidation state species by a straightforward linear combination fitting of the references.We have established that oxygen treatment of both poisoned catalysts removes adsorbed sulfur as SO2, but only partially. The remaining part stays adsorbed on to Ru nanoparticles as S4+/S6+ species. These species are only stable under oxygen flow and reduce back to sulfide when no oxygen is in the feed. The loss of methanation activity is due to an incomplete removal of sulfur species from the Ru metal surface during oxidative regeneration and an increase of the oxidative regeneration temperature could help in removing more sulfur species from the surface to the gas phase.
Conflicts of interest
There are no conflicts to declare.Acknowledgements
This research project is funded by Swiss National Science Foundation (grant number 156206) and supported by the Energy System Integration platform (ESI) and by the Swiss Innovation Agency lnnosuisse as part of the Swiss Competence Center for Energy Research SCCER BIOSWEET. The Swiss Light Source is acknowledged for the provision of beamtime at the SuperXAS beamline. The National Science Centre, Poland (NCN), is thanked for partial support under grant no. 2016/21/D/ST4/00378. We would like to thank Prof. Dr Christophe Copéret for discussions and advice on improving the manuscript. T. Fovanna, Dr J. Imbao, R. Nuguid and Dr K. W. Chan are acknowledged for help during beamtime.Notes and references
- T. J. Schildhauer, in Synthetic Natural Gas from Coal, Dry Biomass, and Power-to-Gas Applications, John Wiley & Sons, Ltd, 2016, pp. 1–4 Search PubMed.
- U. Rhyner, in Synthetic Natural Gas from Coal, Dry Biomass, and Power-to-Gas Applications, John Wiley & Sons, Ltd, 2016, pp. 41–76 Search PubMed.
- C. F. J. König, M. Nachtegaal and T. J. Schildhauer, in Synthetic Natural Gas from Coal, Dry Biomass, and Power-to-Gas Applications, John Wiley & Sons, Ltd, 2016, pp. 293–306 Search PubMed.
- D. Kuzmenko, M. Nachtegaal, C. Copéret and T. J. Schildhauer, Molecular-level understanding of support effects on the regenerability of Ru-based catalysts in the sulfur-poisoned methanation reaction, J. Catal., 2019, 375, 74–80 CrossRef CAS.
- C. F. J. König, P. Schuh, T. Huthwelker, G. Smolentsev, T. J. Schildhauer and M. Nachtegaal, Influence of the support on sulfur poisoning and regeneration of Ru catalysts probed by sulfur K-edge X-ray absorption spectroscopy, Catal. Today, 2014, 229, 56–63 CrossRef.
- F. Jalilehvand, Sulfur: not a “silent” element any more, Chem. Soc. Rev., 2006, 35, 1256–1268 RSC.
- R. Alonso Mori, E. Paris, G. Giuli, S. G. Eeckhout, M. Kavčič, M. Žitnik, K. Bučar, L. G. M. Pettersson and P. Glatzel, Electronic Structure of Sulfur Studied by X-ray Absorption and Emission Spectroscopy, Anal. Chem., 2009, 81, 6516–6525 CrossRef CAS.
- D. Kuzmenko, U. Vogelsang, S. Hitz, D. Müller, A. H. Clark, D. Kinschel, J. Czapla-Masztafiak, C. Milne, J. Szlachetko and M. Nachtegaal, A von Hamos spectrometer for: in situ sulfur speciation by non-resonant sulfur Kα emission spectroscopy, J. Anal. At. Spectrom., 2019, 34, 2105–2111 RSC.
- D. Kuzmenko, U. Vogelsang, S. Hitz, D. Müller, A. H. Clark, D. Kinschel, J. Czapla-Masztafiak, C. Milne, J. Szlachetko and M. Nachtegaal, A von Hamos spectrometer for in situ sulfur speciation by non-resonant sulfur Kα emission spectroscopy, J. Anal. At. Spectrom., 2019, 34, 2105–2111 RSC.
- T. C. Huang and G. Lim, Resolution of Overlapping X-Ray Fluorescence Peaks With the Pseudo-Voigt Function, Adv. X-Ray Anal., 1985, 29, 461–468 CrossRef.
- M. Kavčič, A. G. Karydas and C. Zarkadas, Chemical state analysis employing sub-natural linewidth resolution PIXE measurements of Kα diagram lines, X-Ray Spectrom., 2005, 34, 310–314 CrossRef.
- M. Kavčič, A. G. Karydas and C. Zarkadas, Chemical state analysis of sulfur in samples of environmental interest using high resolution measurement of Kα diagram line, Nucl. Instrum. Methods Phys. Res., Sect. B, 2004, 222, 601–608 CrossRef.
- B. Liang, X. Wang and L. Andrews, Infrared Spectra and Density Functional Theory Calculations of Group 8 Transition Metal Sulfide Molecules, J. Phys. Chem. A, 2009, 113, 5375–5384 CrossRef CAS PubMed.
- B. A. Morrow, R. A. McFarlane, M. Lion and J. C. Lavalley, An infrared study of sulfated silica, J. Catal., 1987, 107, 232–239 CrossRef CAS.
- D. Bounechada, Z. Darmastuti, M. Andersson, L. Ojamäe, A. Lloyd Spetz, M. Skoglundh and P.-A. Carlsson, Vibrational Study of SOx Adsorption on Pt/SiO2, J. Phys. Chem. C, 2014, 118, 29713–29723 CrossRef CAS.
- D. Bounechada, D. P. Anderson, M. Skoglundh and P.-A. Carlsson, SO2 adsorption on silica supported iridium, J. Chem. Phys., 2017, 146, 84701 CrossRef PubMed.
- D. Bounechada, S. Fouladvand, L. Kylhammar, T. Pingel, E. Olsson, M. Skoglundh, J. Gustafson, M. Di Michiel, M. A. Newton and P.-A. Carlsson, Mechanisms behind sulfur promoted oxidation of methane, Phys. Chem. Chem. Phys., 2013, 15, 8648–8661 RSC.
- T. Wilke, X. Gao, C. G. Takoudis and M. J. Weaver, Surface-enhanced Raman spectroscopy at transition metal-gas interfaces: adsorption and reactions of sulfur dioxide on platinum-, rhodium-, and ruthenium-coated gold, J. Catal., 1991, 130, 62–75 CrossRef CAS.
Footnote |
| † Electronic supplementary information (ESI) available. See DOI: 10.1039/d0ra03068f |
| This journal is © The Royal Society of Chemistry 2020 |

