 Open Access Article
Enhanced thermal effect of plasmonic nanostructures confined in discoidal porous silicon particles†
Dechen Zhangab,
Hung-jen Wub,
Xinyu Zhoub,
Ruogu Qib,
Li Xu a,
Yi Guo
 *a and
Xuewu Liu*b
aKey Laboratory for Molecular Enzymology and Engineering, The Ministry of Education, National Engineering Laboratory for AIDS Vaccine, School of Life Sciences, Jilin University, Changchun 130012, P. R. China. E-mail: guoyi@jlu.edu.cn
bDepartment of Nanomedicine, Houston Methodist Research Institute, 6670 Bertner Avenue, Houston, TX 77030, USA. E-mail: xliu@houstonmethodist.org
First published on 20th August 2020
Abstract
The design of plasmonic nanostructures could have many exciting applications since it enhances or provides valuable control over efficient energy conversion. A three-dimensional (3D) space is a realistic hotspot matrix harvesting a wide conversion that has been shown in zero-dimensional nanoparticles, one-dimensional linear structures, or two-dimensional films. A novel 3D plasmonic nanostructure platform consisting of plasmonic metal nanoparticles in discoidal porous silicon particles is used in this study. Plasmonic gold nanoparticles are anchored inside the discoidal porous silicon (DPS) particles by in situ reduction synthesis. The novel plasmonic nanostructures can tailor the plasmon band and overcome the instability of photothermal materials. The “trapping well” for the anchored nanoparticles in 3D space can result in a huge change of plasmonic band of metal nanoparticles to the near-IR region in a novel 3D geometry. A multifunctional scaffold, Au–DPS particle, composed of doxorubicin conjugated to poly-(L-glutamic acid) (pDOX), was developed for combinatorial chemo-photothermal cancer therapy. The therapeutic efficacy was examined in treatment of the A549 cell line under near-IR laser irradiation. The highly efficient photothermal conversion can also be demonstrated in the laser desorption/ionization time-of-flight mass spectrometry detection analysis. The limit of detection was obviously improved in the detection of angiotensin II, P14R, and ACTH fragments 18-39 peptides. Overall, we envision that Au–DPS particles may be used in ultrasensitive theranostics in the future.
Introduction
The thermal effect is very important in the plasmonic matrix. The ability to effectively increase the temperature of the nanostructure could be applied in many bio-related surrounding processes, including selective identification and killing of cancer cells,1 photothermal nanotherapeutics,2,3 local control over phase transitions,4 nanofluidics and chemical separation,5 heterogeneous catalysis,6,7 drug delivery,8–12 photothermal melting of DNA,13 and surface-assisted laser desorption/ionization time-of-flight mass spectrometry.14–17 These applications of heated nanoparticles rely on a simple mechanism. The heating effect can be strongly enhanced in the presence of coupled nanoparticles.18 Localized surface plasmons can be more active in a light-driven energy transformation. This can lead to significant heating of the nanostructure itself as well as its immediate environment. Therefore, the special nanostructure will contribute to an effective thermal conversion process.19The metallic nanostructure shows an exciting opportunity to manipulate plasmon resonance. A three-dimensional (3D) space is a realistic hotspot matrix harvesting a wide conversion that has been shown in zero-dimensional nanoparticles, one-dimensional linear structures, or two-dimensional films. It can be used to enhance light absorption and convert photons into hot carriers efficiently.20–22 The coupled plasmons are quite fascinating and include a strong geometric effect on the optical resonant properties controlling light absorption and conversion.23,24 Meanwhile, multi-scale hierarchical nano- and microarchitectures can create a collective enhancing effect in tailoring the properties of the material produced.25–28
In nature, a porous nanostructure is an ideal supporter for multi-scale hierarchical assembly. Previous attempts to load metal nanomaterials (gold nanoshells or nanorods) into discoidal porous silicon (DPS) particles have resulted in effective local heating.29,30 However, the loaded gold nanomaterials were not fixed in the pores of silicon particles. Gold nanoarchitecture cannot form a realistic hotspot matrix with large interparticle separation in the porous silicon. Therefore, a novel protocol was developed for the in situ reduction synthesis of gold nanoparticles in the pores to form a stable, high efficiency, realistic plasmonic matrix. The plasmon band in this plasmonic nanostructure composite was adjustable by the solid–liquid reaction mechanism.31 A robust, defined plasmonic nanostructure paves the way for the development of hotspot matrix nanomaterials.
In this study, gold nanoparticles were synthesized in the pores of DPS particles. The plasmonic absorption band could be tuned from 554 nm to 808 nm. The one-step method using porous silicon as a reducing agent undergoes a solid–liquid synthesis process. This new type of hybrid particles was applied as multifunctional drug carrier for cancer photothermal-chemotherapy. Moreover, it was also a good substrate for laser desorption/ionization time-of-flight mass spectrometry (LDI-TOF-MS) biomarker analysis.
Results and discussion
Fabrication of Au–DPS architecture
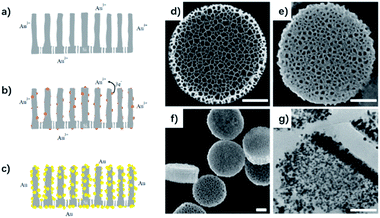
DPS particles were fabricated using a previously described protocol.32 A microfabrication strategy for direct lithographic patterning of porous silicon nanodisks is presented that enables precise and independent control over particle size, shape, and porous structure. They have vertically aligned pores opened to one side and closed to the other, allowing room for cargo loading.Due to the strong reduction power of porous silicon,33 gold nanoparticles were produced on the silicon surface in the 3D space by gold electroless deposition. Simultaneous electrochemical processes including cathodic and anodic reactions occurred on the silicon surface. Surface silicon atoms were oxidized (anodic reaction, eqn (1)), supplying the electrons for the gold deposition reaction (Fig. 1a–c, cathode reaction, eqn (2)).34 The corresponding reaction can be outlined as the following two half-cell reactions:
Anode reaction (underneath Au nanoparticles):
| Si(s) + 2H2O → SiO2 + 4H+ + 4e− | (1) |
| AuCl4− + 3e− → Au(s) + 4Cl− | (2) |
Because of the hydrophobic surroundings in the pores of the fresh silicon disk, polyvinylpyrrolidone (PVP) was chosen as a capping agent to disperse the gold ion into the pores of the silicon disk and control the size of gold nanoparticles.35 Ultrasonic agitation was also necessary to disperse metal ions into the porous nanostructure immediately. The gold nuclei were deposited on the surface of the silicon, and SiO2 was formed simultaneously underneath the gold nanoparticles according to an electroless-deposition mechanism.36 Then, a simple seeded growth approach can assemble the gold nanoparticles in the vertical-aligned nanopores.37 The color of the solution formed was red, violet, or dark in the different reaction systems. Scanning electron microscopy (SEM) was performed to visualize the DPS particles pre- and post-loading with gold NPs (Fig. 1d–f). A transmission electron microscope (TEM) slice of Au–DPS particles reveals the gold NPs are distributed inside the vertically aligned pores (Fig. 1g). The element mapping is also confirmed that gold element combined with silicon element in the Au–DPS particles (see ESI Fig. S1†).
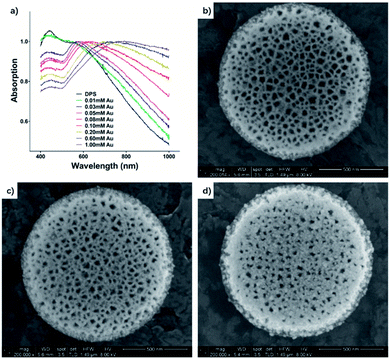
Densely packed NPs with uniform size are ideal to enable oscillations of adjacent NPs to couple and form a new vibration mode. Namely, with shorter interparticle separation of gold NPs, the anisotropy of the surface plasmon resonance (SPR) band increases, leading to a resonance frequency shift, which can be detected as a red-shifted and broadened absorption peak.38 A plasmon band appeared and shifted from 554 nm to 808 nm (Fig. 2). This is important to reduce absorption of light by the biological surrounding, as the penetration depth of tissue increases in the infrared spectral region.39 By changing the relative amounts of reactants, the plasmon resonance band is tailored in our system.
Approximately 30 min after initiation of the reaction, the suspension changed from pale brown to red rapidly, then gradually to violet, indicating the formation of gold NPs. The size of gold nanoparticles was about 8 nm in the 0.01 mM gold salt concentration reaction system (Au–DPS I, Fig. 2b), which was measured in SEM images (see the statistical data in the ESI Fig. S2†). Meanwhile, a new plasmon band at 554 nm (Fig. 2a) also appeared in the UV-vis spectra, which showed a slight red-shift compared with the surface plasmon resonance (SPR) of free 10 nm gold NPs (about 520 nm). This indicated the SPR band of Au NPs interacted with each other when the distance of gold NPs was short in a 3D space. Thus, the anchored gold nanoparticles in the DPS particles facilitated a red shift in the spectra. As the concentration of tetrachloroauric acid further increased to 0.1 mM, the band gradually red-shifted to 620 nm, which showed the more densely Au NPs appeared in the pores of DPS particles. In addition, SEM images confirmed that the amount of gold NPs deposited in the DPS particles increased densely (Au–DPS II, Fig. 2c). When the concentration of tetrachloroauric acid was increased to 1 mM, the band shifted to 808 nm and broadened. The SEM images showed that the diameter of some gold nanoparticles deposited on the DPS particles increased (Au–DPS III, Fig. 2d).
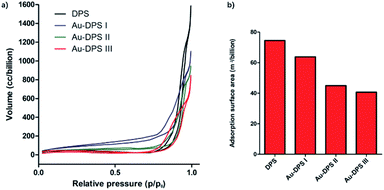
The typical N2 adsorption/desorption isotherms of porous materials proved the changes of pore-size distribution in our reaction system. The Barrett–Joyner–Halenda (BJH) curve is also consistent with SEM images. The porosity of DPS particles is about 70% according to calculation. When gold nanoparticles anchored into the pores of DPS particle, the porosity decreased to 44% for the Au–DPS I, 40% for the Au–DPS II, and 37% for the Au–DPS III. This also indicated the gold nanoparticles were anchored within a small space in the pores of DPS particles (Fig. 3).
Reaction mechanism of Au–DPS particles
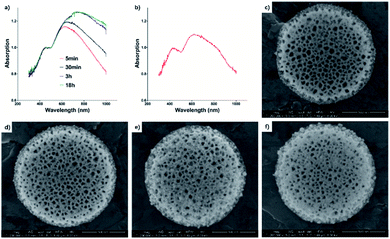
The 15 mp per mL DPS particles with 0.2 mM tetrachloroauric acid reaction system was selected to study the reaction mechanism. The reactions lasted 5 min, 30 min, 3 h, and 18 h, respectively. As shown in Fig. 4, the gold nanoparticles appeared within the first 5 min due to the strong reduction power of porous silicon. With the longer reaction times, the gold nanoparticles plasmon band was enhanced and red-shifted from 650 nm to the infrared region (>750 nm). This could be the coupled resonance of plasmons as well as the size of gold nanoparticles increasing.40–42 When PVP was used in our reaction, the gold nanoparticle size was controlled within 15 nm (see ESI Fig. S3†). The longer red-shifted plasmon was mainly contributed by the crowded assembly of gold nanoparticles in the pores of silicon particles. To further illustrate the assembly process, we dilute the reaction system. The solution dilution has a substantial effect on the concentration of DPS particles or tetrachloroauric acid. The reaction time was still 30 min, and we found that a new plasmon band (about 800 nm) appeared. As the Au seed sites in DPS particles were near saturation, the tetrachloroauric acid continued to drive Au NPs growth, while leading a shortened gap between Au NPs for the increased diameter. Due to the lower reaction speed, the redox reaction slowed down in the pores of DPS particles to prevent the crowded assembly of gold nanoparticles. In this situation, gold nanoparticles were arranged in an anisotropic alignment in the porous channel of silicon particles. The new plasmon band appeared in the long-wave band range. The anisotropic alignment was enhanced when the concentration of gold salt increased. So, the near infrared absorbent material could be easier to be made than some recent reports.43,44 Thus, the plasmon band at 520 nm (gold nanoparticles) became weak, and the new band enhanced, broadened, and moved to the long-wave band range.Photothermal effect
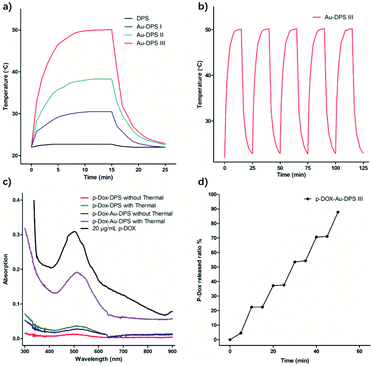
In metal nanoparticles, the birth of each photogenerated hot carrier can be a near unity conversion of photon energy into heat, because the metal nanoparticles have a very low optical quantum yield.45–47 The heating effect becomes strongly enhanced when the laser frequency hits the collective plasmon resonance of nanoparticles. Three kinds of Au–DPS particles (Au–DPS I, II, III) were selected for heat response to the exposure to 808 nm laser (Fig. 5). Among them, Au–DPS particles III have the highest thermal conversion efficiency. The control experiment with DPS particles solution loaded in the cuvette showed no detectable temperature increase in the water.Meanwhile, the temperature of Au–DPS particles III solution increased from 21.9 °C to 50.1 °C within 900 s (Fig. 5b). Hence, the temperature increase with the presence of Au–DPS particles is principally attributed to heat transduced from the light by gold NPs anchored in DPS particles. The different heating rate could be due to the different plasmon resonant wavelength of Au–DPS particles. When the laser frequency is close to the collective plasmon resonance of Au–DPS particles, the heating rate becomes strongly enhanced.
This photothermal testing process was repeated more than 5 times, and no noticeable degradation was observed (Fig. 5b and S4†). This further indicates that the plasmonic nanostructures were stable under laser radiation.48 Then, the photothermal conversion efficiency would be improved for local heating. As is well known, DPS particles are suitable for specific local accumulation in vivo.32 This would increase the efficiency of thermal therapy in local tissue.
When the drug was loaded in the pores of Au–DPS particles, the effect of the alliance therapeutic would be better than that of monotherapy. Many Au nanoparticles are tightly packed within a single DPS particle, which helps promote their effect on thermal conversion. In our previous reports, doxorubicin conjugated to poly-(L-glutamic acid) by means of a pH-sensitive cleavable linker formed the polymeric drug (pDox).49 NH2–PEG–SH was connected to Au–DPS particles through a coordinate covalent bond between Au and the thiol group. pDox was loaded into the pores by the electrostatic interaction with the amine group in Au–DPS particles. As calculated, an average of 58.5 μg of pDox can be loaded per billion Au–DPS particles. The released amount of pDox from Au–DPS particles could be enhanced rapidly by laser heating (Fig. 5c). The release curve in PBS solution displays the relationship between pDox release and photothermal action (Fig. 5d).
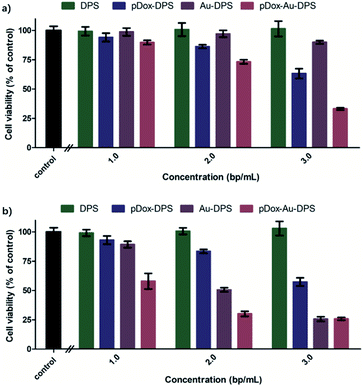
DPS particles do not arouse the cellular apoptotic response and keep the cellular proliferation of normal tissues.50,51 In in vitro cell experiments, exposure to DPS particles, monodisperse Au NPs, pDox, Au–DPS particles, pDox–DPS particles, or pDox–Au–DPS particles showed only very slight cell differences (Fig. S5a† and 6a). It is worth noting that irradiated pDox–Au–DPS particles exhibited the most effective cancer cell therapy due to combined chemo-photothermal treatment: after exposure to the near-IR laser for 300 s combined with pDox released for 12 h treatment, over 90% of A549 cells were wiped out. Compared to its individual components, pDox–Au–DPS particles showed enhanced efficacy in apoptosis (Fig. S5b† and 6b). This shortened the effect time than our earlier work with using gold nanorod anchored DPS particles to load DOX for combinatorial cancer cell treatment.30 CCK8-kit assays confirmed that the chemo-photothermal therapy ablation resulted in a synergistic effect, boosting the efficiency of eliminating cancer cells.
LDI-TOF-MS analysis
Compared to therapy in cancer, the thermal effect can also be used in diagnosis protocol, such as LDI-TOF-MS analysis.52,53 As shown above, the Au–DPS particles are stable and efficient in thermal transfer for local heating. It could be beneficial for desorption/ionization in LDI-TOF-MS analysis process.54 The pores in Au–DPS particles can also be used to trap more targets. Therefore, some biomarker targets were used in LDI-TOF-MS analysis. Angiotensin II (1046.5 Da), P14R (1533.9 Da), and ACTH fragments 18-39 (2465.2 Da) were used as model analytes for LDI-TOF-MS. In this process, no matrix is needed except for the control group. As a result, in the positive ion spectra [angiotensin II + H]+, [P14R + H]+, and [ACTH + H]+ are observed, as well as peaks corresponding to Au-cluster species (e.g., Au5+, Au6+, and Au7+) (Fig. 7). Therefore, the Au cluster, which appeared in the spectra, would be the main contributor to LDI-TOF-MS analysis. The three kinds of Au–DPS particles (I, II, III) have higher sensitivity than the regular CHCA matrix (Table 1). The lowest limit of detection was 0.14 fmol for angiotensin II in the Au–DPS particles (III) substrate. The largest gold nanoparticle size (about 15 nm in diameter) of Au–DPS particles (III) can give rise to the maximum temperature increase. It will be beneficial to increase the energy transfer for desorption ionization (DI) process.46 However, the larger the size of the gold nanoparticles, the smaller the porosity of the Au–DPS substrate. This will decrease the absorption amount of Au–DPS particles (III) for larger molecular weight sample analytes. The sensitivity of detection ranges up to 19.89 fmol for the P14R peptide and ACTH fragments 18-39 cannot be detected in this process. The same result is found in the ∼12 nm size gold nanoparticle of Au–DPS particles (II). There is no difference in sensitivity between angiotensin II and P14R peptides. However, the limit of detection of ACTH fragments 18-39 ranges up to 37.50 fmol. This could be due to the lower absorption in the lower porosity of Au–DPS particles (II). Moreover, in Au–DPS particles (I) system, a good sensitivity can be obtained up to 4.69 fmol for three kinds of analytes. High porosity increases the absorption amount of sample, which is better for the conventional MALDI-TOF-MS analysis.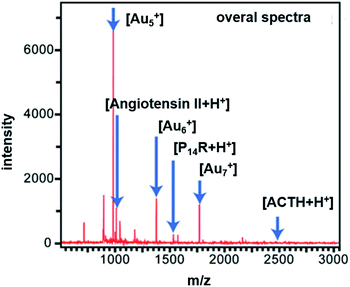 | ||
| Fig. 7 Mass spectra of standard peptides acquired by laser desorption/ionization time-of-flight mass spectrometry (LDI-TOF-MS) using Au–DPS particles to assist analytes desorption/ionization. | ||
Experimental
Reagents
Tetrachloroauric acid (HAuCl4), hydrofluoric acid (HF), polyvinylpyrrolidone (PVP) MW: 58![[thin space (1/6-em)]](https://www.rsc.org/images/entities/char_2009.gif) 000, dimethylformamide (DMF), isopropyl alcohol (IPA), and free gold NPs (5 nm, 10 nm, 15 nm) were purchased from Sigma-Aldrich and used as received. CCK-8 assay kits were obtained from Life Technologies Thermo Fisher Scientific. NH2-mPEG-SH (MW: 3400) was bought from Laysan Bio. Fetal bovine serum (FBS) was acquired from Thermo Fisher Scientific. Dulbecco's modified Eagle's medium high glucose (DMEM) and A549 cells were purchased from ATCC.
000, dimethylformamide (DMF), isopropyl alcohol (IPA), and free gold NPs (5 nm, 10 nm, 15 nm) were purchased from Sigma-Aldrich and used as received. CCK-8 assay kits were obtained from Life Technologies Thermo Fisher Scientific. NH2-mPEG-SH (MW: 3400) was bought from Laysan Bio. Fetal bovine serum (FBS) was acquired from Thermo Fisher Scientific. Dulbecco's modified Eagle's medium high glucose (DMEM) and A549 cells were purchased from ATCC.
Fabrication of DPS particles
Microfabrication of DPS particles was performed at the Microelectronics Research Center at the University of Texas at Austin. The detailed fabrication process has previously been described.32 Briefly, fabrication consisted of photolithography and electrochemical etching of silicon wafers. DPS with diameter of 1000 nm, height of 400 nm and pore size of about 50 nm was used in our experiment.50 The morphology of DPS particles was verified using a FEI Nova NanoSEM 230 (Thermal Fisher, USA) scanning electron microscope (SEM). A side mounted detector for an Energy Dispersive X-ray Spectroscopy (EDS) elemental analysis is also used to provide elemental identification and quantitative compositional information. The EDS detector is an EDAX-OCTANE SUPER device (AMETEK, Inc. USA). Volumetric particle size, size distribution, and count were obtained using a Multisizer 4 Coulter Particle Counter (Beckman Coulter, Fullerton, CA, USA). Pore size analysis was carried out by Autosorb iQ-MP/XR surface area and pore size analyzer (Quantachrome instruments, USA).Preparation and characterization of Au–DPS particles
To remove the slight oxide layer on porous silicon particles, the particles were mixed in an aqueous solution of 0.05% hydrogen fluoride for 5 min. The particles were washed three times in water and then three times in isopropyl alcohol (IPA) using centrifugation 3000 g for 3 min. The concentration of DPS particles was measured by a Multisizer 4 Coulter Particle Counter. 15 million particles per mL (mp per mL) concentration was used in our work, except for following special instructions. DPS particles were added to a 10% (m/m) aqueous solution of polyvinylpyrrolidone (PVP), and different concentrations of HAuCl4 solution were quickly added under ultrasonic agitation for 30 min, respectively. Then, resulted Au–DPS particles were separated from the reaction solution by centrifugation at 20![[thin space (1/6-em)]](https://www.rsc.org/images/entities/char_2009.gif) 000 g for 1 min. The Au–DPS particles were washed three times in water and then three times in IPA at 3000 g for 3 min. A DU® 730 life science ultraviolet (UV)-visible (vis) spectro-photometer was used to measure the spectrum of the solution. The morphology of DPS particles was assessed with a Nano SEM 230 and a JEM-2100 field emission gun transmission electron microscope (TEM). The mass of the chemical elements was measured with a Varian 720-ES inductively coupled plasma optical emission spectrometer (ICP-OES).
000 g for 1 min. The Au–DPS particles were washed three times in water and then three times in IPA at 3000 g for 3 min. A DU® 730 life science ultraviolet (UV)-visible (vis) spectro-photometer was used to measure the spectrum of the solution. The morphology of DPS particles was assessed with a Nano SEM 230 and a JEM-2100 field emission gun transmission electron microscope (TEM). The mass of the chemical elements was measured with a Varian 720-ES inductively coupled plasma optical emission spectrometer (ICP-OES).
Photothermal curve of Au–DPS particles
Temperature profiles were obtained via a thermocouple inserted into 1 mL Au–DPS particles solution that was loaded into a standard 10 mm quartz cuvette. A continuous wave (CW) laser system (808 nm, 1.2 W) with an illumination area of about 2 mm in diameter was used to illuminate the solution. The temperature was recorded by a temperature probe.Cell culture
Human A549 lung cancer cells were cultured in DMEM supplemented with 10% FBS. The cell line was maintained in an incubator at 37 °C, 5% CO2, and 95% humidity.Encapsulation of pDox in Au–DPS particles
The pDox was synthesized by covalently conjugating Dox to the glutamic acid side chains of poly(L-glutamic acid) by a pH-sensitive hydrazone linker. The detailed synthesis process has previously been described.49 In order to improve biocompatibility and pDox loading efficiency, the Au–DPS particles were firstly functionalized with thiol PEG-amine as follows. Au–DPS particles in phosphate buffered saline (PBS; 10 mM) were mixed with thiol PEG-amine aqueous solution (2 μg mL−1) on a shaker for 30 min. Then, pDox–Au–DPS particles were assembled by loading concentrated pDox molecules (>10 mg mL−1 in methanol) into the thiol PEG-amine modified Au–DPS particles followed by the vacuum drying method.49 The loading process was repeated 3 times to fill the nanopores with pDox completely. The loading efficiency was determined by measuring the absorption peak (520 nm) of pDOx in the starting solution and supernatant after loading. To demonstrate pDox release in vitro, pDox–Au–DPS particles were in incubated in phosphate buffer saline (PBS) with or without laser illumination, and the released pDox nanoparticles were collected in the supernatant by centrifugation.Photothermal assisted chemo-photothermal combinatorial therapy in vitro
A549 cells were treated with various concentrations of gold nanoparticles, DPS particles, pDox, pDox–DPS particles, Au–DPS particles, and pDox–Au–DPS particles to assess cytotoxicity. The amount of DPS particles (concentration unit was billion particles per mL (bp per mL)) was also standardized and determined with a Multisizer 4 Coulter Particle Counter. The mass of gold or pDox was determined by the pDox–Au–DPS group. Briefly, 6000 cells were plated in 96-well plates overnight. The cells were then exposed to the particles in fresh media for 12 h, and therapy efficiency was measured using a CCK-8 assay and Synergy H4 hybrid reader (Bio TEK) according to the manufacturer's instructions.LDI-TOF-MS
Au–DPS particles (0.5 μL) were spotted on a target plate and allowed to dry completely. The analytes angiotensin II (1046.5 Da), P14R (1533.9 Da), and ACTH fragment 18-39 (2465.2 Da) were mixed with 0.1% trifluoroacetic acid (TFA) solution (0.1% TFA in water/acetonitrile [1![[thin space (1/6-em)]](https://www.rsc.org/images/entities/char_2009.gif) :
:![[thin space (1/6-em)]](https://www.rsc.org/images/entities/char_2009.gif) 1, v/v]) at femtomole-level concentrations. The analyte solution (10 μL) was deposited and air-dried on the Au–DPS particles substrate on the target plate. α-Cyano-4-hydroxycinnamic acid (CHCA) solution (4 g L−1 in 50% acetonitrile and 0.1% TFA) served as a control matrix and was spotted (0.5 μL) on the target plate and allowed to dry. LDI-TOF-MS spectra were acquired in the positive reflection mode. All testing was performed under high vacuum at or below 10–7 Torr. The acceleration voltage, electron voltage, and lens voltage were 19 kV, 20 kV, and 9.75 kV, respectively, with a delay time of 100 ns. The spectra were calibrated externally using a peptide calibration standard, and raw spectra were processed with flexAnalysis 3.0 (Bruker Daltonics). The limit of detection of different sample molecules was calculated by the dropping amount on the plate.
1, v/v]) at femtomole-level concentrations. The analyte solution (10 μL) was deposited and air-dried on the Au–DPS particles substrate on the target plate. α-Cyano-4-hydroxycinnamic acid (CHCA) solution (4 g L−1 in 50% acetonitrile and 0.1% TFA) served as a control matrix and was spotted (0.5 μL) on the target plate and allowed to dry. LDI-TOF-MS spectra were acquired in the positive reflection mode. All testing was performed under high vacuum at or below 10–7 Torr. The acceleration voltage, electron voltage, and lens voltage were 19 kV, 20 kV, and 9.75 kV, respectively, with a delay time of 100 ns. The spectra were calibrated externally using a peptide calibration standard, and raw spectra were processed with flexAnalysis 3.0 (Bruker Daltonics). The limit of detection of different sample molecules was calculated by the dropping amount on the plate.
Conclusions
In summary, we demonstrated that plasmonic gold nanoparticles could be uniformly synthesized in the pore of DPS particles. The facile process utilized a one-step reaction. The size of Au NPs was controlled by tuning the reactants and capping agent. More importantly, the corresponding SPR can be tunable easily using well-designed DPS particles. Their porous structure ensured the convenience of the process, and the uniformity of resulting Au NPs into a crowded 3D assembly. In our current work, these novel porous 3D plasmonic nanostructures can provide effective heating ability for enhanced chemo-photothermal therapy and ultrasensitive LDI-TOF-MS analysis. Unlike the traditional 3D construction of metal NPs with templates, this one-step-synthesis composite still holds good porous structure, is available for further loading of secondary molecules, and is useful in the sensory or catalysis fields. Except in the photo-thermal process, plasmon-induced hot carriers can also be harvested in the surface-enhanced Raman spectroscopy (SERS) system, which provides a pathway for enhanced signals of adsorbent molecules by the tunable absorption cross-sections of plasmonic nanoparticles. The large specific surface area and hydrophobic indentation structure of porous composites may considerably increase the possibility of a catalytic reaction. Therefore, an efficient plasmonic nanostructure can substantially enhance light absorption and conversion. It will be interesting to develop this particle for use in many fields. Further studies are underway to test and optimize these processes for viable technological applications.Conflicts of interest
There are no conflicts to declare.Acknowledgements
The authors would like to thank Dr Haifa Shen and Guodong Zhang for providing pDOX samples. The authors acknowledge financial support from the following sources: National Natural Science Foundation of China Grant (81571791, 81771965, 31571017), Houston Methodist Research Institute and Houston Methodist Hospital Research Institute AFM/SEM core.Notes and references
- M. L. Brongersma, N. J. Halas and P. Nordlander, Nat. Nanotechnol., 2015, 10, 25–34 CrossRef CAS.
- H. Maeda, Adv. Drug Deliv. Rev., 2015, 91, 3–6 CrossRef CAS PubMed.
- X. Liu, Z. Xie, W. Shi, Z. He, Y. Liu, H. Su, Y. Sun and D. Ge, ACS Appl. Mater. Interfaces, 2019, 11, 19763–19773 CrossRef CAS.
- A. N. St. John and L. A. Lyon, J. Phys. Chem. B, 2008, 112, 11258–11263 CrossRef.
- J. Goldberger, R. Fan and P. Yang, Acc. Chem. Res., 2006, 39, 239–248 CrossRef CAS.
- A. Bell, Science, 2003, 299, 1688–1691 CrossRef CAS.
- W. Han, E. Stepula, M. Philippi, S. Schlücker and M. Steinhart, Nanoscale, 2018, 10, 20671–20680 RSC.
- A. Venuta, J. Wolfram, H. Shen and M. Ferrari, J. Mater. Chem. B, 2017, 5, 207–219 RSC.
- J. Wolfram, H. Shen and M. Ferrari, J. Controlled Release, 2015, 219, 406–415 CrossRef CAS PubMed.
- O. Tacar, P. Sriamornsak and C. R. Dass, J. Pharm. Pharmacol., 2013, 65, 157–170 CrossRef CAS.
- M. Luo, G. Lewik, J. C. Ratcliffe, C. H. J. Choi, E. Mäkilä, W. Y. Tong and N. H. Voelcker, ACS Appl. Mater. Interfaces, 2019, 11, 33637–33649 CrossRef CAS.
- J. Shen, H. Liu, C. Mu, J. Wolfram, W. Zhang, H. C. Kim, G. Zhu, Z. Hu, L. N. Ji, X. Liu, M. Ferrari, Z. W. Mao and H. Shen, Nanoscale, 2017, 9, 5329–5341 RSC.
- M. Reismann, J. Bretschneider, G. Gero von Plessen and U. Simon, Small, 2008, 4, 607–610 CrossRef CAS PubMed.
- S. Okuno, M. Nakano, G. E. Matsubayashi, R. Arakawa and T. Wada, Rapid Commun. Mass Spectrom., 2004, 18, 2811–2817 CrossRef CAS.
- T. R. Northen, O. Yanes, M. T. Northen, D. Marrinucci, W. Uritboonthai, J. Apon, S. L. Golledge, A. Nordström and G. Siuzdak, Nature, 2007, 449, 1033–1036 CrossRef CAS.
- N. Shenar, S. Cantel, J. Martinez and C. Enjalbal, Rapid Commun. Mass Spectrom., 2009, 23, 2371–2379 CrossRef CAS PubMed.
- J. Wei, J. M. Buriak and G. Siuzdak, Nature, 1999, 399, 243–246 CrossRef CAS PubMed.
- H. H. Richardson, M. T. Carlson, P. J. Tandler, P. Hernandez and A. O. Govorov, Nano Lett., 2009, 9, 1139–1146 CrossRef CAS PubMed.
- V. P. Zharov, K. E. Mercer, E. N. Galitovskaya and M. S. Smeltzer, Biophys. J., 2006, 90, 619–627 CrossRef CAS PubMed.
- V. T. Cong, E. O. Ganbold, J. K. Saha, J. Jang, J. Min, J. Choo, S. Kim, N. W. Song, S. J. Son, S. B. Lee and S. W. Joo, J. Am. Chem. Soc., 2014, 136, 3833–3841 CrossRef CAS PubMed.
- H. Liu, Z. Yang, L. Meng, Y. Sun, J. Wang, L. Yang, J. Liu and Z. Tian, J. Am. Chem. Soc., 2014, 136, 5332–5341 CrossRef CAS PubMed.
- S. Linic, P. Christopher and D. B. Ingram, Nat. Mater., 2011, 10, 911–921 CrossRef CAS PubMed.
- A. S. Urban, X. Shen, Y. Wang, N. Large, H. Wang, M. W. Knight, P. Nordlander, H. Chen and N. J. Halas, Nano Lett., 2013, 13, 4399–4403 CrossRef CAS.
- S. Mukherjee, L. Zhou, A. M. Goodman, N. Large, C. Ayala-Orozco, Y. Zhang, P. Nordlander and N. J. Halas, J. Am. Chem. Soc., 2014, 136, 64–67 CrossRef CAS PubMed.
- N. A. Kotov and P. S. Weiss, ACS Nano, 2014, 8, 3101–3103 CrossRef CAS.
- K. Biswas, J. He, I. D. Blum, C. I. Wu, T. P. Hogan, D. N. Seidman, V. P. Dravid and M. G. Kanatzidis, Nature, 2012, 489, 414–418 CrossRef CAS.
- W. L. Noorduin, A. Grinthal, L. Mahadevan and J. Aizenberg, Science, 2013, 340, 832–837 CrossRef CAS PubMed.
- A. Gopinath, S. V. Boriskina, W. R. Premasiri, L. Ziegler, B. M. Reinhard and L. Dal Negro, Nano Lett., 2009, 9, 3922–3929 CrossRef CAS.
- H. Shen, J. You, G. Zhang, A. Ziemys, Q. Li, L. Bai, X. Deng, D. R. Erm, X. Liu, C. Li and M. Ferrari, Adv Healthc Mater, 2012, 1, 84–89 CrossRef CAS.
- G. Zhu, J. T. Liu, Y. Wang, D. Zhang, Y. Guo, E. Tasciotti, Z. Hu and X. Liu, ACS Appl. Mater. Interfaces, 2016, 8, 11881–11891 CrossRef CAS.
- H. Markus, S. Fugleberg, D. Valtakari, T. Salmi, D. Y. Murzin and M. Lahtinen, Chem. Eng. Sci., 2004, 59, 919–930 CrossRef CAS.
- B. Godin, C. Chiappini, S. Srinivasan, J. F. Alexander, K. Yokoi, M. Ferrari, P. Decuzzi and X. Liu, Adv. Funct. Mater., 2012, 22, 4225–4235 CrossRef CAS PubMed.
- X. Cheng, S. B. Lowe, P. J. Reece and J. J. Gooding, Chem. Soc. Rev., 2014, 43, 2680–2700 RSC.
- K. Peng, Y. Wu, H. Fang, X. Zhong, Y. Xu and J. Zhu, Angew. Chem. Int. Ed., 2005, 44, 2737–2742 CrossRef CAS PubMed.
- K. M. Koczkur, S. Mourdikoudis, L. Polavarapu and S. E. Skrabalak, Dalton Trans., 2015, 44, 17883–17905 RSC.
- L. A. Porter, H. C. Choi, A. E. Ribbe and J. M. Buriak, Nano Lett., 2002, 2, 1067–1071 CrossRef CAS.
- C. Ziegler and A. Eychmüller, J. Phys. Chem. C, 2011, 115, 4502–4506 CrossRef CAS.
- G. Frens, Nat. Phys. Sci., 1973, 241, 20 CrossRef CAS.
- R. Weissleder, Nat. Biotechnol., 2001, 19, 316–317 CrossRef CAS.
- Y. Guo, Y. Ma, L. Xu, J. Jun Li and W. Yang, J. Phys. Chem. C, 2007, 111, 9172–9176 CrossRef CAS.
- J. J. Mock, R. T. Hill, A. Degiron, S. Zauscher, A. Chilkoti and D. R. Smith, Nano Lett., 2008, 8, 2245–2252 CrossRef CAS.
- A. Aubry, D. Y. Lei, S. A. Maier and J. B. Pendry, ACS Nano, 2011, 5, 3293–3308 CrossRef CAS PubMed.
- H. Zhang, Y. Zhu, L. Qu, H. Wu, H. Kong, Z. Yang, D. Chen, E. Mäkilä, J. Salonen, H. A. Santos, M. Hai and D. A. Weitz, Nano Lett., 2018, 18, 1448–1453 CrossRef CAS.
- L. A. Wali, K. K. Hasan and A. M. Alwan, Spectrochim. Acta Mol. Biomol. Spectrosc., 2019, 206, 31–36 CrossRef CAS PubMed.
- E. Dulkeith, T. Niedereichholz, T. A. Klar, J. Feldmann, G. von Plessen, D. I. Gittins, K. S. Mayy and F. Caruso, Phys. Rev. B Condens. Matter, 2004, 70, 205424 CrossRef.
- A. O. Govorov and H. H. Richardson, Nano Today, 2007, 2, 30–38 CrossRef.
- G. V. Hartland, Annu. Rev. Phys. Chem., 2006, 57, 403–430 CrossRef CAS.
- K. Jiang, D. A. Smith and A. Pinchuk, J. Phys. Chem. C, 2013, 117, 27073–27080 CrossRef CAS.
- R. Xu, G. Zhang, J. Mai, X. Deng, V. Segura-Ibarra, S. Wu, J. Shen, H. Liu, Z. Hu, L. Chen, Y. Huang, E. Koay, Y. Huang, J. Liu, J. E. Ensor, E. Blanco, X. Liu, M. Ferrari and H. Shen, Nat. Biotechnol., 2016, 34, 414–418 CrossRef CAS.
- B. Godin, E. Tasciotti, X. Liu, R. E. Serda and M. Ferrari, Acc. Chem. Res., 2011, 44, 979–989 CrossRef CAS.
- J. O. Martinez, C. Boada, I. K. Yazdi, M. Evangelopoulos, B. S. Brown, X. Liu, M. Ferrari and E. Tasciotti, Small, 2013, 9, 1722–1733 CrossRef CAS.
- S. Alimpiev, A. Grechnikov, J. Sunner, V. Karavanskii, Y. Simanovsky, S. Zhabin and S. Nikiforov, J. Chem. Phys., 2008, 128, 014711 CrossRef CAS PubMed.
- Z. X. Shen, J. J. Thomas, G. Siuzdak and R. D. Blackledge, J. Forensic Sci., 2004, 49, 1028–1035 CrossRef CAS.
- J. A. McLean, K. A. Stumpo and D. H. Russell, J. Am. Chem. Soc., 2005, 127, 5304–5305 CrossRef CAS PubMed.
Footnote |
| † Electronic supplementary information (ESI) available. See DOI: 10.1039/d0ra03379k |
| This journal is © The Royal Society of Chemistry 2020 |

