 Open Access Article
Concurrent and dual N-doping of graphene/ZnO nanocomposites for enhanced Cr(VI) photoreduction activity under visible-light irradiation
Wen Jia and
Xiaoya Yuan
 *
*
College of Materials Science and Engineering, Chongqing Jiaotong University, Chongqing 400074, China. E-mail: yuanxy@cqjtu.edu.cn
First published on 20th August 2020
Abstract
Simultaneous and dual N-doping of two components in reduced graphene oxide/ZnO nanocomposites were successfully achieved by thermally annealing a GO/Zn(HCO3)2 precursor in an NH3 atmosphere. In this facile preparative procedure, NH3 was used not only as the reagent for in situ reduction of GO but also as the source for N-doping. Detailed characterizations showed that the nitrogen element was successfully and simultaneously incorporated into the crystal lattice of ZnO and graphene phases in the composites and the formation of oxygen vacancies was also achieved. The photocatalytic tests indicated that N-doping of graphene/ZnO (NG/NZO) nanocomposites exhibited the higher Cr(VI) photoreduction activity than graphene/ZnO, virgin N-doped ZnO (NZO) and the sample prepared via simple physically mixing. The mechanistic study demonstrated that the remarkable photocatalytic activity of NG/NZO photocatalysts was due to the synergistic effect of simultaneously N-doping two phases in the composites and the existence of oxygen vacancies, and mainly included the increased electrical conductivity of N-doped graphene (NG), the expansion of visible light harvesting capability of NZO and the effective separation of electron–hole pairs of the oxygen vacancies.
Introduction
Semiconductor-mediated photocatalysis technology has attracted considerable attention for environmental and energy-conversion applications owing to its advantages such as low cost, non-toxic nature, ready availability and reusability of solar energy.1–3 Among various photocatalysts,3–5 although TiO2 is extensively investigated and widely employed, ZnO is believed to exhibit better performance than TiO2 and considered to be an alternative photocatalyst to TiO2 due to its lower cost, higher electron mobility and quantum efficiency.6–8 Unfortunately, pure ZnO as a wide band gap semiconductor (Eg = 3.37 eV) is photo-catalytically active only under UV light irradiation. Therefore visible-light responsive ZnO-based catalysts are highly desirable due to abundant visible-light energy and considerable effort has been made to extend the photo-response of ZnO to the visible light region, including surface modification, semiconductor coupling, band gap modification and non-metal or metal doping.7–9 Among these methods, doping with non-metal elements is a well-established way to shift the threshold absorption of the photocatalysts from the UV region into the visible region.9 In particular, N-doping is thought to be the most suitable doping strategy due to the atomic size and electronegativity of nitrogen being closest to oxygen.7 Numerous NZO as visible-light active photocatalysts have been intensively investigated for removal of organic and metal pollutants.6–9Another well-known drawback about pure ZnO is the fast recombination of photo-induced electron–hole pairs and photo-corrosion effect during the long-time irradiation.9 Several research highlighted that surface modification using materials with delocalized conjugated structures (e.g. graphene,10–13 polyaniline14 and C60 (ref. 15)) could greatly suppress photo-corrosion and improve the photoexcited carrier separation due to the fast electron transfer across the interface of the composites.
Graphene, single-layer carbon atoms densely packed into a two-dimensional, honeycomb lattice, attracted lots of attention due to its unique properties16–18 and potential applications in energy storage materials,19,20 polymer composite materials,21,22 sensors,23 nano-electronics,24 etc. However, the zero band gap of pristine graphene limits its some applications, especially associated with the catalytic properties. Both theoretical and experimental studies have revealed that nitrogen doping provides an effective approach to tailor the electronic property and chemical reactivity of the graphene.25,26 Upon nitrogen doping in the monolayer graphene, the Fermi level shifts above the Dirac point27 and the density of state near the Fermi level is suppressed.28 Therefore, the band gap between the conduction band (CB) and the valence band (VB) will be opened, making NG a promising candidate used in semiconductor devices.29 Meanwhile, NG demonstrated great enhancement of electronic conductivity due to the recovery of the sp2 graphene network and the decrease of defects within the plane associated with nitrogen incorporation, which makes NG a good semiconductor supporter, for example, NG/CdS photocatalyst displayed higher photocatalytic activity than reduced graphene oxide (RGO)/CdS and graphene oxide (GO)/CdS due to the enhanced electron transportation from CdS to NG,30 which also accounted for the remarkable enhanced photo-activities of NG/MoS2 (ref. 31) and NG/ZnSe photocatalysts.32 These results suggest that NG as a candidate component of semiconductor composites considerably improves the photocatalytic performance of the resulting photocatalysts.
It has been reported that nanomaterial hybridized with NG shows considerable performance in a variety of applications, such as in water splitting,30–36 CO2 reduction,36,37 super capacitors and battery devices,38–40 photocatalytic degradation.32,41 However, to our best knowledge, few works has been done on NG/NZO nanocomposites. In this article, we report a facile approach to achieve simultaneous N-doping of two components in RGO/ZnO composites by thermal annealing.
GO/Zn(HCO3)2 precursor in NH3 atmosphere. In this synthetic procedure, NH3 was used not only as the agent for in situ reduction of GO but also as the nitrogen source for N-doping. The photocatalytic activity test indicated that NG/NZO nanocomposites exhibited higher Cr(VI) photoreduction activity than graphene/ZnO, virgin NZO and the sample prepared via their simple physically mixing.
Results and discussion
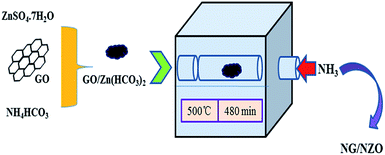
NG/NZO nanocomposites with different graphene loadings were prepared by thermal annealing of GO/Zn(HCO3)2 precursors in NH3 atmosphere as depicted in Scheme 1. In this process, NH3 was used not only as the agent for in situ reduction of GO42 but also as the nitrogen source for simultaneous N-doping of two components of the resulting products.42,43 To demonstrate the successful N-doping of both components, a variety of characterizations were conducted.Characterization of NZ/NZO photocatalysts
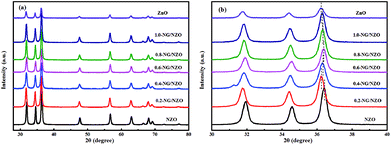
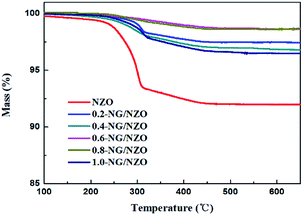
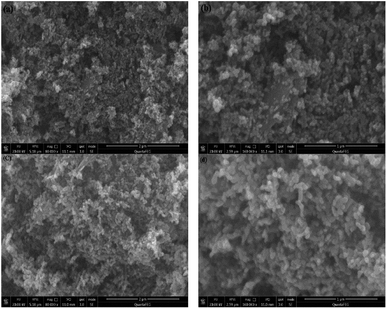
Fig. 1a presents the XRD patterns of bare ZnO, NZO and NG/NZO with different graphene loadings. For bare ZnO, the diffraction peaks at 31.7°, 34.4°, 36.2°, 47.6°, 56.6°, 62.8°, 66.4°, 67.9°, 69.1°, 72.7° and 77.0° were indexed to (100), (002), (101), (102), (110), (103), (200), (112), (201), (004) and (202) facet crystal planes of the ZnO hexagonal wurtzite phase (JCPDS no. 36-1451).44 All the NZO and NG/NZO composites with different graphene loadings exhibited similar XRD patterns to bare ZnO and no other crystallite phases were detected, indicating that the presence of GO or RGO didn't result in the growth of new crystal or changes in preferential orientation of ZnO.12 From Fig. 1b, compared with the three major diffraction peaks of ZnO, including (100), (002) and (101) peaks, all the XRD peaks exhibited red-shift, which showed that the incorporation of nitrogen caused a slight distortion of the lattice.45 It was worth noting that there were no apparent peaks detected for RGO in NG/NZO composites. This might be due to two possible causes. One was the low amount and relatively low diffraction intensity of RGO in the composites, and the other was probably due to the disappearance of the layer-stacking regularity after graphite exfoliation.18TGA curves were used to analyse the content of catalysts. As shown in Fig. 2, there were several stages of weight loss for NZO and NG/NZO nanocomposites, which could be attributed to different substances changes in the air atmosphere. As for NZO, obvious weight loss was observed from 300 to 600 °C, which might be due to decomposition of surface hydroxyl groups.46,47 However, the weight loss from 200 to 350 °C for NG/NZO nanocomposites was due to the burning of N-graphene in air. Compared with NZO sample, NG/NZO nanocomposites were relatively stable. Fig. 3 shows the typical SEM images of (a and b) 0.4-NG/NZO and (c and d) 0.4-physical mixing N-doping of graphene/ZnO (PM-NG/NZO). It was clearly seen that aggregated spherical ZnO nanoparticles with the mean size of several nanometers randomly and densely distributed on graphene sheet in 0.4-NG/NZO nanocomposites (Fig. 3a and b), indicating that GO sheets acted as the substrate for the formation of the ZnO precursor during the chemical precipitation process and good interfacial interaction between NG and NZO phases of the composite. Compared to chemically prepared 0.4-NG/NZO composite, bare ZnO phase of PM-NG/NZO displayed more disordered agglomerates composed of larger diameter size (Fig. 3c and d) and this phenomena was also found in two-dimensional (2D) layered nanocomposites because the planar 2D material provided more substrates for the nuclei formation and the subsequent spatial confinement of the oxide crystalline growth.10–15,44
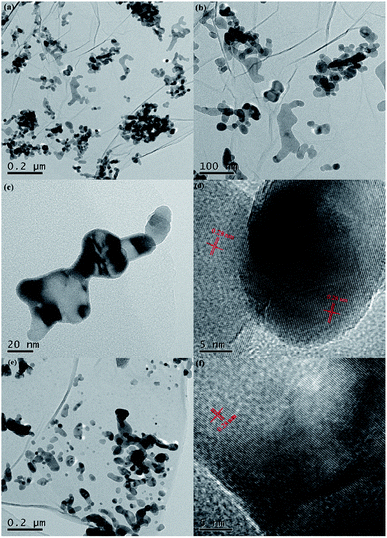
Fig. 4 presents the typical HRTEM images of 0.4-NG/NZO and 0.4-PM-NG/NZO composite. The 2D graphene and ZnO phases were clearly observed from all the HRTEM images of 0.4-NG/NZO and 0.4-PM-NG/NZO composites. From Fig. 4a–c, NZO nanoparticles of irregular sphere-like with the 5–20 nm diameter or interconnected rod-like with the range of 50–200 nm length and 20–50 nm diameter were detected on the surface on NG sheets. Obviously, in some regions from the HRTEM images, graphene sheets acted as a substrate bridge to connect NZO nanoparticles and consequently NG sheets were densely decorated by NZO nanoparticles. Most importantly, most of the NZO particles were found attached on NG sheets, demonstrating that the nuclei and growth of NZO precursors occurred on the surface of GO sheets and subsequent close contact and strong interfacial interactions between NG and ZNO phase in NG/NZO composite were achieved.
From Fig. 4d, the hexagonal wurtzite ZnO phase in NG/NZO composite was identified as the dominant phase because only one kind of lattice fringe with an interplanar distance of 0.28 nm (Fig. 4d) identical to that of in 0.4-PM-NG/NZO composite (Fig. 4f), which was the (100) facet of hexagonal wurtzite ZnO. Furthermore, the graphene sheets were not perfectly flat and showed deformed, silk-like structure with obvious wrinkles (Fig. 4b and e). What is more, compared to that in 0.4-PM-NG/NZO composite where some aggregation of graphene nanosheets could be detected (Fig. 4f), graphene in 0.4-NG/NZO was considerably transparent, indicating that the graphene was very thin probably because colloidal GO sheets used in the precursor preparation process were totally exfoliated in aqueous solution.
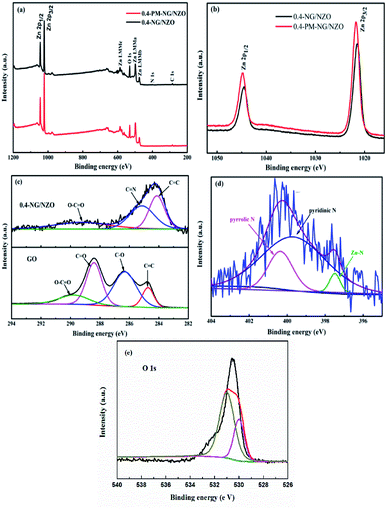
XPS was further conducted to reveal the elemental composition and chemical surrounding of N species in NG/NZO composite. From Fig. 5a, 0.4-NG/NZO and 0.4-PM-NG/NZO composites exhibited similar XPS spectrum profile and the full-scale XPS spectrum confirmed the chemical composition of Zn, O, C and N elements in NG/NZO composite. The XPS peaks at 284.6, 400.6, 532.1, and 1021.5 eV were assigned to the binding energies of C 1s, N 1s, O 1s and Zn 2p, respectively. High-resolution XPS spectra of Zn 2p, C 1s and N 1s are shown in Fig. 5b and c, respectively. The binding energy values of Zn 2p 1/2 and Zn 2p 3/2 in 0.4-NG/NZO composite were observed at 1021.5 and 1044.5 eV, slightly lower than those for 0.4-PM-NG/NZO composites (Fig. 5b). Such shift toward low energy was also found in other reports44,48 and this might be ascribed to the interaction between NG and NZO of the doped composite. The high-resolution C 1s spectra of the original GO (Fig. 5c) could be further deconvoluted into four different peaks at 284.7 (C–C/C![[double bond, length as m-dash]](https://www.rsc.org/images/entities/char_e001.gif) C), 286.3 (C–O), 287.8 (C
C), 286.3 (C–O), 287.8 (C![[double bond, length as m-dash]](https://www.rsc.org/images/entities/char_e001.gif) O) and 289.0 eV (O–C
O) and 289.0 eV (O–C![[double bond, length as m-dash]](https://www.rsc.org/images/entities/char_e001.gif) O),45 indicating that oxygenated groups were abundant either on the basal planes or at the sheet edges of GO and these oxygen species provided active sites for nitrogen doping into graphene framework.42 After treatment at high temperature, the C 1s spectrum profile of 0.4-NG/NZO composite was very different from that of the original GO. The deconvoluted C 1s peaks of GO, especially those assigned to C
O),45 indicating that oxygenated groups were abundant either on the basal planes or at the sheet edges of GO and these oxygen species provided active sites for nitrogen doping into graphene framework.42 After treatment at high temperature, the C 1s spectrum profile of 0.4-NG/NZO composite was very different from that of the original GO. The deconvoluted C 1s peaks of GO, especially those assigned to C![[double bond, length as m-dash]](https://www.rsc.org/images/entities/char_e001.gif) O and C–O, almost disappeared and new C 1s peaks at 285.3 and 289.4 eV corresponding to C
O and C–O, almost disappeared and new C 1s peaks at 285.3 and 289.4 eV corresponding to C![[double bond, length as m-dash]](https://www.rsc.org/images/entities/char_e001.gif) N and C–N in the graphene of 0.4-NG/NZO composite,33 demonstrating that most of the oxygen-containing functional groups of GO were successfully removed and N-doping was achieved upon thermal annealing in NH3 atmosphere.42,49 Dai et al. demonstrated that N-doping of graphene lattice and effective reduction of GO could spontaneously occur for GO annealed in NH3 and oxygen groups on GO sheets were found responsible for reactions with NH3 and C–N bond formation.42 Therefore, the new C 1s peaks manifested the successful N-doping of graphene component in this NG/NZO composite. The weak N 1s peak of 0.4-NG/NZO composite was further fitted into three peaks located at 397.5, 399.7, and 400.4 eV, respectively. The peak at 397.5 eV was ascribed to the anionic N in O–Zn–N linkage, i.e., the doping of N in crystal lattice of ZnO.43,45 The peak at 399.7 eV was due to pyridinic-N, demonstrating the formation of C
N and C–N in the graphene of 0.4-NG/NZO composite,33 demonstrating that most of the oxygen-containing functional groups of GO were successfully removed and N-doping was achieved upon thermal annealing in NH3 atmosphere.42,49 Dai et al. demonstrated that N-doping of graphene lattice and effective reduction of GO could spontaneously occur for GO annealed in NH3 and oxygen groups on GO sheets were found responsible for reactions with NH3 and C–N bond formation.42 Therefore, the new C 1s peaks manifested the successful N-doping of graphene component in this NG/NZO composite. The weak N 1s peak of 0.4-NG/NZO composite was further fitted into three peaks located at 397.5, 399.7, and 400.4 eV, respectively. The peak at 397.5 eV was ascribed to the anionic N in O–Zn–N linkage, i.e., the doping of N in crystal lattice of ZnO.43,45 The peak at 399.7 eV was due to pyridinic-N, demonstrating the formation of C![[double bond, length as m-dash]](https://www.rsc.org/images/entities/char_e001.gif) N bonds at the edges or defects of graphene and the peak at 400.4 eV attributed to pyrrolic-N, where the N atoms were bonded to two carbon atoms incorporated into the five membered heterocyclic rings to contribute two p-orbital electrons to the π system.25 The N content in the doped composite was ∼1.75 at% as estimated from the XPS data. The XPS results indicated that nitrogen was successfully and simultaneously incorporated into the crystal lattice of ZnO and graphene phases in the composite. Additionally, Fig. 5e exhibited the high-resolution XPS spectra of O 1s. The spectrum showed two prominent and well separated transitions at 529.95 and 530.97 eV, which could be attributed to the lattice oxygen and the presence of oxygen vacancies.50–52 The optical properties of NZO, 0.4-PM-NG/NZO and NG/ZNO composites with different graphene loadings were probed by UV-Vis DRS spectroscopy. As shown in Fig. 6a. Bare ZnO prepared by the same method in this study exhibited band edge absorption at about 400 nm, but with little absorption of visible-light (the data was not listed in Fig. 6a). For NZO, it displayed a red-shifted adsorption edge about 410 and its adsorption further extended to visible light region, which was a typical photo-adsorption feature reported for N-doped ZnO, proving that narrowing the band gap of the resulting semiconductor was achieved by N-doping. For all the NG/NZO samples, red-shift adsorption edges were further observed compared to NZO and the trend became more pronounced as the graphene content increased, which suggested that narrowing the band gap of the photocatalysts was straight correlated with the graphene amount. This phenomenon that the graphene or doped graphene affected the band gap of the resulting composites was also found in other reports,31–39,53 probably due to the well-bonded interfaces formed between the semiconductors and the graphene phase in the chemical preparation process.44 Furthermore, compared to bare NZO, all the NG/NZO samples exhibited wide and continuous background absorption in visible light region. Previous studies confirmed introduction of graphene could significantly improve the visible-light response of the semiconductor-based photocatalyst10–14 and these observations demonstrated that the presence of graphene could increase the surface electric charge of the oxides in the composite and thus lead to modifications of the fundamental process of photoinduced electron–hole pair formation. However, in this work, the adsorption intensity was not linear with the graphene content and the maximum absorbance was observed for 0.4-NG/NZO, probably because more graphene could enhance the light scattering and shield the light adsorption. The N-doping amount was probably to be maximum value at the 0.4% GO loading. Considering the correlation of adsorption intensity with the photocatalytic performance under the visible light irradiation, it is not difficult to understand the photocatalytic activity of the NG/NZO composites in Cr(VI) reduction because the absorbance in visible light range followed in the order: 1.0-NG/NZO < 0.8-NG/NZO < 0.6-NG/NZO < 0.2-NG/NZO < 0.4-NG/NZO. These results demonstrated that the as-synthesized NG/NZO could be visible-light-driven photocatalysts with superior catalytic performance.
N bonds at the edges or defects of graphene and the peak at 400.4 eV attributed to pyrrolic-N, where the N atoms were bonded to two carbon atoms incorporated into the five membered heterocyclic rings to contribute two p-orbital electrons to the π system.25 The N content in the doped composite was ∼1.75 at% as estimated from the XPS data. The XPS results indicated that nitrogen was successfully and simultaneously incorporated into the crystal lattice of ZnO and graphene phases in the composite. Additionally, Fig. 5e exhibited the high-resolution XPS spectra of O 1s. The spectrum showed two prominent and well separated transitions at 529.95 and 530.97 eV, which could be attributed to the lattice oxygen and the presence of oxygen vacancies.50–52 The optical properties of NZO, 0.4-PM-NG/NZO and NG/ZNO composites with different graphene loadings were probed by UV-Vis DRS spectroscopy. As shown in Fig. 6a. Bare ZnO prepared by the same method in this study exhibited band edge absorption at about 400 nm, but with little absorption of visible-light (the data was not listed in Fig. 6a). For NZO, it displayed a red-shifted adsorption edge about 410 and its adsorption further extended to visible light region, which was a typical photo-adsorption feature reported for N-doped ZnO, proving that narrowing the band gap of the resulting semiconductor was achieved by N-doping. For all the NG/NZO samples, red-shift adsorption edges were further observed compared to NZO and the trend became more pronounced as the graphene content increased, which suggested that narrowing the band gap of the photocatalysts was straight correlated with the graphene amount. This phenomenon that the graphene or doped graphene affected the band gap of the resulting composites was also found in other reports,31–39,53 probably due to the well-bonded interfaces formed between the semiconductors and the graphene phase in the chemical preparation process.44 Furthermore, compared to bare NZO, all the NG/NZO samples exhibited wide and continuous background absorption in visible light region. Previous studies confirmed introduction of graphene could significantly improve the visible-light response of the semiconductor-based photocatalyst10–14 and these observations demonstrated that the presence of graphene could increase the surface electric charge of the oxides in the composite and thus lead to modifications of the fundamental process of photoinduced electron–hole pair formation. However, in this work, the adsorption intensity was not linear with the graphene content and the maximum absorbance was observed for 0.4-NG/NZO, probably because more graphene could enhance the light scattering and shield the light adsorption. The N-doping amount was probably to be maximum value at the 0.4% GO loading. Considering the correlation of adsorption intensity with the photocatalytic performance under the visible light irradiation, it is not difficult to understand the photocatalytic activity of the NG/NZO composites in Cr(VI) reduction because the absorbance in visible light range followed in the order: 1.0-NG/NZO < 0.8-NG/NZO < 0.6-NG/NZO < 0.2-NG/NZO < 0.4-NG/NZO. These results demonstrated that the as-synthesized NG/NZO could be visible-light-driven photocatalysts with superior catalytic performance.
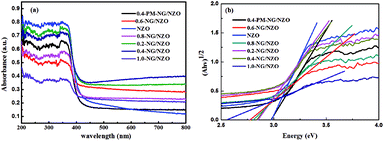 | ||
| Fig. 6 UV-Vis DRS spectra of (a) NZO, 0.4-PM-NG/NZO and NG/NZO with different graphene loadings and (b) plots of (αhv)1/2 versus hv of composites. | ||
Meanwhile, the band gap of NG/NZO composites was estimated by the equation: (αhv)1/2 = A(hv − Eg), the energy of band gap (Eg) was calculated, where α, hv and A are the absorption coefficient, photon energy and a constant.54 As indicated in Fig. 6b, the estimated band gaps of NZO, 0.2-NG/NZO, 0.4-NG/NZO, 0.6-NG/NZO, 0.8-NG/NZO, 1.0-NG/NZO and 0.4-PM-NG/NZO were 2.98 eV, 2.86 eV, 2.85 eV, 2.77 eV, 2.80 eV, 2.57 eV and 2.97 eV, respectively. These results further confirmed that introduction of graphene could narrow the band gap of the photocatalysts, which potentially facilitated the rapid transmission of photo-generated charge carriers.55 According to previous reports by researchers, oxygen vacancies could also narrow the band gap and increase the light absorption range of the catalyst, thus the performance of photocatalytic was significantly enhanced.56,57 It was generally believed that the migration direction of photo-generated carriers depended on the position of the band edge of the semiconductor.58 Therefore, theoretical prediction of conduction band (CB) and valence band (VB) for NZO and 0.4-NG/NZO were reckoned by equations: where X is the electronegativity of the semiconductor (5.79 eV), Ee is the energy of free electrons on the hydrogen scale (about 4.5 eV) and Eg is the band gap energy of a semiconductor.59 The CB and VB edge positions for NZO and 0.4-NG/NZO were listed in Table 1, which was conducive to the subsequent mechanism analysis.
| EVB = X − Ee + 1/2Eg | (1) |
| ECB = EVB − Eg | (2) |
| Sample | Eg (eV) | Ee (eV) | EVB (eV) | ECB (eV) |
|---|---|---|---|---|
| NZO | 2.98 | 4.50 | 2.78 | −0.20 |
| 0.4-NG/NZO | 2.85 | 4.50 | 2.72 | −0.13 |
The separation efficiency of photo-generated electron–hole pairs is usually evaluated via PL spectra. Fig. 7a showed PL spectra of 0.4-PM-NG/NZO and 0.4-NG/NZO photocatalysts. Compared with the 0.4-PM-NG/NZO sample, 0.4-NG/NZO nanocomposites exhibited evidently lower PL intensity, indicating its higher separation rate of the photoexcited charge carries, thus the higher photocatalytic performance. Transient photocurrent responses were investigated for 0.4-PM-NG/NZO and 0.4-NG/NZO photocatalysts. It was found that there was an extreme obvious peak at around 520 nm, which was attributed to oxygen defects in the PL spectrum.60 Many researchers had reported the existence of oxygen vacancies in the fluorescence spectrum. Such as, Guo et al. found the center of photoluminescence caused by VO depends on the initial states of EM, and 2.6 eV is minimum excitation energy for the PL centered at 530 nm.60 Wu et al. reported that the green luminescence attributed to the oxygen vacancy and assigned the location centred at about 530 nm.61 Vanheusden et al. observed a strong correlation between the green 510 nm emission by combining optical absorption, and photoluminescence spectroscopy.62 Therefore, the existence of oxygen defects in the N-doped ZnO system was proved, which was also beneficial to the rapid transfer of photo-generated carriers.63
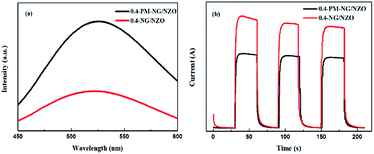 | ||
| Fig. 7 (a) PL spectra of 0.4-PM-NG/NZO and 0.4-NG/NZO photocatalysts and (b) photocurrent responses of 0.4-PM-NG/NZO and 0.4-NG/NZO photocatalysts under visible-light irradiation. | ||
As shown in Fig. 7b, the 0.4-NG/NZO sample showed a steady photocurrent generation under simulated solar irradiation and exhibited much enhanced photocurrent intensity in comparison to that of the 0.4-PM-NG/NZO. Combined with the PL and photocurrent responses results, these analyses obviously demonstrated that the N-doped and the loading of graphene could improve the carrier mobility.
Photocatalytic activity of aqueous Cr(VI) reduction under visible-light irradiation
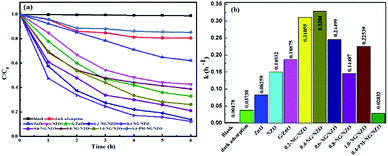
Fig. 8 presents the photocatalytic activity of aqueous Cr(VI) reduction over various samples under visible light irradiation. From Fig. 8a, blank test was carried out without any catalysts under light exposure and there was no obvious changes of Cr(VI) concentration, suggesting that direct photolysis didn't induce the reduction of aqueous Cr(VI). In dark adsorption trial, adsorption equilibrium was observed within 4 h for 0.4-NG/NZO nanocomposites and thus the 18.1% adsorption removal ratio of Cr(VI) was calculated. With an initial Cr(VI) concentration of 40 mg L−1, NZO exhibited 53.6% photoreduction ratio of Cr(VI) within 6 h of visible light irradiation, higher than bare ZnO (37.2%), indicating that N-doping could improve the photocatalytic performance of ZnO catalyst.7 Moreover, the photocatalytic activity of G/ZnO toward Cr(VI) reduction was increased to 69.4%, further demonstrating that modification of graphene was an effective method to improve the visible-light driven photocatalytic performance of ZnO-based semiconductors.12 Notably, compared to those of bare NZO and ZnO, the reduction of aqueous Cr(VI) proceeded quite rapidly in the presence of NG/NZO photocatalysts, strongly suggesting that simultaneous N-doping into the lattice of graphene and ZnO phases of the nanocomposites could greatly enhance the photocatalytic activity of NG/NZO photocatalysts. Nevertheless, the photocatalytic activities of NG/NZO nanocomposites of various graphene/ZnO mass ratios differed greatly. After 6 h of visible light irradiation, the photoreduction ratios of aqueous Cr(VI) over 0.2-NG/NZO, 0.4-NG/NZO, 0.6-NG/NZO, 0.8-NG/NZO and 1.0-NG/NZO were found to be 86.4%, 89.0%, 79.0%, 61.2% and 73.9%, respectively. These results obviously indicated that the graphene loading played an important role in determining the photocatalytic reduction activity of as-prepared NG/NZO samples under visible light. Up to an amount of 0.4 wt% of graphene, the photoreduction activity of the NG/NZO photocatalysts increased remarkably, with increasing the loading of graphene and N-doping and the presence of oxygen vacancies, which could be attributed to the increasing conductivity and the expansion of visible light range, thus accelerating carrier mobility. However, their photocatalytic activities decreased gradually when the graphene loading exceeded 0.4%. Similar phenomenon about the photocatalytic activity dependent on the graphene loading were also observed in several reports31,44,64 and this was probably because excessive graphene nanosheets could block the absorption of incident illumination and thus reduce the efficiency of charge separation, which was supported by UV-Vis DRS spectra of NG/ZNO composites shown in Fig. 6.In general, the photocatalytic reactions should follow the pseudo-first-order kinetics model: −ln(C/C0) = kt, where k and t are the apparent reaction rate constant and irradiation time, C and C0 were the concentrations of reactant at time t and 0, respectively.65 As displayed in Fig. 8b, the corresponding k values for the photoreduction of Cr(VI) 0.2-NG/NZO, 0.4-NG/NZO, 0.6-NG/NZO, 0.8-NG/NZO, 1.0-NG/NZO and 0.4-PM-NG/NZO, were calculated to be 0.31055, 0.32840, 0.24499, 0.14487, 0.22539 and 0.02832 h−1, respectively, which revealed the photocatalytic efficiency of 0.4-NG/NZO was about 11.5 times higher than that of 0.4-PM-NG/NZO. These results emphasized the important role of graphene loading and N-doped in photoreduction of Cr(VI) under visible light and promoted the migration of electrons.
Mechanism for photoreduction Cr(VI) removal
Based on the systematic investigation, the removal mechanism for Cr(VI) over NG/NZO composites under visible light illumination was proposed as shown in Fig. 9. Firstly, NZO composite was photoexcited under visible light of energy higher than its band gap, generating electron–hole pairs. And oxygen vacancies not only acted as the centers to capture electrons that enhance the separation efficiency of electron–hole pairs but also accelerated the charge carriers transport, leading to an enhanced photo-activity. Thus, Cr(VI) was rapidly adsorbed onto the surface of NZO composites and interacted with electrons to reduce Cr(III). Afterwards, it was considerable that introduction of GO, which provided many active sites to promote the migration more electrons at the CB position of NZO to the NG surface. This transfer facilitated the electron–hole pairs separation, thence greatly promoting the photocatalytic reduction of the Cr(VI) solution.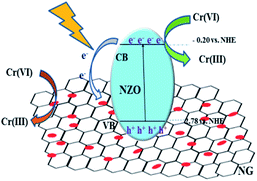 | ||
| Fig. 9 Mechanism for of Cr(VI) removal catalyzed by NG/NZO composites under visible light irradiation. | ||
Experimental
Preparation of NG/NZO
The precursor GO/Zn(HCO3)2 with different theoretical loadings of GO was prepared by a procedure similar to our previous work.66 In brief, ZnSO4·7H2O (21.57 g) dissolved in 100 mL H2O and different volume of GO solution was added. Then the solution was ultrasonicated for another 30 min to ensure the uniform adsorption of Zn2+ onto the surface of GO nanosheets. Aqueous solution (50 mL) containing NH4HCO3 (12.45 g) was added dropwise into the above solution at 60 °C under vigorous stirring within 10 min. Afterward, this mixture solution was kept stirring for 4 h. The black precipitate GO/Zn(HCO3)2 was collected by vacuum filtration, washed several times and dried in vacuum oven at 60 °C for 24 h. Finally, this product was calcined at 500 °C for 8 h under NH3 atmosphere to give the powder NG/NZO nanocomposites. The as-prepared NG/NZO samples with 0.2%, 0.4%, 0.6%, 0.8% and 1.0% theoretical mass weight of GO based on ZnO in the composites were named as 0.2-NG/NZO, 0.4-NG/NZO, 0.6-NG/NZO, 0.8-NG/NZO and 1.0-NG/NZO, respectively.For comparison, bare ZnO and NZO were prepared with the same procedure without the use of GO and their annealing was done in N2 and NH3 atmosphere, respectively. RGO/ZnO composite was also prepared by the identical procedure with the final calcination done in N2 atmosphere. Pure NG was prepared via thermal annealing of GO powder at 500 °C for 8 h under NH3 atmosphere. Physically mixed composite composed of 0.4% weight amount of NG based on NZO (0.4-PM-NG/NZO) was prepared by physically mixing NG and NZO in ethanol.
Characterization
Scanning electron microscopy (SEM) images were obtained with a Hitachi SU8020 scanning electron microscope with acceleration voltage of 20 kV. High-resolution transmission electron microscopy (HRTEM) was performed on a FEI Tecnai G2 F20 field-emission transmission electron microscopy at an accelerating voltage of 200 kV. The powder X-ray diffraction (XRD) patterns were recorded on a PANalytical X'Pert Pro powder diffractmeter with Cu-Kα radiation (λ = 1.5418 Å) with a scan step of 0.013°. X-ray photoelectron spectroscopy (XPS) measurements were performed on a Thermo Fisher ESCALAB 250 Xi photoelectron spectrometer using monochromatic Al Kα X-ray source (hν = 1486.6 eV). Thermo Gravimetric Analysis (TGA) was carried out in air on Netzsch STA 449 C thermo gravimetric analyzer at a heating rate of 10 °C min−1. UV-Vis diffuse reflectance spectroscopy (DRS) was carried out on a Hitach UV-4100 UV-Vis spectrophotometer using BaSO4 as the reference sample. The photoluminescence spectra (PL) were measured with a fluorescence spectrophotometer (F-7000, Japan) using a Xe lamp as excitation source with optical filters. Photocurrent response was detected by linear sweep voltammetry (LSV) in 0.2 M Na2SO4 solution using 300 W xenon lamps as light source.Photocatalytic experiments
The photocatalytic activity of NG/NZO composites was evaluated by photoreduction of aqueous Cr(VI) under visible light and all the experiments were conducted in a BILON-GHX-V photochemical reactor (Shanghai Bilon Instruments Manufacture Co., Ltd) with a 500 W Xenon lamp with maximum wavelength emission at 470 nm as the visible-light source. In each run, 50 mL aqueous Cr(VI) solutions of different concentration in the presence of the photocatalysts were maintained. The initial solution pH was adjusted by 0.01 mol L−1 HCl aqueous or 0.01 mol L−1 NaOH solutions. Prior to irradiation, the mixture solution was magnetically stirred for 60 min in the dark to ensure the adsorption–desorption equilibrium. The concentration of Cr(VI) after equilibration was measured and taken as the initial concentration (C0) to discount the adsorption in the dark. During the irradiation, 4 mL of the reaction solution was withdrawn at certain time intervals and centrifuged to separate the photocatalyst from the solution. The Cr(VI) concentration in the supernatant solution was determined spectrophotometrically at 540 nm using the diphenylcarbazide method44 (UV-1000 UV-Vis spectrophotometer, Shanghai Spectrum Instruments Co., Ltd). For comparison, the blank experiments to test the Cr(VI) stability under irradiation without any photocatalysts and the dark experiments to test the physical adsorption capacity of the photocatalysts were conducted with no irradiation under the identical conditions.Conclusions
In summary, NG/NZO nanocomposites were successfully prepared via a facile approach to achieve simultaneous N-doping of two components in RGO/ZnO composites by thermal annealing GO/Zn(HCO3)2 precursor in NH3 atmosphere. The photocatalytic activity test indicated that NG/NZO nanocomposites exhibited higher Cr(VI) photoreduction activity than graphene/ZnO, virgin NZO and the sample prepared via their simple physically mixing. The improvement of photocatalytic performance was derived from the synergy effect of bi-component N-doping and the existence of oxygen vacancies, which could be attributed to the increased electrical conductivity of NG, the narrowed band gap energy by oxygen vacancies and the expansion of visible light absorption range by NZO, thereby accelerating hugely photo-generated carrier mobility. This paper not only synthesized NG/NZO photocatalysts also provided new synthesis methods, which exhibited potential applications for water treatment and environmental remediation.Conflicts of interest
There are no conflicts to declare.Acknowledgements
The authors would like to gratefully acknowledge the financial supports from the National Natural Science Foundation of China (no. 51402030), Natural Science Foundation of the Chongqing Science and Technology Commission (cstc2017jcyjBX0028), Science and Technology Research Program of Chongqing Municipal Education Commission (KJZD-K201800703) and Chongqing Ecology and Environment Bureau (2019-127).Notes and references
- H. Wang, L. Zhang, Z. Chen, J. Hu, S. Li, Z. Wang, J. Liu and X. Wang, Chem. Soc. Rev., 2014, 43, 5234 RSC.
- M. R. Hoffmann, S. T. Martin, W. Choi and D. W. Bahnemann, Chem. Rev., 1995, 95, 69–96 CrossRef CAS.
- X. Chen, S. Shen, L. Guo and S. S. Mao, Chem. Rev., 2010, 110, 6503–6570 CrossRef CAS PubMed.
- A. D. Paola, E. García-López, G. Marcì and L. Palmisano, J. Hazard. Mater., 2003, 99, 3–29 Search PubMed.
- M. M. Khin, A. S. Nair, V. J. Babu, R. Murugan and S. Ramakrishna, Energy Environ. Sci., 2012, 5, 8075 RSC.
- L. Jing, W. Zhou, G. Tian and H. Fu, Cheminform, 2013, 42, 9509–9549 CAS.
- S. Rehman, R. Ullah, A. M. Butt and N. D. Gohar, Cheminform, 2010, 170, 560–569 Search PubMed.
- S. G. Kumar and K. S. R. K. Rao, RSC Adv., 2015, 5, 3306–3351 RSC.
- K. M. Lee, C. W. Lai, K. S. Ngai and J. C. Juan, Water Res., 2016, 88, 428–448 CrossRef CAS PubMed.
- Z. Xun, T. Shi and H. Zhou, Appl. Surf. Sci., 2012, 258, 6204–6211 CrossRef.
- Y. Zhang, Z. Chen, S. Liu and Y. J. Xu, Appl. Catal., B, 2013, 140–141, 598–607 CrossRef CAS.
- X. Liu, L. Pan, Q. Zhao, L. Tian, G. Zhu, T. Chen, T. Lu, S. Zhuo and C. Sun, Chem. Eng. J., 2012, 183, 238–243 CrossRef CAS.
- X. Tongguang, Z. Liwu, C. Hanyun and Z. Yongfa, Appl. Catal., B, 2011, 101, 382–387 CrossRef.
- H. Zhang, R. Zong and Y. Zhu, J. Phys. Chem. C, 2014, 113, 4605–4611 CrossRef.
- F. U. Hongbo, X. U. Tongguang, S. Zhu and Y. Zhu, Environ. Sci. Technol., 2008, 42, 8064–8069 CrossRef PubMed.
- A. K. Geim, Science, 2009, 324, 1530–1534 CrossRef CAS PubMed.
- Z. Yanwu, M. Shanthi, C. Weiwei and L. Xuesong, ChemInform, 2010, 22, 3906–3924 Search PubMed.
- K. P. Loh, Q. Bao, P. K. Ang and J. Yang, J. Mater. Chem., 2010, 20, 2277–2289 RSC.
- N. G. Sahoo, Y. Pan, L. Lin and S. H. Chan, Adv. Mater., 2012, 24, 4203–4210 CrossRef CAS PubMed.
- V. Chabot, D. Higgins, A. P. Yu, X. C. Xiao, Z. W. Chen and J. J. Zhang, Energy Environ. Sci., 2014, 7, 1564–1596 RSC.
- R. Sengupta, M. Bhattacharya, S. Bandyopadhyay and A. K. Bhowmick, Prog. Polym. Sci., 2011, 36, 638–670 CrossRef CAS.
- J. R. Potts, D. R. Dreyer, C. W. Bielawski and R. S. Ruoff, Polymer, 2011, 52, 5–25 CrossRef CAS.
- Y. Shao, J. Wang, W. Hong, J. Liu, I. A. Aksay and Y. Lin, Electroanalysis, 2010, 22, 1027–1036 CrossRef CAS.
- S. Bhandari, G. H. Lee, A. Klales, K. Watanabe, T. Taniguchi, E. Heller, P. Kim and R. M. Westervelt, Nano Lett., 2016, 16, 1690 CrossRef CAS PubMed.
- T. Maiyalagan, X. Wang and H. Wang, ACS Catal., 2012, 2, 781–794 CrossRef.
- H. Wang, M. Xie, L. Thia, A. Fisher and X. Wang, J. Phys. Chem. Lett., 2014, 5, 119–125 CrossRef CAS PubMed.
- A. Lherbier, X. Blase, Y. M. Niquet, F. o. Triozon and S. Roche, Phys. Rev. Lett., 2010, 101, 036808 CrossRef PubMed.
- M. Deifallah, P. F. Mcmillan and F. Corà, J. Phys. Chem. C, 2008, 112, 5447–5453 CrossRef CAS.
- Q. Xiang, J. Yu and M. Jaroniec, Chem. Soc. Rev., 2012, 41, 782–796 RSC.
- L. Jia, D.-H. Wang, Y.-X. Huang, A.-W. Xu and H.-Q. Yu, J. Phys. Chem. C, 2011, 115, 11466–11473 CrossRef CAS.
- F. Meng, J. Li, S. K. Cushing, M. Zhi and N. Wu, J. Am. Chem. Soc., 2013, 135, 10286–10289 CrossRef CAS PubMed.
- C. Ping and Y. Tian, ACS Nano, 1989, 6, 712–719 Search PubMed.
- Z. Mou, Y. Wu, J. Sun, P. Yang, Y. Du and C. Lu, ACS Appl. Mater. Interfaces, 2014, 6, 13798–13806 CrossRef CAS PubMed.
- L.-L. Wan, G.-L. Zang, X. Wang, L.-A. Zhou, T. Li and Q.-X. Zhou, J. Power Sources, 2016, 345, 41–49 CrossRef.
- A. Bhirud, S. Sathaye, R. Waichal, C.-J. Park and B. Kale, J. Mater. Chem. A, 2017, 345, 41–49 Search PubMed.
- J. Liang and L. Li, J. Mater. Chem. A, 2017, 5, 19934–19942 RSC.
- L.-Y. Lin, Y. Nie, S. Kavadiya, T. Soundappan and P. Biswas, Chem. Eng. J., 2017, 316, 449–460 CrossRef CAS.
- W. Zhao and C. M. Li, J. Colloid Interface Sci., 2006, 488, 356–364 CrossRef PubMed.
- G.-Z. Wang, J.-M. Feng, L. Dong, X.-F. Li and D.-J. Li, Appl. Surf. Sci., 2017, 396, 269–277 CrossRef CAS.
- Z. Wen, X. Wang, S. Mao, Z. Bo, H. Kim, S. Cui, G. Lu, X. Feng and J. Chen, Adv. Mater., 2012, 24, 5610–5616 CrossRef CAS PubMed.
- X. Ying, M. Yanping, T. Jing and W. Ping, Appl. Catal., B, 2016, 181, 810–817 CrossRef.
- X. Li, H. Wang, J. T. Robinson, H. Sanchez, G. Diankov and H. Dai, J. Am. Chem. Soc., 2012, 131, 15939–15944 CrossRef PubMed.
- Z. Yu, L.-C. Yin, Y. Xie, G. Liu, X. Ma and H.-M. Cheng, J. Colloid Interface Sci., 2013, 400, 18–23 CrossRef CAS PubMed.
- X. Yuan, C. Zhou, Q. Jing, Q. Tang, Y. Mu and A. K. Du, Nanomaterials, 2016, 6, 173 CrossRef PubMed.
- I. M. P. Silva, G. Byzynski, C. Ribeiro and E. Longo, J. Mol. Catal. A: Chem., 2016, 417, 89–100 CrossRef CAS.
- H. Sudrajat and S. Babel, J. Water Process. Eng., 2106, 16, 309–318 CrossRef.
- A. Aimable, M. T. Buscaglia, V. Buscaglia and P. Bowen, J. Eur. Ceram. Soc., 2010, 30, 591–598 CrossRef CAS.
- S. Kumar, A. Baruah, S. Tonda, B. Kumar, V. Shanker and B. Sreedhar, Nanoscale, 2014, 6, 4830 RSC.
- D. Long, W. Li, L. Ling, J. Miyawaki, I. Mochida and S. H. Yoon, Langmuir, 2011, 26, 16096–16102 CrossRef PubMed.
- D. Zhang, H. Liu, C. Su, H. Li and Y. Geng, Sep. Purif. Technol., 2019, 218, 1–7 CrossRef CAS.
- C. Hua, X. Dong, Y. Wang, N. Zheng, H. Ma and X. Zhang, J. Mater. Sci., 2019, 54, 9397–9413 CrossRef CAS.
- Z. Zhang, W. Wang, E. Gao, M. Shang and J. Xu, J. Hazard. Mater., 2011, 196, 255–262 CrossRef CAS PubMed.
- L. K. Putri, W. J. Ong, W. S. Chang and S. P. Chai, Appl. Surf. Sci., 2015, 358, 2–14 CrossRef CAS.
- X. Xia and J. Di, RSC Adv., 2013, 4, 82–90 RSC.
- W. Lin, Y. Xiang, Z. Yi and Y. Zhang, Front. Chem., 2018, 6, 274 CrossRef PubMed.
- D. Fan, T. Xiong, Y. Shuai, H. Wang, Y. Sun, Y. Zhang, H. Huang and Z. Wu, J. Catal., 2016, 344, 401–410 CrossRef.
- F. Lei, Y. Sun, K. Liu, G. Shan, L. Liang, B. Pan and X. Yi, J. Am. Chem. Soc., 2014, 136, 6826–6829 CrossRef CAS PubMed.
- C. Zheng, C. Cao and Z. Ali, Phys. Chem. Chem. Phys., 2015, 17, 13347 RSC.
- D. Fan, Appl. Catal., B, 2018, 239, 619–627 CrossRef.
- S. Guo, Photonics & Optoelectronics. IEEE, 2012 Search PubMed.
- B. Lin, Z. Fu and Y. Jia, Appl. Phys. Lett., 2012, 100, 943 Search PubMed.
- K. Vanheusden, C. H. Seager, W. L. Warren, D. R. Tallant and J. A. Voigt, Appl. Phys. Lett., 1996, 68, 403–405 CrossRef CAS.
- X.-j. Wang, Y. Zhao, F.-t. Li, L.-j. Dou, Y.-p. Li, J. Zhao and Y.-j. Hao, Sci. Rep., 2016, 6, 24918 CrossRef CAS PubMed.
- Y. J. Yuan, D. Q. Chen, X. F. Shi, J. R. Tu, B. Hu, N. X. Yang, Z. T. Yu and Z. G. Zou, Chem. Eng. J., 2016, 313, 1438–1446 CrossRef.
- J. Liu, H. Li, N. Du, S. Song and W. Hou, RSC Adv., 2014, 4, 31393 RSC.
- X. Yuan, D. Peng, Q. Jing, J. Niu and X. Wu, Nanomaterials, 2018, 8, 654 CrossRef PubMed.
| This journal is © The Royal Society of Chemistry 2020 |

