 Open Access Article
The role of Mg value and moisture content of decomposed products during the decomposition process of carnallite in aqueous solution: a novel monitoring method
Huaide Cheng *ab,
Qingyu Haiab,
Jianguo Songabc,
Xuehai Maabc and
Changzhong Liabc
aKey Laboratory of Comprehensive and Highly Efficient Utilization of Salt Lake Resources, Qinghai Institute of Salt Lake, Chinese Academy of Sciences, Xining 810008, China. E-mail: chenghuaide@isl.ac.cn; Fax: +86 971 6306002; Tel: +86 971 6301694
bKey Laboratory of Salt Lake Geology and Environment of Qinghai Province, Xining 810008, China
cUniversity of Chinese Academy of Sciences, Beijing 100049, China
First published on 29th May 2020
Abstract
The amount of water is the crucial factor for the decomposition of carnallite in aqueous solution. A novel method for monitoring the decomposition process of carnallite in aqueous solution based on the Mg value and moisture content of the decomposed products was investigated in this study. Based on the principle of mass conservation of MgCl2 during the decomposition of carnallite in aqueous solution, a functional model of Mg value in decomposed products was established. The functional model of moisture content in decomposed products was obtained by the water equilibrium condition of the reaction system. The experiments were performed by dissolving carnallite in aqueous solution under different water conditions, and the Mg value and moisture content were determined for the decomposed products. The results showed that: (1) the Mg value and moisture content of the decomposed products have a nonlinear variation when the amount of water used to dissolve carnallite is not suitable, and (2) an excess amount of water used to dissolve carnallite would lead to a linear change in the Mg value and moisture content of the decomposed products. It was found that the intersection of these two changes is the appropriate location for the decomposition of carnallite in aqueous solution. The Mg value and moisture content of the decomposed products are thus presented as a novel monitoring method for these applications within the potash processing industry.
1. Introduction
Potassium chloride (KCl) is one of the most important fertilizers to facilitate plant growth,1–3 promote pest and disease resistance, and improve the ability of plants to absorb and retain water and produce more crops.4,5 Moreover, it is the main osmotic potential contributor due to its abundance in the cells.6 A source of KCl is the carnallite double salt, which has the composition KCl·MgCl2·6H2O or KMgCl3·6H2O, and is either obtained as the ore or recovered from brine that favors carnallite.7–9 Carnallite is treated with fresh water to dissolve MgCl2 and keep KCl in the crystalline state. Then, KCl flotation from the mixed salts is carried out using an amine as the collector. If the amount of water is not sufficient, the carnallite cannot be completely decomposed. In this case, KCl will be lost as carnallite in the tailings during the KCl flotation. If too much water is added, then some KCl will be dissolved during the decomposition stage. Therefore, the amount of water is a crucial factor for the decomposition of carnallite in an aqueous solution.7Some studies have investigated the process of the decomposition of carnallite in an aqueous solution.7,9–16 When the carnallite is decomposed by adding appropriate fresh water, MgCl2 goes into the solution, and then KCl crystallizes. The process occurs in a suspension and can be represented as
 | (1) |
However, if only a small amount of water is added, the carnallite cannot completely decompose in the aqueous solution. The process occurs in a suspension and can be represented as
 | (2) |
If the addition of water is too much, some KCl will be dissolved during the decomposition of the carnallite. The process occurs in a suspension and can be represented as
 | (3) |
The process parameters of the material ratio, water addition, and operating temperature are sensitivity for the objective of product purity and recovery.8 From the reactions of eqn (1)–(3), we found that the amount of water is critical to the decomposition process of carnallite in an aqueous solution. Usually, the detection and assessment of the reactive process of carnallite decomposition are operated by analyzing the entire chemical compositions of E(L) or F(L). However, the experimental determination of this process is very time consuming, and moreover the collection of samples of E(L) or F(L) needs to have a certain statistical approach.
After the reactions of eqn (1)–(3) have been completed, the wet products containing mother liquor, here defined as the decomposed products (DPs), were obtained by separating using vacuum filtration. From eqn (1) to (3), we found that the DPs contains the mother liquor (ML) of E(L) or F(L) and decomposed solid products (DSPs). (Here, DSPs contain halite, sylvite and/or un-decomposed carnallite.) In this study, we attempted to establish the relationship between the Mg value and moisture content of DPs, due to the Mg concentration and H2O content of E(L) or F(L) having a specific value at a desired temperature.7 The objectives were to investigation the decomposition process of carnallite with different water conditions through dissolving experiments and the feasibility of monitoring the decomposition process of carnallite in an aqueous solution through a strategy of Mg value and the moisture content of the DPs.
2. Experimental
2.1 Materials
A sample of carnallite was taken from the drilling core of Vientiane potash deposits in Laos. Its composition (Table 1) indicates that the carnallite is pure. The content of water-insoluble material in the carnallite was less than 0.5%. Standard glassware was used in all the experiments. Double distilled water was used in all the experiments, as well as for the analytical measurements. Whenever heating was required, a super constant temperature water-bath (HH-501, Shanghai Qiqian Electronic Technology Co. Ltd., China) was used. The solid phases were obtained by vacuum filter (SHZ-3 circulating water vacuum pump, Shanghai Yarong Biochemistry Factory, China) separation. Whenever agitating was required, an agitator (IKA Eurostar 200, Ningbo Scientz Biotechnology Co. Ltd., Zhejiang, China) was used. An electric drying oven with forced convection (DZF-6096, Shanghai Yiheng Scientific Instrument Co. Ltd., Shanghai, China) was used for drying the DPs.| Ion concentration (%) | Substance components (%) | |||||||
|---|---|---|---|---|---|---|---|---|
| K+ | Mg2+ | Cl− | Na+ | KCl | NaCl | MgCl2 | H2O | Water-insoluble material |
| 8.34 | 5.35 | 46.84 | 15.35 | 15.90 | 39.02 | 20.96 | 23.76 | 0.36 |
2.2 Analytical methods
K+, Mg2+, and Cl− concentrations were determined at the Qinghai Institute of Salt Lakes, Chinese Academy of Science.17 The Mg2+ ion concentration was determined by complexometric titration with an ethylenediaminetetraacetic acid standard solution. The K+ ion concentration was determined by gravimetric methods using sodium tetraphenylborate. The Cl− ion concentration was determined by using titration methods with mercury nitrate.2.3 Experimental procedure
The decomposition process of carnallite in an aqueous solution is an endothermic reaction, and was carried out in a super constant temperature water-bath. The reaction temperature was controlled at 293.15 K (ambient temperature). The speed of the agitator was 500 rpm. The reaction time was 45 min, and 2000 ml standard glassware was used as the reaction vessel. The solid-phase minerals and liquid-phase solution were separated by vacuum filtration after the end of the decomposition. The equal division method of single factor experiment design was adopted. The ratios of added water (actual amount of added water/theoretical amount of water) were chosen as 0.9, 0.94, 0.97, 1, 1.03, 1.06, and 1.09. The H2O amounts of feed were 90, 93, 96, 99, 102, 105, and 108 g, respectively, while the difference value was 3 g. The DPs were placed in a drying oven on forced convection at 373.15 K for 4 h. The quantity of the DPs and dried products were weighed by an electronic balance with an accuracy of 0.01 g.3. Results and discussion
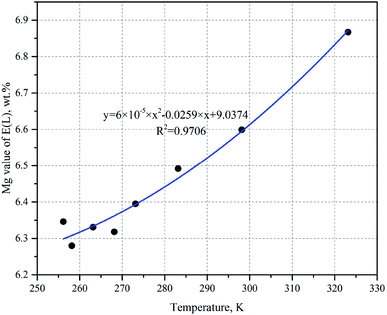
Fig. 1 illustrates the Mg value of E(L) as a function of temperature based on the multi-temperature quaternary diagram data of the NaCl–KCl–MgCl2–H2O system,18 where the temperature ranges from ∼256.15 to ∼323.15 K. Polynomial regression analysis indicated that the temperature and the Mg value of E(L) showed a quadratic relationship, and the correlation coefficient was 0.9706. The functional relationship model between the Mg value and temperature in E(L) can be obtained from Fig. 1:| CMg = 6 × 10⁻⁵ × T2 − 0.0259 × T + 9.0374 | (4) |
The Mg value of E(L) can be calculated through eqn (4) at a desired temperature.
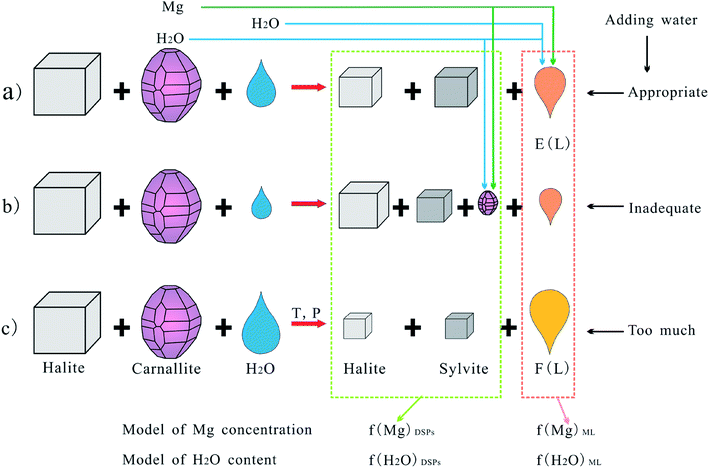
A schematic diagram was utilized to intuitively demonstrate the decomposition behavior of carnallite in an aqueous solution at different amounts of added water, which is presented in Fig. 2. In the above cases, the process occurs at the interface between the solid and liquid phases, MgCl2 dissolves completely or incompletely into the liquid phase from the carnallite crystals, and KCl is crystallized. Furthermore, NaCl and KCl would be partly dissolved due to adding too much water.
Analysis of eqn (1)–(3) indicates that the Mg concentration and moisture content of the DPs are intimately related to four factors: (1) the composition of the E(L) triple-saturation equilibrium mother liquor at the desired temperature (EC(α2,β2)); (2) the composition of the F(L) double-saturation equilibrium mother liquor at the desired temperature (FC(α3,β3)); (3) the ratio of the additional water quantities (δ); (4) the composition of the carnallite (PC(α1,β1)).
Based on the principle of the mass conservation of MgCl2, a functional model of Mg concentration in DSPs and the ML can be obtained from eqn (1)–(3):
 | (5) |
 | (6) |
Based on the principle of water equilibrium in the reaction system, the functional model of moisture content in DSPs and the ML can be obtained from eqn (1)–(3):
 | (7) |
 | (8) |
According to eqn (1)–(3) and Fig. 1, a reaction equation of the decomposition process of carnallite in aqueous solution is described as follows:
 | (9) |
Here, N is defined as the mass of mother liquor entrainment in the DSPs, when the mass of the DPs is M (in g), and the following relationship would exist:
| M = C + N | (10) |
In this case, the Mg value of the DPs can be calculated using eqn (5), (6), (9) and (10):
 | (11) |
It can be seen that a functional relationship between the Mg value of the DPs and the Mg concentrations of the DSPs and the ML can be described as follows:
| f(Mg-value)DPs = (C × f(Mg)DSPs + N × f(Mg)ML)/M | (12) |
In order to determine the moisture content of the DPs, a drying experiment was performed using the step described above in Section 2.3. During the drying process, the lost weight of the DPs is the mass of H2O that is evaporated as gas from the ML (here, ML denotes the mother liquor entrainment in the DPs). This process can be described as follows:
 | (13) |
For the amount of water in the ML, one part is evaporated as gas, and another part is formed as MgCl2·6H2O, which is presented in eqn (13). This reaction has been verified by some authors.19 Thus, the H2O value of the DPs can be calculated using eqn (7), (8), (9), and (13).
 | (14) |
It can be seen that a functional relationship between the H2O value of the DPs and water concentrations of the DSPs and ML can be described as follows:
| f(H2O-value)DPs = C × f(H2O)DSPs + N × f(H2O)ML − N × α2(α3) × K | (15) |
In addition, here, the percentage of H2O of the DPs is defined as η(H2O)DPs
 | (16) |
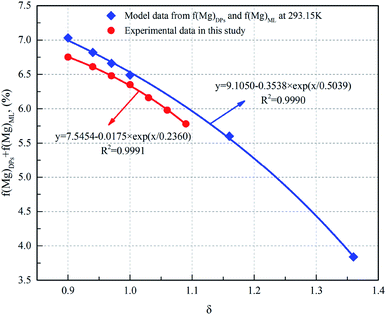
Fig. 3 illustrates the Mg concentration of DSPs + ML as a function of the ratio of the additional water amount. It can be seen that the Mg concentration of DSPs + ML significantly decreases with an increase in the amount of water for the decomposition of the carnallite period, indicating that the Mg concentration of the DPs + ML markedly drops along with the increase in the additional amount of water. Moreover, the relationship between f(Mg)DSPs + f(Mg)ML and δ for both the model and experiment is nonlinear, and the correlation coefficients are 0.9990 and 0.9991, respectively. This result suggests that the amount of water has a significant influence on the decomposition process of carnallite in an aqueous solution. The difference between the experimental result and the value predicted by the model (eqn (5) and (6)) is about 4%. This difference is probably due to systematic errors from the mass balance of the feed and product.
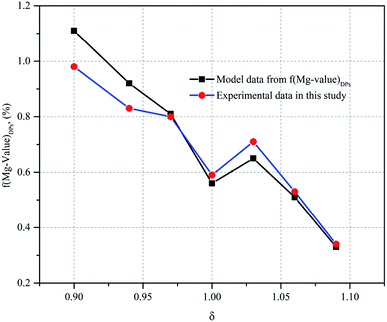
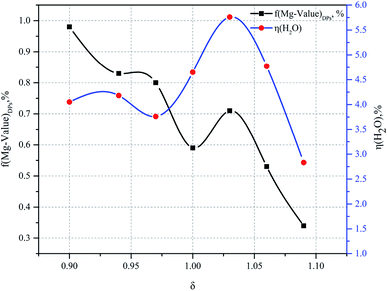
As shown in Fig. 4, the Mg value of the DPs decreased with the ratio of the additional amount of water increasing, indicating the Mg ion of carnallite easily enters into the mother liquor as the additional amount of water increases (see Fig. 2). Here, there exists an abnormal Mg value of the DPs when the ratio of the additional amount of water is 1.03, causing the higher ML entrainment rate in the DPs due to the difference in separation conditions. The reason is that the ML entrainment rate in the DPs is 10.67% when δ is 1.03, whereas the ML entrainment rate in the DPs of other δ conditions is less than 10% (see Table 2). When δ is less than 1, the Mg value of the DPs is higher than that of the completely decomposed carnallite, indicating the excess Mg ion is from the incompletely decomposed carnallite owing to an inadequate added amount of water. When δ is greater than 1, the Mg value of the DPs is lower than that of the completely decomposed carnallite, indicating the Mg value of ML decreases with the added amount of water increases. These results could also be confirmed by the functional model of f(Mg-value)DPs from eqn (5), (6) and (12). Moreover, as can be seen from Fig. 4, the predicted data is consistent with the experiment data, thereby resulting in Mg values of the DPs as a good monitoring control factor for the decomposition process of carnallite.
| δ = 0.90 | δ = 0.94 | δ = 0.97 | δ = 1.00 | δ = 1.03 | δ = 1.06 | δ = 1.09 | ||
|---|---|---|---|---|---|---|---|---|
| Feed, g | Carnallite | 300 | 300 | 300 | 300 | 300 | 300 | 300 |
| H2O | 90 | 93 | 96 | 99 | 102 | 105 | 108 | |
| Product, g | DPs | 178.91 | 176.74 | 178.29 | 171.07 | 174.20 | 174.75 | 163.03 |
| ML | 211.09 | 216.26 | 217.71 | 227.93 | 227.80 | 230.25 | 244.97 | |
| Mg value of DPs, wt% | 0.98 | 0.83 | 0.80 | 0.59 | 0.71 | 0.53 | 0.34 | |
| Mg value of ML, wt% | 6.44 | 6.41 | 6.43 | 6.20 | 6.16 | 5.98 | 5.99 | |
| H2O value of ML, wt% | 69.93 | 69.94 | 69.97 | 70.06 | 70.21 | 70.49 | 70.54 | |
| ML entrainment rate in DPs, wt% | 9.86 | 9.84 | 9.87 | 8.98 | 10.67 | 8.55 | 5.67 | |
| DPs, g | Weight before drying | 10.37 | 10.06 | 10.38 | 10.33 | 10.24 | 10.06 | 10.59 |
| Weight after drying | 9.95 | 9.64 | 9.99 | 9.85 | 9.65 | 9.58 | 10.29 | |
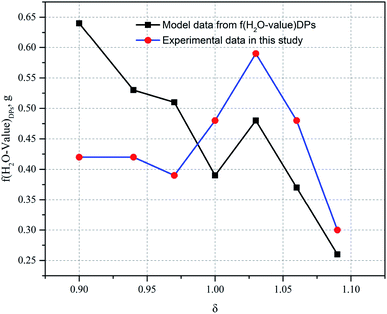
| f(H2O-value)DPs, g | 0.42 | 0.42 | 0.39 | 0.48 | 0.59 | 0.48 | 0.30 | |
| η(H2O)DPs, wt% | 4.05 | 4.18 | 3.76 | 4.65 | 5.76 | 4.77 | 2.83 | |
In Fig. 5, the change in trends of the H2O value of the DPs is consistent with those of the Mg value of the DPs, verifying this variation pattern as the functional model of f(H2O-value)DPs derived from eqn (7), (8) and (12). For a similar reason, here there exists an abnormal H2O value of the DPs when the ratio of the additional amount of water is 1.03, having a high ML entrainment rate in the DPs, that is, 10.67% when δ is 1.03, whereas the ML entrainment rate in the DPs of other δ conditions is less than 10%. As can be seen from Fig. 5, the relative error in the H2O value of the DPs established from the predicated data to the experimental data decreases with the increase of the ratio of the additional amount of water, indicating a considerable impact of the H2O value on the incompletely decomposed carnallite (see eqn (14)). Nevertheless, the trend of change in the predicted data is consistent with that of the experiment data, thereby resulting in a H2O value of the DPs as another monitoring control factor for the decomposition process of carnallite.
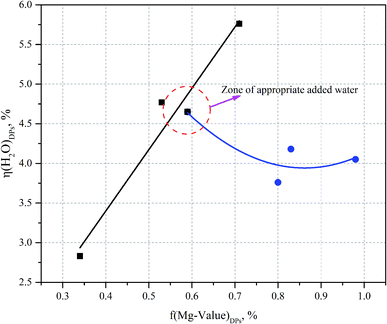
The percentage of H2O mass in the DPs (η(H2O)DPs) and Mg value of the DPs (f(Mg-value)DPs) as a function of the ratio of the additional amount of water are given in Fig. 6 for the experimental conditions. When δ is less than or equal to 1, a disordered pattern of change appears between the H2O value and the Mg value of the DPs. On the contrary, when δ is greater than or equal to 1, the relationship between the percentage of H2O mass in the DPs and the Mg value of the DPs is consistent.
Thus it can be seen that: (1) the percentage of H2O mass in the DPs (η(H2O)DPs) and the Mg value of the DPs (f(Mg-value)DPs) show a linear change when the ratio of the additional amount of water (δ) is greater than or equal to 1; (2) the percentage of H2O mass in the DPs (η(H2O)DPs) and the Mg value of the DPs (f(Mg-value)DPs) show a nonlinear change when the ratio of the additional amount of water (δ) is less than or equal to 1 (see Fig. 7). The confluence of these changes is the optimal decomposition condition of carnallite in an aqueous solution, with the ratio of the additional amount of water justly 1. Hence, the functional model of the Mg value and moisture content of the DPs established in this paper can be used to monitor the decomposition process of carnallite in an aqueous solution.
4. Conclusions
During the decomposition process of carnallite in aqueous solution, the amount of water used to dissolve carnallite is a very important operating parameter in this chemical process. Based on the theory of water-salt system phase equilibrium, the Mg value and H2O value of ML can be known exactly under the desired temperature and pressure conditions. In order to monitor the decomposition process of carnallite under different amounts of added water, a novel monitoring method was developed in this paper, according to the Mg value and moisture content of the DPs. A functional model of the Mg value of the DPs, that is f(Mg-value)DPs = (C × f(Mg)DSPs + N × f(Mg)ML)/M, was established by the principle of the mass conservation of MgCl2 during the decomposition of carnallite in aqueous solution. Another functional model of the H2O value of the DPs, that is f(H2O-value)DPs = C × f(H2O)DSPs + N × f(H2O)ML − N × α2(α3) × K, was obtained by the water equilibrium condition of the reaction system. Experiments examining different conditions for the amount of water for dissolving carnallite in aqueous solution were performed in this study, and the Mg value and moisture content were determined for DPs. The experimental data are consistent with the predicted data from the two functional models, that is f(Mg-value)DPs and f(H2O-value)DPs, respectively, thereby resulting in the Mg values and H2O values of the DPs acting as good monitoring control factors for the decomposition process of carnallite. The experimental results showed that: (1) η(H2O)DPs and f(Mg-value)DPs of the DPs show a linear functional relationship when δ is greater than or equal to 1; and (2) η(H2O)DPs and f(Mg-value)DPs of the DPs show a non-linear functional relationship when δ is less than or equal to 1. It was found that the intersection of these two changes is the appropriate location for the decomposition of carnallite in aqueous solution. The Mg value and moisture content of the DPs are thus presented as a novel monitoring method for these applications within the cold decomposition process to produce potash from carnallite.Nomenclature
| T | Temperature (K) |
| p | Pressure (Pa) |
| α1 | Mg ion concentration in carnallite (wt%) |
| β1 | H2O content in carnallite (wt%) |
| α2 | Mg ion concentration in the triple-saturation equilibrium mother liquor (wt%) |
| β2 | H2O content in the triple-saturation equilibrium mother liquor (wt%) |
| α3 | Mg ion concentration in the double-saturation equilibrium mother liquor (wt%) |
| β3 | H2O content in the double-saturation equilibrium mother liquor (wt%) |
Conflicts of interest
There are no conflicts to declare.Acknowledgements
This work was supported by the Applied Basic Research Project of Qinghai Province (Grant No. 2016-ZJ-781; 2020-ZJ-761), CAS “Light of West China” Program (Grant to QY Hai), and the Second Tibetan Plateau Scientific Expedition and Research Program (STEP) (Grant No. 2019QZKK0805).References
- S. Shekhar, D. Mishra, A. Agrawal and K. K. Sahu, Appl. Clay Sci., 2017, 143, 50–56 CrossRef CAS.
- D. Ciceri, D. A. C. Manning and A. Allanore, Sci. Total Environ., 2015, 502, 590–601 CrossRef CAS PubMed.
- P. L. Broughton, Ore Geol. Rev., 2019, 113, 103117 CrossRef.
- C. Lanzerstorfer, Resour., Conserv. Recycl., 2019, 143, 68–76 CrossRef.
- X. Yang, C. Li, Q. Zhang, Z. Liu, J. Geng and M. Zhang, Field Crop. Res., 2017, 212, 145–152 CrossRef.
- D. M. Oosterhuis, D. A. Loka, E. M. Kawakami and W. T. Pettigrew, in Advances in Agronomy, ed. D. L. Sparks, Academic Press, 2014, vol. 126, pp. 203–233 Search PubMed.
- H. Cheng, H. Ma, Q. Hai, Z. Zhang, L. Xu and G. Ran, Int. J. Miner. Process., 2015, 139, 36–42 Search PubMed.
- H. Chen, M. Zhu, X. Song and J. Yu, RSC Adv., 2019, 9, 31004–31012 RSC.
- X. Wang, J. D. Miller, F. Cheng and H. Cheng, Miner. Eng., 2014, 66–68, 33–39 Search PubMed.
- H. D. Cheng, Q. Y. Hai, H. Z. Ma, X. Y. Zhang, Q. L. Tang, Q. S. Fan, Y. S. Li and W. L. Miao, J. Geochem. Explor., 2016, 165, 189–198 CrossRef CAS.
- C. Liu, Y. Ji, Y. Bai, F. Cheng and X. Lu, Fluid Phase Equilib., 2007, 261, 300–305 CrossRef CAS.
- W. Song, S. Yang, S. M. Mbadinga, X. Sun and B. Mu, RSC Adv., 2015, 5, 16230–16233 RSC.
- X. L. Hong, S. P. Xia and S. Y. Gao, Chin. J. Appl. Chem., 1994, 11, 26–31 CAS.
- H. Emons and H. Voigt, Freiberg. Forschungsh. A, 1981, 628, 69–78 Search PubMed.
- H. Emons and F. W. Wouny, Freiberg. Forschungsh. A, 1981, 654, 117–119 Search PubMed.
- S. P. Xia, X. L. Hong and S. Y. Gao, J. Salt Lake Res., 1993, 1, 52–60 Search PubMed.
- Z. X. Zhai, Z. B. Cheng, F. Hu, G. L. Wu, Y. K. Xiao and F. M. Liu, The Introduction to Analyzing Methods of Brines and Salt Deposits, Science Press, Beijing, China, 2nd edn, 1988 Search PubMed.
- Z. D. Niu and F. Q. Cheng, Phase Diagram of Salt-Water System and Its Application, Tianjing University Press, 2002 Search PubMed.
- S. Gao and G. Li, Chem. J. Chin. Univ., 1982, 3, 141–148 CAS.
| This journal is © The Royal Society of Chemistry 2020 |

