 Open Access Article
Synthesis and structural studies on (E)-3-(2,6-difluorophenyl)-1-(4-fluorophenyl)prop-2-en-1-one: a promising nonlinear optical material†
I. D. Borgesa,
J. A. V. Daniellia,
V. E. G. Silvab,
L. O. Sallumb,
J. E. Queiroz b,
L. D. Diasc,
I. Iermakc,
G. L. B. Aquino
 b,
A. J. Camargob,
C. Valverdebd,
F. A. P. Osórioef,
B. Baseiaeg and
H. B. Napolitano
 *ab
*ab
aLaboratório de Novos Materiais, Centro Universitário de Anápolis, 75083-515, Anápolis, GO, Brazil. E-mail: hbnapolitano@gmail.com
bGrupo de Química Teórica e Estrutural de Anápolis, Universidade Estadual de Goiás, 75001-970, Anápolis, GO, Brazil
cSão Carlos Institute of Physics, University of São Paulo, 13566-590, São Carlos, SP, Brazil
dLaboratório de Modelagem Molecular Aplicada e Simulação, Universidade Paulista, 74845-090, Goiânia, GO, Brazil
eInstituto de Física, Universidade Federal de Goiás, 74.690-900, Goiânia, GO, Brazil
fPontifícia Universidade Católica de Goiás, 13566-590, Goiania, GO, Brazil
gDepartamento de Física, Universidade Federal da Paraíba, 58051-970, João Pessoa, PB, Brazil
First published on 12th June 2020
Abstract
A new fluorinated chalcone (E)-3-(2,6-difluorophenyl)-1-(4-fluorophenyl)prop-2-en-1-one was synthesized in 90% yield and crystallized by a slow evaporation technique. Its full structural characterization and purity were determined by scanning electron microscopy, infrared spectroscopy, gas chromatography-mass spectrometry, 1H, 13C and 19F nuclear magnetic resonance, thermal gravimetric analysis (TGA), differential scanning calorimetry (DSC), Raman microspectroscopy, UV-Vis absorption spectroscopy, single crystal X-ray diffraction (XRD) and Hirshfeld surface (HS) analysis. The fluorinated chalcone crystallized in centrosymmetric space group P21/c stabilized by the C–H⋯O and C–H⋯F interactions and the π⋯π contact. The crystalline environment was simulated through the supermolecule approach where a bulk with 378![[thin space (1/6-em)]](https://www.rsc.org/images/entities/char_2009.gif) 000 atoms was built. The electric parameters were calculated at the DFT/CAM-B3LYP/6-311++G(d,p) level as function of the electric field frequency. The macroscopic parameters such as linear refractive index and third-order nonlinear susceptibility (χ(3)) were calculated, and the results were compared with experimental data obtained from the literature. The χ(3)-value for the chalcone crystal is 369.294 × 10⁻²² m2 V−2, higher than those obtained from a few similar types of molecule, showing that the chalcone crystal can be considered as a nonlinear optical material. Also, molecular theoretical calculations such as infrared spectrum assignments, frontier molecular orbital analysis and MEP were implemented, revealing that the most positive region is around the hydrogen atoms of the aromatic rings, and electrophilic attack occurs on the carbonyl group.
000 atoms was built. The electric parameters were calculated at the DFT/CAM-B3LYP/6-311++G(d,p) level as function of the electric field frequency. The macroscopic parameters such as linear refractive index and third-order nonlinear susceptibility (χ(3)) were calculated, and the results were compared with experimental data obtained from the literature. The χ(3)-value for the chalcone crystal is 369.294 × 10⁻²² m2 V−2, higher than those obtained from a few similar types of molecule, showing that the chalcone crystal can be considered as a nonlinear optical material. Also, molecular theoretical calculations such as infrared spectrum assignments, frontier molecular orbital analysis and MEP were implemented, revealing that the most positive region is around the hydrogen atoms of the aromatic rings, and electrophilic attack occurs on the carbonyl group.
1. Introduction
Nonlinear optical (NLO) materials are useful, playing an essential role in nonlinear optics, and in particular they have a great impact on information technology and industrial applications such as second harmonic generation (SHG) optical modulation, electro-optic switches, optical logic, and others.1 Their properties and applications depend on the degree of charge separation (polarization) induced by laser light.2 In this regard, organic molecules have been constantly reported for their relevant NLO properties3–8 due to the presence of a delocalized π system and by different donor or acceptor substituents on the molecular structure.Among the organic nonlinear materials (NLO) studied so far,9–12 chalcones have been widely reported, making use of different donor and acceptor substituents.13–19 Chalcones are simple chemical scaffolds of many naturally occurring compounds that are studied due to their structural versatility, consisting of two substituted aromatic rings joined by an α,β-unsaturated ketone.20,21 Thus, this family has attracted much interest not only from the nonlinear materials (NLO) perspective but also due to its broad and interesting biological activities.21 Chalcones have become even more sought after because they are easily obtained by extraction from natural sources or chemical synthesis through Claisen–Schmidt condensation reaction under basic or acid conditions.22,23
This study focuses on the synthesis, crystal growth and extensive characterization of a fluorinated chalcone (E)-3-(2,6-difluorophenyl)-1-(4-fluorophenyl)prop-2-en-1-one (FCH) by scanning electron microscopy (SEM), infrared spectroscopy (IR), gas chromatography-mass spectrometry (GC-MS), 1H-, 13C- and 19F-nuclear magnetic resonance (NMR), thermal gravimetric analysis (TGA), differential scanning calorimetry (DSC), solid state UV-Vis absorption spectroscopy, Raman microspectroscopy, and single crystal X-ray diffraction (XRD). Hirshfeld surface (HS) studies using a model with fluorine atoms as substituents with intense electronegativity characteristics, and structural analysis, were performed aiming to understand structural factors such as torsions, bonding distances, and intermolecular interactions.
Moreover, the linear and nonlinear optical parameters of the FCH crystal were calculated using the supermolecule (SM)24–30 approach at DFT/CAM-B3LYP/6-311++G(d,p) level as a function of the electric field frequency. The third-order nonlinear susceptibility (χ(3)) was calculated, and the obtained result for FCH (369.294 × 10⁻²² m2 V−2) was compared with one for another organic crystal. The high value for the third-order nonlinear susceptibility qualifies the FCH crystal as a nonlinear optical material. In order to gain insight into the molecular properties, we calculated the molecular orbital frontiers (FMO), molecular electrostatic potential (MEP) and vibrational assignment at the M062X/6-311++G(d,p) level of theory.
2. Experimental and computational procedures
Synthesis and crystallization
Chemicals and solvents required for FCH synthesis were obtained from commercial sources and used without further purification. In a volumetric flask, 4′-fluoroacetophenone (1 mmol; 138 mg) and 2,6-difluorobenzaldehyde (1 mmol; 142 mg) were added in ethanol (1 mL). Then, pulverized KOH (1 mmol; 56.1 mg) was added and the reaction mixture was kept under manual shaking for 3 min, at 25 °C. The reaction's progress was monitored by TLC (Silica gel 60 UV254) plate using a mixture of solvent (ethyl acetate/hexane 3![[thin space (1/6-em)]](https://www.rsc.org/images/entities/char_2009.gif) :
:![[thin space (1/6-em)]](https://www.rsc.org/images/entities/char_2009.gif) 7) as an eluent. At the end, a white precipitate was obtained and collected by vacuum filtration followed by a crystallization process using ethanol as solvent. (E)-3-(2,6-difluorophenyl)-1-(4-fluorophenyl)prop-2-en-1-one (FCH) was obtained in 90% yield (0.9 mmol; 236 mg). The crystal growth of FCH was carried out in dichloromethane in a conical flask with a known volume of solvent and chalcone. The mixture was kept at 25–30 °C for slow evaporation for 72 h until the crystals formed. Infrared (IR) spectra (Fig. S1†) were recorded using a Perkin Elmer-8400S FT-IR (400–4000 cm−1) with KBr pellet technique. IR (KBr): 3048, 1650, 1580, 1390, 860, 770 cm−1.
7) as an eluent. At the end, a white precipitate was obtained and collected by vacuum filtration followed by a crystallization process using ethanol as solvent. (E)-3-(2,6-difluorophenyl)-1-(4-fluorophenyl)prop-2-en-1-one (FCH) was obtained in 90% yield (0.9 mmol; 236 mg). The crystal growth of FCH was carried out in dichloromethane in a conical flask with a known volume of solvent and chalcone. The mixture was kept at 25–30 °C for slow evaporation for 72 h until the crystals formed. Infrared (IR) spectra (Fig. S1†) were recorded using a Perkin Elmer-8400S FT-IR (400–4000 cm−1) with KBr pellet technique. IR (KBr): 3048, 1650, 1580, 1390, 860, 770 cm−1.
Scanning electron microscopy
Microscopic structures of FCH were observed by a scanning electron microscopes (SEM, Hitachi model TM-3030 Plus). The sample was fixed on the carbon adhesive tape in an aluminum stub and, subsequently, observed in the microscope. The SEM image is presented in Fig. 2.Gas chromatography-mass spectrometry
GC chromatogram (Fig. S2†) and mass spectrum (GC-MS) (Fig. S3†) were recorded in a Shimadzu QP2010 Ultra equipped with capillary column CBP-5 (30 × 0.25 × 0.25), with injection volume of 1.0 μL, in split mode and helium as drag gas with 1.0 mL min−1 flow. For the analysis the injector temperature was 280 °C and the detector 310 °C. The initial oven temperature was 100 °C (held for 2 min), followed by a heating ramp of 30 °C min−1 till 300 °C (held for 10 min). MS m/z: 262, 243, 167, 139, 123 and 95.Nuclear magnetic resonance
A Bruker Avance 500 MHz NMR spectrometer was used to obtain 1H-, 13C-, and 19F-NMR spectra (Fig. S4–S6†) with TMS as internal standard and CDCl3 as solvent. The corresponding shifts reveal the purity of the compound. 1H-, 13C-, and 19F-NMR spectra were used to determine the sample purity and structural conformation of FCH![[thin space (1/6-em)]](https://www.rsc.org/images/entities/char_2009.gif) :
:![[thin space (1/6-em)]](https://www.rsc.org/images/entities/char_2009.gif) C15H9F3O (262.2 g mol−1); white solid, 90% yield and mp 108.3 °C; 1H NMR (500 MHz, CDCl3) δ 7.86 (d, J = 16.2 Hz, 1H), 7.63 (d, J = 16.2 Hz, 1H), 7.58 (d, J = 1.0 Hz, 1H), 7.28–7.19 (m, 2H), 6.87 (t, J = 8.6 Hz, 2H), 6.51 (dd, J = 3.5, 1.7 Hz, 1H).; 13C NMR (126 MHz, CDCl3) δ 177.98 (s), 162.06 (dd, J = 256.0, 6.8 Hz), 153.59 (s), 146.87 (s), 145.95 (s), 131.30 (t, J = 11.1 Hz), 129.79 (t, J = 2.2 Hz), 126.82 (t, J = 8.5 Hz), 118.03 (s), 112.56 (s), 111.91 (dd, J = 21.4, 4.7 Hz); 19F NMR (376 MHz, CDCl3) δ −105.13, −109.69.
C15H9F3O (262.2 g mol−1); white solid, 90% yield and mp 108.3 °C; 1H NMR (500 MHz, CDCl3) δ 7.86 (d, J = 16.2 Hz, 1H), 7.63 (d, J = 16.2 Hz, 1H), 7.58 (d, J = 1.0 Hz, 1H), 7.28–7.19 (m, 2H), 6.87 (t, J = 8.6 Hz, 2H), 6.51 (dd, J = 3.5, 1.7 Hz, 1H).; 13C NMR (126 MHz, CDCl3) δ 177.98 (s), 162.06 (dd, J = 256.0, 6.8 Hz), 153.59 (s), 146.87 (s), 145.95 (s), 131.30 (t, J = 11.1 Hz), 129.79 (t, J = 2.2 Hz), 126.82 (t, J = 8.5 Hz), 118.03 (s), 112.56 (s), 111.91 (dd, J = 21.4, 4.7 Hz); 19F NMR (376 MHz, CDCl3) δ −105.13, −109.69.
Thermogravimetric analysis
TGA was performed in a Perkin Elmer Pyris equipment, 1 TGA model, installed at Universidade Estadual de Goiás. The evaluation was carried out with 1.506 mg sample mass in an alumina crucible. The program was an initial temperature of 25 °C reaching till 600 °C with heating rate of 10 °C min−1 under nitrogen purge gases (20 mL min−1 flow).Differential scanning calorimetry
Differential scanning calorimetry (DSC, 214 Polyma, Netzsch) measurements were carried out in platinum crucibles sealed without drilling the lid with 2.16 mg of sample. The temperature range was 20–200 °C applied at a heating rate of 10 °C min−1, under a dynamic 5.0 N2 atmosphere of 40 mL min−1. For these analyses, correction was performed to eliminate background. Fig. S7† displays the DSC traces of synthesized chalcone with a sharp exothermic peak at 108.3 °C for heating and 42.4 °C for cooling. The representative DSC thermogram of chalcone (Fig. S7 and S8†) indicates direct melting of crystal phase to isotropic liquid phase since the thermogram showed single thermal cycles. The enthalpy variations (ΔH) during heating and cooling cycles were 28.4 kJ mol−1 and −22.04 kJ mol−1, respectively.UV-Vis and Raman spectroscopy
A UV-Vis spectrum was obtained using a Cary 5000 UV-Vis-NIR spectrometer. Raman measurements were performed on the WITec Alpha 300 RAS microscope (WITec, Ulm, Germany). The excitation wavelength was 785 nm, detection range was 100–4000 cm−1. The spectra were collected with 20× magnification objective (Zeiss, Jena, Germany). Spectra were recorded with the integration time of 30 s and 2 accumulations. Obtained spectra were processed using WITec Project FOUR and Origin 2016 software.Crystallographic characterization
The powder diffraction measurements were performed in a Bruker D8 Discover diffractometer. Monochromatic radiation from a copper anode tube coupled to a Johansson monochromator for Kα1 operating at 40 kV and 40 mA was used, Bragg Brentano configuration θ–2θ, one-dimensional detector Lynxeye®, a range of 2θ of 5° to 80°, with a pitch of 0.01°. The samples were kept in rotation at 15 rpm during the measurement. Powder diffraction patterns are shown in Fig. S9.† A single chalcone crystal was selected and the single diffraction data were collected on a Bruker APEX-II CCD diffractometer with a monochromated MoKα (λ = 0.71073 Å) at 296.15 K, of the 2490 reflections collected [2087 reflections with I > 2σ(I) and 403 independent refined parameters].The structural solution was carried out with the ShelXS31 and ShelXL32 program suite on the Olex2 platform.33 The direct method was applied to solve the structure and least square minimization to refine the molecular model. The ellipsoid diagram was generated from ORTEP34 and the packing diagram and supramolecular representations were generated using Mercury35 and Crystal Explorer 17.5.36 Geometric parameters were obtained using PLATON.37 Non-hydrogen atoms were anisotropically refined and hydrogen atoms were refined using a riding model with a distance of aromatic C–H = 0.93 and Uiso(H) = 1.2Ueq (hydrogen atoms involved in intermolecular interactions were released). Refinement parameters are shown in Table 1 and crystallographic information files were deposited in the Cambridge Structural Database under code 1997399.
| Crystal data | Chalcone |
|---|---|
| Chemical formula | C15H9F3O |
| Molecular weight | 262.22 |
| Space group | P21/c |
| a, b, c (Å) | 11.2133(5), 9.1206(4),12.1021(5) |
| α, β, γ (°) | 90, 100.356(2), 90 |
| V (Å3) | 1217.54(9) |
| Z | 4 |
| Radiation type | Mo Kα |
| μ (mm−1) | 0.120 |
| R[F2 > 2σ(F2)] | 0.0460 |
| wR(F2) | 0.1356 |
| S | 1.122 |
| No. of reflections | 2490 |
| No. of parameters | 187 |
Hirshfeld surface analysis
The Hirshfeld surface can be understood as a spatial map, developed with the intention of defining the space occupied by a molecule in the crystal, so that this graphical visualization tool makes it possible to describe the intermolecular interactions and contacts through color mapping that identifies regions and describes specific surface properties. In this case, blue is for longer contacts, and red indicates shorter contacts, facilitating visual analysis from molecular interactivity patterns that provide important information about the interactions.38,39 Dividing the space in the crystal into specific regions, where the distribution of electrons from one atom to the molecule (ρimolecule) dominates the analogous sum over the crystal (ρicrystal), which is located in one region of the crystalline space around the molecule that is defined by W(r) = 0.5.38,39 Since W(r) is a weight function defined for a molecule in a crystal, derived from the atomic electron density ρi(r), it is defined in eqn (1):
 | (1) |
On the Hirshfeld surface a function of dnorm distance (normalized contact distance) is defined in eqn (2), which is related in terms of di (distance from a point on the surface to the nearest nucleus inside the surface), where the molecule acts as stronger intermolecular donor contacts and de (distance from a point on the surface to the nearest nucleus outside the surface), which is where the molecules act as stronger intermolecular contact receptors, as a function of Van der Waals radius (rvdWi and rvdWe), was used for intermolecular interactions and to fingerprints plots. It is an informative and quantitative summary of each type of intermolecular contact in the crystal, through the relative surface area corresponding to each type of interaction present in the molecule.38–40 Also, the shape index on the Hirshfeld surface auxiliary allowed us to identify characteristic packing modes.17,24,38–40
 | (2) |
Computational procedures
The calculations of the electronic structure were carried out using the Gaussian09 program package41 for chalcone. The chalcone geometry was optimized (Table S1†) using M062X exchange-correlation functional and basis set 6-311++G(d,p). M062X is a hybrid meta exchange-correlation functional with double the nonlocal exchange (2×). This functional is parametrized for nonmetal and for long noncovalent range interactions.42 The absence of imaginary frequencies shows that the optimized geometry is found in a local minimum on the potential energy hypersurface. The highest occupied molecular orbital (HOMO) and lowest unoccupied molecular orbital (LUMO), which account for the ability to donate and accept electrons, were carried out by Kohn–Sham43 analysis. MEP is used to assign the nucleophilic and electrophilic site within the molecule. The main assignments of infrared frequencies and Raman spectra were performed in conjunction with quantum chemical calculations.Nonlinear optical properties
In order to calculate the nonlinear optical (NLO) properties of the FCH crystal, the supermolecule (SM) approach was employed at the DFT/CAM-B3LYP/6-311++G(d,p) level to build a bulk with 15 × 15 × 15 unit cell, with 4 asymmetric units in each unit cell totalizing 13![[thin space (1/6-em)]](https://www.rsc.org/images/entities/char_2009.gif) 500 molecules, each with 28 atoms; thus the bulk was composed of 378
500 molecules, each with 28 atoms; thus the bulk was composed of 378![[thin space (1/6-em)]](https://www.rsc.org/images/entities/char_2009.gif) 000 atoms. The SM is an iterative process that considers the atoms of the molecules that surround the isolated molecule as specific charges. First, in the SM approach using ChelpG software, the electrostatic potential of the isolated molecule in vacuum was fitted, and the partial atomic charges were calculated. Then an iterative process began by the substitution of the each atom in the unit cells generated by the atom with the partial atomic charge calculated in the previous step. In each step of the approach the electrical properties of the embedded molecules are calculated, and the process finishes with the dipole moment
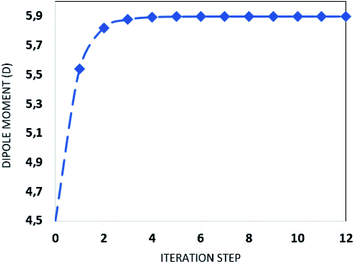
000 atoms. The SM is an iterative process that considers the atoms of the molecules that surround the isolated molecule as specific charges. First, in the SM approach using ChelpG software, the electrostatic potential of the isolated molecule in vacuum was fitted, and the partial atomic charges were calculated. Then an iterative process began by the substitution of the each atom in the unit cells generated by the atom with the partial atomic charge calculated in the previous step. In each step of the approach the electrical properties of the embedded molecules are calculated, and the process finishes with the dipole moment  convergence. The SM method has been successfully employed in several recent works to simulate the crystalline environment polarization effects on the electrical properties of organic molecules.44–48 Fig. 1 shows the convergence of the dipole moment as a function of the iterative steps, and it can be seen that the crystalline environment polarization effect is significant, increasing the μ-value from 4.5 D for isolated molecules (step 0) for 5.9 D for embedded molecules, a perceptual increase of ∼31%.
In our calculations the average linear polarizability (〈α〉) and the static average second hyperpolarizability were calculated using the following expression in eqn (3) and (4).
 | (3) |
 | (4) |
The Kleimann symmetry was employed since the medium optical dispersion was not taken into account. The third-order nonlinear susceptibility can be written in the following form (eqn (5)).
 | (5) |
The intensity-dependent refractive index (IDRI) second hyperpolarizability is given by eqn (6).
 | (6) |
Also using the Clausius–Mossoti relationship the linear refractive index (n) can be calculated through the eqn (7).
 | (7) |
3. Results and discussions
Synthesis and crystal growth
FCH molecule was synthetized by Claisen–Schmidt condensation procedure. For this reaction, 4′-fluoroacetophenone, 2,6-difluorobenzaldehyde, and KOH were reacted by manual shaking using ethanol as a green solvent (Scheme 1). FCH was obtained as white solid (90% yield and mp 108.3 °C).A solubility study shows that FCH is not soluble in hexane, moderately soluble in ethanol, and highly soluble in dichloromethane, acetone and chloroform. High quality crystals of FCH (Fig. 2a) were obtained by solvent evaporation method using dichloromethane (CH2Cl2), at 25–30 °C. Surface morphology of FCH was investigated by scanning electron microscope (Fig. 2b). From the analysis of the SEM micrograph (30×), it can be seen that the crystal has non-uniform distribution.
Structural characterization
In order to confirm the molecular structure and to determine the purity of the fluorinated chalcone (FCH), GC-MS analysis (Fig. S2 and S3†) and 1H-, 13C-, and 19F-NMR (Fig. S4–S6†) were performed. From the analysis of the GC chromatogram (Fig. S2†), a single peak is observed at 6.69 min, whose mass spectrum (Fig. S3†) is characteristic for (E)-(2,6-difluorophenyl)-1-(4-fluorophenyl)prop-2-en-1-one (FCH) fragments (m/z 262, 243, 167, 139, 123 and 95). Moreover, the high purity and molecular structure of FCH crystals were also determined by 1H-, 13C-, and 19F-NMR and described below: 1H-NMR (500 MHz, CDCl3) δ 7.86 (d, J = 16.2 Hz, 1H), 7.63 (d, J = 16.2 Hz, 1H), 7.58 (d, J = 1.0 Hz, 1H), 7.28–7.19 (m, 2H), 6.87 (t, J = 8.6 Hz, 2H), 6.51 (dd, J = 3.5, 1.7 Hz, 1H); 13C-NMR (126 MHz, CDCl3) δ 177.98 (s), 162.06 (dd, J = 256.0, 6.8 Hz), 153.59 (s), 146.87 (s), 145.95 (s), 131.30 (t, J = 11.1 Hz), 129.79 (t, J = 2.2 Hz), 126.82 (t, J = 8.5 Hz), 118.03 (s), 112.56 (s), 111.91 (dd, J = 21.4, 4.7 Hz); 19F-NMR (376 MHz, CDCl3) δ −105.13, −109.69.The TG/TGA evaluation of FCH under nitrogen purge gases is shown in ESI.† The thermogram of chalcone shows that the thermal decomposition occurs between 100 °C and 250 °C (Fig. 3a). The decomposition occurs in a well-defined event represented by a single DTG peak reaching 0% of mass loss. Fig. 3b shows the UV-Vis absorption of FCH. Due to the presence of n–π* transition on the structure of the fluorinated chalcone FCH, an absorption band in the UV-region (280–340 nm) was observed.50
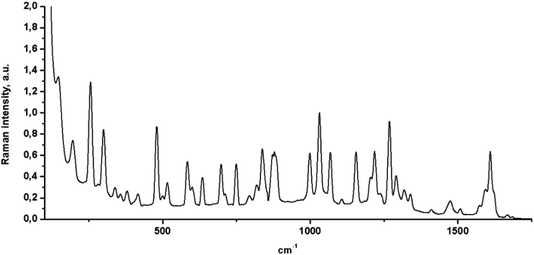
Raman microspectroscopy was also used to characterize the FCH, and its spectrum was normalized at 1032 cm−1 (Fig. 4). From the analysis of Fig. 4, C–H stretching vibrations were observed at 1029, 1070, 1157, 1217 and, 1269 cm−1 with a strong Raman intensity. The C–H out-of-plane deformations were observed at 747, 838, 876, and 996 cm−1 for FCH crystal. The C–F Raman band can be observed between 560 and 610 cm−1. Additionally, C–C stretching vibrations also were observed at 1293, 1320, 1337, 1411, 1477, and 1509 cm−1. A sharp band at 1608 cm−1 was also observed and assigned to ethylenic bridge vibrations. The C![[double bond, length as m-dash]](https://www.rsc.org/images/entities/char_e001.gif) O vibrations were also observed as a weak Raman band at 1670 cm−1. This weak Raman band may be explained by intermolecular hydrogen bonding between the C
O vibrations were also observed as a weak Raman band at 1670 cm−1. This weak Raman band may be explained by intermolecular hydrogen bonding between the C![[double bond, length as m-dash]](https://www.rsc.org/images/entities/char_e001.gif) O group and a phenyl ring from the FCH.
O group and a phenyl ring from the FCH.
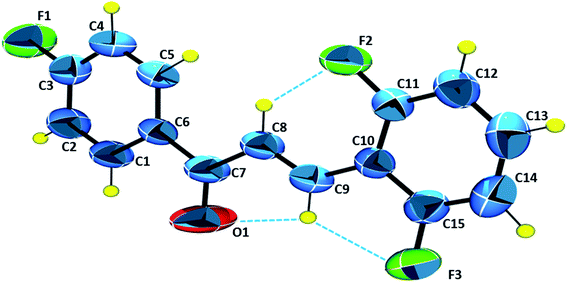
The ORTEP diagram with the asymmetric unit is presented in Fig. 5. The molecule has in its structure three fluorine atoms, in the ortho and para positions. The carbonyl group C7![[double bond, length as m-dash]](https://www.rsc.org/images/entities/char_e001.gif) O1 appears in an (E)-configuration with respect to the stereochemistry C8
O1 appears in an (E)-configuration with respect to the stereochemistry C8![[double bond, length as m-dash]](https://www.rsc.org/images/entities/char_e001.gif) C9. The molecular coplanarity is indicated by C5–C6–C7–O1, C6–C7–C8–C9 and C8–C9–C10–C15 dihedral angles respectively are 178.5°, −178.89° and −178.0°. Planarity of chalcones is correlated with π conjugation in molecule, being evidenced in the literature, which contributes to their use as potential optical devices.51
C9. The molecular coplanarity is indicated by C5–C6–C7–O1, C6–C7–C8–C9 and C8–C9–C10–C15 dihedral angles respectively are 178.5°, −178.89° and −178.0°. Planarity of chalcones is correlated with π conjugation in molecule, being evidenced in the literature, which contributes to their use as potential optical devices.51
The chalcone compound is crystallized from the P21/c centrosymmetric monoclinic space group with Z = 4, which represents 4 molecules in the unit cell. The final structural refinement data and the main crystallographic parameters are presented in Table 1. In addition, other details such the principal bond distance, angles and dihedral angles are shown in Table 2. Table 2 shows that the experimental and theoretical selected geometric parameters are in good agreement. The C5–C6–C7–O1, O1–C7–C8–C9 and O1–C7–C8–H8 theoretical dihedral angles are 162.7°, 9.7° and 168.8°, respectively, while experimental dihedral angles are 178.5°, 1.8° and 178.0°, respectively, as shown in Table 2. These differences can be explained by taking into account that the theoretical results were obtained in the gas phase, not taking into account the interactions that occur in the crystalline environment. The intermolecular interactions presented in all crystal structures are listed in Table 3.
| Experimental | Theoretical | Experimental | Theoretical | ||
|---|---|---|---|---|---|
| O1–C7 | 1.213(2) | 1.212 | F2–C11–C12 | 117.13(16) | 117.5 |
| F1–C3 | 1.360(3) | 1.340 | F3–C15–C10 | 117.4(17) | 117.9 |
| F2–C11 | 1.354(2) | 1.341 | O1–C7–C8 | 120.4(2) | 121.5 |
| F3–C15 | 1.349(3) | 1.339 | C8–C9–C10–C11 | 2.3(3) | 0.7 |
| C5–C6 | 1.392(2) | 1.396 | C8–C9–C10–C15 | −178.0(2) | −179.3 |
| C6–C7 | 1.488(3) | 1.498 | C5–C6–C7–O1 | 178.5(2) | 162.7 |
| C8–C9 | 1.313(3) | 1.339 | C6–C7–C8–C9 | −178.8(18) | 171.1 |
| C10–C11 | 1.392(2) | 1.398 | C1–C6–C7–C8 | 178.7(17) | 163.3 |
| C8–C9–C10 | 122.0(13) | 128.0 | C5–C6–C7–C8 | 0.8(3) | −18.0 |
| C9–C10–C15 | 120.6(16) | 119.6 | F1–C3–C4–C5 | −178.8(19) | −179.3 |
| O1–C7–C6 | 120.1(19) | 117.8 | F2–C11–C12–C13 | −179.2(17) | 179.8 |
| C6–C7–C8 | 119.4(15) | 118.1 | C9–C10–C15–F3 | 0.3(3) | −0.05 |
| C1–C6–C7 | 118.4(15) | 117.8 | O1–C7–C8–C9 | 1.8(3) | 9.7 |
| C5–C6–C7 | 123.0(16) | 122.8 | O1–C7–C8–H8 | 178.0(1) | 168.8 |
| F1–C3–C4 | 118.7(19) | 118.6 | C6–C7–C8–H8 | −3.0(1) | −10.3 |
| D–H⋯A | D–H | H⋯A | D⋯A | D–H⋯A | Symmetry code |
|---|---|---|---|---|---|
| C5–H5⋯O1 | 0.97 | 2.50 | 3.2974(1) | 139.0(16) | x, 1/2 − y, 1/2 + z |
| C8–H8⋯F2 | 0.94 | 2.26 | 2.8457(1) | 119.6(16) | Intramolecular |
| C9–H9⋯F3 | 0.91 | 2.37 | 2.7590(1) | 105.7(15) | Intramolecular |
| C9–H9⋯O1 | 0.91 | 2.44 | 2.7753(1) | 101.6(14) | Intramolecular |
| C14–H14⋯F1 | 0.95 | 2.54 | 3.4769(2) | 173.0(2) | 1 + x, 1 + y, z |
| C4–H4⋯F2 | 0.89 | 2.616 | 3.464 | 158.56(2) | 1 − x, −1/2 + y, 1.5 − z |
| C1–H1⋯O1 | 0.96 | 2.42 | 2.767 | 101.3 | Intramolecular |
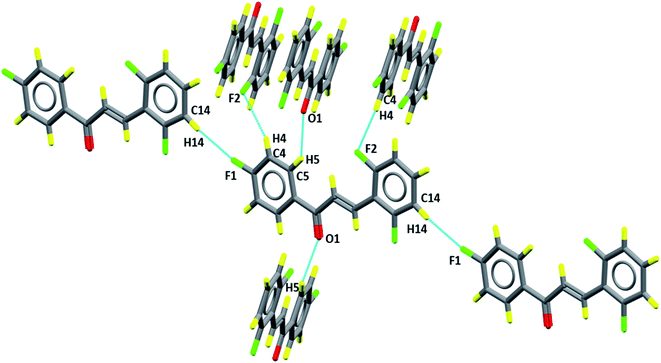
The packing diagram, in Fig. 6, shows the motifs in the crystalline lattice. It was observed that crystal structure is stabilized by intermolecular interactions (Table 3), since C–H groups are hydrogen bonding donors, C5–H5⋯O1 which can be described as C11(5), involving a carbonyl group (Fig. 6) which results in the formation of linear chains running along the c axis, while for C4–H4⋯F2 and C14–H14⋯F1 the graph set is given as C11(10) and C11(12), involving, respectively, fluorine F2 and F1, which are located in Cg2 (C10–C15) and Cg1 (C1–C6) aromatic rings, respectively. These intermolecular interactions describe supramolecular architectures.
The Hirshfeld surface contributes to the understanding of packaging, promotes the analysis of intermolecular interactions and enables the recognition of predominant bonds. The HS mapped over dnorm (ranging from −0.0635 to 3392 Å) is shown in Fig. 7. In it, the compound is stabilized by hydrogen bonds, on which the red spots display the dnorm identifying the region in which interactions C5–H5⋯O1/O1⋯H5–C5 (Fig. 7a) of the FCH are depicted. In addition, interactions C14–H14⋯F1/F1⋯H14–C14 (Fig. 7b) and C4–H4⋯F2/F2⋯H4–C4 (Fig. 7c), despite being flagged as weak, are relevant for packaging stabilization. Thus, planarity is correlated with conjugation throughout the molecule.
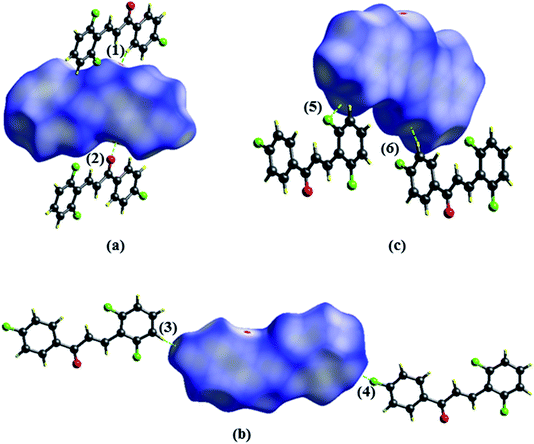 | ||
| Fig. 7 Hirshfeld surfaces plotted for FCH (a) C5–H5⋯O1 (1)/O1⋯H5–C5–F1 (2), (b) F1⋯H14–C14 (3)/C14–H14⋯F (4) and (c) C4–H4⋯F2 (5)/F2⋯H4–C4 (6). Dotted lines were used to represent hydrogen bonds. | ||
Shape index is a graphical tool that reveals hydrophobic interactions and aids to interpret the interactions that occur in system π. The interaction π⋯π (Fig. 8a) is displayed by red and blue triangles, where occur the overlapping of two aromatic rings occurs; for this interaction, the aromatic ring centroids were calculated (Fig. 8b), with the distance between two rings of 3.856 Å, providing greater stability to the structure.
 | ||
| Fig. 8 Shape index surfaces of (a) evidencing π⋯π interactions. Representation of π⋯π interactions (b). | ||
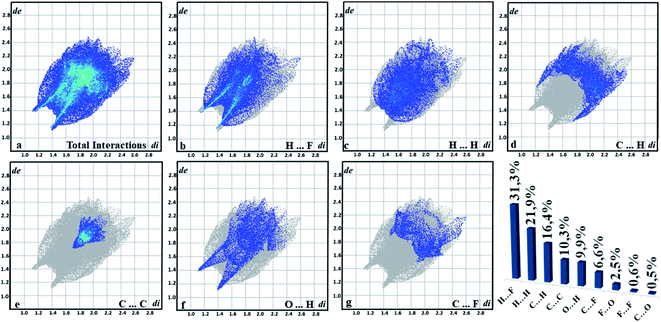
The quantitative summary is generated from the graph of (de vs. di) resulting from the contributions of each interaction that is exposed in the supramolecular arrangement. The interactions are highlighted in fingerprint plots (Fig. 9), in which most contacts are related to the interaction H⋯F (31.3%), which indicates the C–H⋯F contacts. As this is an organic compound, the H⋯H interactions had a high value (21.9%), followed by the C⋯H connection (16.4%). Another characteristic of chalcone is the presence of C⋯C interactions (10.13%) present in the center, which helps in understanding π⋯π bonding. O⋯H interactions (9.9%) are characterized by peaks at the bottom of the fingerprint plots and the contacts C⋯F (6.6%). It is observed that these interactions become important for the stabilization of the supramolecular arrangement. Additionally, solid-state UV-Vis absorption spectrum of FCH clearly shows a maximum absorption peak at ∼409 nm, similar to the chalcone-type molecules (Fig. 3).
Molecular modeling description
The root of the mean squared (RMS) value, predicted by Mercury software, which accounts for the difference between theoretical and experimental geometries, was 0.00934. The overlap geometries show a good agreement of the geometric parameters (Fig. 10). The aromatic ring (Cg1) displays a theoretical dihedral twist C1–C6–C7–C8 and C5–C6–C7–C8 of 163.3° and −18.0° that differ by experimental dihedral angles, whose value is 178.7° and 0.8°, respectively (Table 2). This contribution to solid state planarity is indicated by π![[dash dash, graph caption]](https://www.rsc.org/images/entities/char_e091.gif) π (Cg1
π (Cg1![[dash dash, graph caption]](https://www.rsc.org/images/entities/char_e091.gif) Cg2) intermolecular interaction.
Cg2) intermolecular interaction.
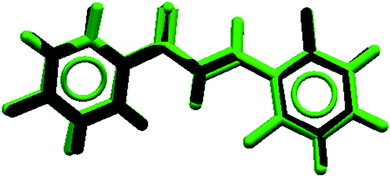 | ||
| Fig. 10 Overlapping of X-ray geometric parameters (black) and theoretical calculation (green) structures for FCH. | ||
Fig. 11 shows the frontier molecular orbital (FMO) obtained at the M062X/6-311++G(d,p) level of theory. The FMO analysis of bond-antibonding interactions is taken into consideration by filled (donor) Lewis base and empty (acceptor) Lewis acid. The HOMO as the electron donor is localized on the π bond, and the olefin region appears as a π bonding orbital, which is characteristic of the nucleophilic region. The HOMO energy is −192.06 kcal mol−1. The LUMO orbital is a π antibonding orbital localized on the C7![[double bond, length as m-dash]](https://www.rsc.org/images/entities/char_e001.gif) O1 carbonyl group. The LUMO energy is −41.39 kcal mol−1, indicating that the FCH is an electrophilic species.
O1 carbonyl group. The LUMO energy is −41.39 kcal mol−1, indicating that the FCH is an electrophilic species.
The MEP topology is a physicochemical tool that identify the chemical reactivity of the molecular systems.52 The electrostatic potential can be determined using eqn (8):
 | (8) |
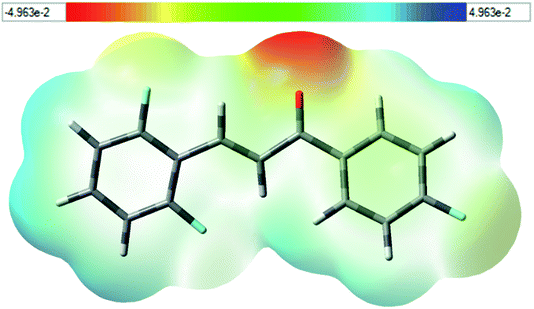
![[double bond, length as m-dash]](https://www.rsc.org/images/entities/char_e001.gif) O1), with value about −31.06 kcal mol−1. On the other hand, the blue region specified the most positive potential (strongest repulsion), and the isovalue potential energy of about 21.84 kcal mol−1 is around the hydrogen atoms in Cg2 (C10–C15). These results identify the electrophilic and nucleophilic site attacks and provide an understanding of where FCH interacts intermolecularly.
O1), with value about −31.06 kcal mol−1. On the other hand, the blue region specified the most positive potential (strongest repulsion), and the isovalue potential energy of about 21.84 kcal mol−1 is around the hydrogen atoms in Cg2 (C10–C15). These results identify the electrophilic and nucleophilic site attacks and provide an understanding of where FCH interacts intermolecularly.
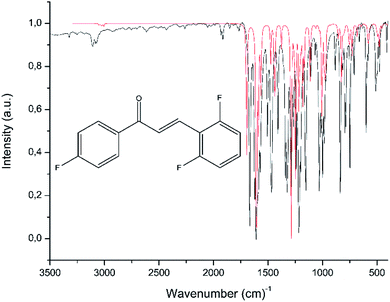
Table 4 displays some selected theoretical and experimental IR absorption bands. Fig. 13 compares the experimental and theoretical IR spectra graphically. The theoretical vibrational frequency values were scaled by 0.943 (ref. 53) for a better fit with the experimental results. In chalcones, the resonance effects of α,β-unsaturated ketone must be recognized; the stretching of Csp2–H absorbs in the 3106–3077 cm−1, while the computed wavenumbers are in the range of 3078–3006 cm−1. Experimentally, the theoretical measurements of the carbonyl group, made supposing the molecule was in gas phase, absorb at 1695 cm−1, while the experimental measurements, in which the decrease of the vibration frequency value occurs due to the molecular hydrogen interaction, absorb at 1666 cm−1.54 The FT-IR spectrum of FCH indicates a good correlation to the theoretical data obtained in the gas phase
| Vibrational mode | Exp. freq.b | Scaled freq.b,c |
|---|---|---|
| a ν = stretching; δ = bending.b cm−1.c Scale factor 0.943.d Ar = aromatic ring.e Alk = alkene. | ||
| ν(C–H)Ard, Alke | 3106–3077 | 3078–3006 |
ν(C![[double bond, length as m-dash]](https://www.rsc.org/images/entities/char_e001.gif) O) and ν(C O) and ν(C![[double bond, length as m-dash]](https://www.rsc.org/images/entities/char_e001.gif) C)Alke C)Alke |
1666 | 1695 |
ν(C![[double bond, length as m-dash]](https://www.rsc.org/images/entities/char_e001.gif) C)Ard, Alke C)Ard, Alke |
1621–1572 | 1608–1563 |
ν(C![[double bond, length as m-dash]](https://www.rsc.org/images/entities/char_e001.gif) C)Ard; δ(C C)Ard; δ(C![[double bond, length as m-dash]](https://www.rsc.org/images/entities/char_e001.gif) C)Ard and δ(C–H)Ard in plane C)Ard and δ(C–H)Ard in plane |
1507–1410 | 1475–1436 |
ν(C![[double bond, length as m-dash]](https://www.rsc.org/images/entities/char_e001.gif) C)Ard; δ(C–H)Ard in plane C)Ard; δ(C–H)Ard in plane |
1341 | 1376 |
ν(C![[double bond, length as m-dash]](https://www.rsc.org/images/entities/char_e001.gif) C)Ard and δ(C–H)Alke in plane C)Ard and δ(C–H)Alke in plane |
1290–1241 | 1267–1243 |
| δ(C–H)Ard, Alke in plane | 1153–1000 | 1200–1004 |
δ(C![[double bond, length as m-dash]](https://www.rsc.org/images/entities/char_e001.gif) C)Ard and δ(C–H)Ard, Alke out plane C)Ard and δ(C–H)Ard, Alke out plane |
990–974 | 978–926 |
δ(C![[double bond, length as m-dash]](https://www.rsc.org/images/entities/char_e001.gif) C)Ard and δ(C–H)Ard, Alke out plane C)Ard and δ(C–H)Ard, Alke out plane |
893–765 | 864–762 |
| δ(C–F) | 745–730 | 674 |
δ(C(O)–C![[double bond, length as m-dash]](https://www.rsc.org/images/entities/char_e001.gif) C) C) |
530–500 | 580 |
NLO properties
The DFT/CAM-B3LYP/6-311++G(d,p) results for the average linear polarizability (〈α(−ω;ω)〉), the IDRI second hyperpolarizability (〈γ(−ω;ω,ω,−ω)〉), the linear refractive index (n(ω)) and the third-order nonlinear susceptibility (χ(3)(−ω;ω,ω,−ω)) as a function of the electric frequency are shown in Table 5. In the frequency range of 0.0 a.u. ≤ ω ≤ 0.10 a.u., the 〈α(−ω;ω)〉-values and 〈γ(−ω;ω,ω,−ω)〉-values increased 17.31% and 348.22%, respectively, as compared with its static values. The linear refractive index values increased smoothly with the increasing frequency, from the static value (1.6409) up ω = 0.05 a.u. (1.6677) the enhancing at the n(ω)-value was only of 1.63%, and from this point up to ω = 0.10 a.u. the enhancement was of 7.3%. The third-order nonlinear susceptibility presents a significant increase due to the electric field frequency of 348.22%, going from the static value of 125.046 × 10⁻²² m2 V−2 to 562.093 × 10⁻²² m2 V−2.| ω | 〈α(−ω,ω)〉 | 〈γ(−ω;ω,ω,ω)〉 | n(ω) | χ3(−ω;ω,ω,ω) |
|---|---|---|---|---|
| 0.000 | 26.211 | 45.6651 | 1.6409 | 125.406 |
| 0.003 | 26.214 | 45.9547 | 1.6410 | 126.202 |
| 0.004 | 26.216 | 46.0031 | 1.6411 | 126.335 |
| 0.006 | 26.223 | 46.1417 | 1.6413 | 126.715 |
| 0.007 | 26.227 | 46.2321 | 1.6414 | 126.964 |
| 0.008 | 26.232 | 46.3365 | 1.6416 | 127.250 |
| 0.009 | 26.237 | 46.4551 | 1.6417 | 127.576 |
| 0.010 | 26.243 | 46.5879 | 1.6419 | 127.941 |
| 0.024 | 26.397 | 49.9849 | 1.6467 | 137.270 |
| 0.043 | 26.831 | 60.1717 | 1.6601 | 165.245 |
| 0.050 | 27.073 | 66.2793 | 1.6677 | 182.018 |
| 0.060 | 27.495 | 77.6933 | 1.6811 | 213.363 |
| 0.070 | 28.035 | 93.7787 | 1.6984 | 257.537 |
| 0.072 | 28.159 | 97.7381 | 1.7024 | 268.410 |
| 0.080 | 28.722 | 116.878 | 1.7207 | 320.972 |
| 0.086 | 29.191 | 134.474 | 1.7362 | 369.294 |
| 0.090 | 29.600 | 151.173 | 1.7499 | 415.154 |
| 0.095 | 30.140 | 174.773 | 1.7680 | 479.965 |
| 0.100 | 30.750 | 204.679 | 1.7890 | 562.093 |
Table 5 shows the results of the linear refractive index and the third-order nonlinear susceptibility for the crystal of FCH at electric field frequency of ω = 0.086 a.u. (λ = 532 nm). In addition, several experimental results obtained by Z-scan are presented by comparison. As can be seen, the (χ(3)(−ω;ω,ω,−ω))-value for FCH (369.294 × 10⁻²² m2 V−2) is greater than the other experimental values presented in Table 6. This value is 1.33 times the χ(3)-value measured for the crystal (2E)-3-(3-methylphenyl)-1-(4-nitrophenyl)prop-2-en-1-one (3MPNP)55 and 185.58 times the value for (2E)-1-(3-bromophenyl)-3-[4-(methylsulfanyl) phenyl]prop-2-en-1-one.56
| λ (nm) | n(ω) | χ(3)(−ω;ω,ω,−ω) | |
|---|---|---|---|
| FCH molecule (present work) | 532 | 1.736 | 369.294 |
| (2E)-3-(3-Methylphenyl)-1-(4-nitrophenyl)prop-2-en-1-one55 | 532 | 1.418 | 277.100 |
| (2E)-3-(3-Methylphenyl)-1-(4-nitrophenyl)prop-2-en-1-one47 | 532 | 2.002 | 176.400 |
| 4,6-Dichloro-2-(methylsulfonyl)pyrimidine45 | 532 | 1.613 | 56.740 |
| (E)-3-(2-Bromophenyl)-1-(2-((phenylsulfonyl)amine)-phenyl)prop-2-en-1-one44 | 1064 | 1.680 | 25.700 |
| 1-(5-Chlorothiophen-2-yl)-3-(2,3-dimethoxyphenyl)prop-2-en-1-one55,57 | 532 | 1.594 | 23.830 |
| 1-(5-Chlorothiophen-2-yl)-3-(2,3-dichlorophenyl)prop-2-en-1-one58 | 532 | — | 16.210 |
| 2-(4-Methylphenoxy)-N0-[(1E)-(4-nitrophenyl)methylene]acetohydrazide59 | 532 | — | 10.240 |
| 1-(4-Aminophenyl)-3-(3,4,5-trimethoxyphenyl)prop-2-en-1-one60 | 532 | — | 8.700 |
| (2E)-3-[4-(Methylsulfanyl)phenyl]-1-(4-nitrophenyl)prop-2-en-1-one56 | 800 | 1.363 | 2.370 |
| (2E)-1-(4-Bromophenyl)-3-[4-(methylsulfanyl)phenyl]prop-2-en-1-one56 | 800 | 1.365 | 2.300 |
| (2E)-1-(3-Bromophenyl)-3-[4-(methylsulfanyl)phenyl]prop-2-en-1-one56 | 800 | 1.360 | 1.990 |
The atomic charges of the FCH range between −0.5520e (O7) and 0.6396e (C20) for isolated molecules, and between −0.5957e (O7) and 0.6760e (C20) for embedded molecules, as can be seen in Table 7.
| A1 | ||||
|---|---|---|---|---|
| Atom | Isolated | Embedded | Δ% | |
| 1 | F | −0.2449 | −0.2430 | 0.75 |
| 2 | F | −0.2339 | −0.2550 | 9.05 |
| 3 | F | −0.2806 | −0.3058 | 8.99 |
| 4 | C | −0.1937 | −0.1963 | 1.35 |
| 5 | C | −0.1373 | −0.1692 | 23.21 |
| 6 | C | 0.3701 | 0.3554 | 3.97 |
| 7 | O | −0.5520 | −0.5957 | 7.92 |
| 8 | C | 0.1584 | 0.1706 | 7.67 |
| 9 | H | 0.0974 | 0.0812 | 16.64 |
| 10 | C | −0.0825 | −0.0806 | 2.20 |
| 11 | H | 0.1242 | 0.1603 | 29.09 |
| 12 | C | −0.4356 | −0.4508 | 3.48 |
| 13 | H | 0.1894 | 0.2003 | 5.76 |
| 14 | C | −0.0034 | 0.0232 | 777.33 |
| 15 | H | 0.1102 | 0.0965 | 12.47 |
| 16 | C | 0.3483 | 0.3485 | 0.05 |
| 17 | C | −0.2560 | −0.2532 | 1.10 |
| 18 | H | 0.1678 | 0.1868 | 11.33 |
| 19 | C | 0.4328 | 0.4231 | 2.24 |
| 20 | C | 0.6396 | 0.6760 | 5.68 |
| 21 | C | −0.2877 | −0.2808 | 2.39 |
| 22 | H | 0.1759 | 0.1855 | 5.43 |
| 23 | C | −0.2702 | −0.2717 | 0.56 |
| 24 | H | 0.1718 | 0.1770 | 3.05 |
| 25 | C | −0.0235 | −0.0078 | 66.96 |
| 26 | H | 0.1214 | 0.1304 | 7.38 |
| 27 | C | −0.2861 | −0.3029 | 5.86 |
| 28 | H | 0.1799 | 0.1981 | 10.13 |
| Ring A | ||||
| Ring B | ||||
| Ring C | ||||
The carbon atoms bonded to the oxygen atom (C20) and to the fluorine (C6, C16 and C19) are positive due to the negativity of the neighboring atom. The crystalline polarization effect was more significant on the charges of the carbon atoms C14, C25, and C5, with increasing of 77%, 67% and 23% respectively (Fig. 14). All the hydrogen atoms have naturally positive charge and only atoms H15 and H9 had their charges decreased due to the embedded packing process.
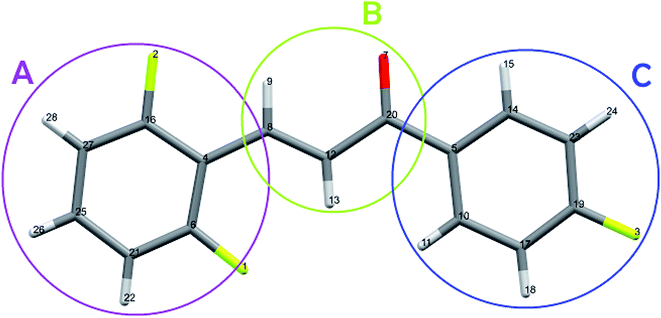 | ||
| Fig. 14 Highlight of the rings A, B and C, with the atoms numbered as presented in Table 7. | ||
4. Conclusion
In the present work, a new fluorinated chalcone derivative (FCH) was synthesized and crystals were grown by using slow evaporation method. Its structural characterization and determination of purity were carried out by scanning electron microscopy, infrared spectroscopy, gas chromatography-mass spectrometry, 1H, 13C and 19F nuclear magnetic resonance, differential scanning calorimetry (DSC), Raman microspectroscopy, UV-Vis absorption spectroscopy, and single crystal X-ray diffraction (XRD). The Hirshfeld surface and fingerprints were performed to identify and quantify the intermolecular interactions that occur in the molecule, in order to provide information about crystal packing and considerable values in the quantification of interactions H⋯F (31.3%) by influence of fluorine substituents C⋯C (10.13%), which evidence the interaction π⋯π confirmed by the shape index. With this investigation, it is possible to report that crystal packing is stabilized by intermolecular factors, for example, interactions C–H⋯O and C–H⋯F. The FMO indicates that FCH chalcone is an electrophilic species. MEP is consistent with the susceptible electrophilic attack around the oxygen atom of the carbonyl group. In general, the theoretical IR absorptions bands are consistent with the experimental IR-FT bands and Raman spectra.The crystalline environment of the FCH chalcone crystal was simulated through the supermolecular approach where a bulk with 378![[thin space (1/6-em)]](https://www.rsc.org/images/entities/char_2009.gif) 000 atoms was built. The electric parameters such as the dipole moment, average linear polarizability and second hyperpolarizabilities corresponding to the Kerr effect and IDRI process were calculated at DFT/CAM-B3LYP/6-311++G(d,p) level as a function of the electric field frequency. The macroscopic parameters such as the linear refractive index and the third-order nonlinear susceptibility were also calculated, and the results compared with experimental data were obtained from literature. At ω = 0.086 a.u. the χ(3)-value for the Chalcone crystal is of 369.294 × 10⁻²² m2 V−2; this value is 1.33 times the experimental value for the 3MPNP55 and hundreds of times higher than some values experimentally obtained for other organic compounds, as shown in Table 6. Therefore, the chalcone crystal must be considered as a potential material to use in the fabrication of photonic devices.
000 atoms was built. The electric parameters such as the dipole moment, average linear polarizability and second hyperpolarizabilities corresponding to the Kerr effect and IDRI process were calculated at DFT/CAM-B3LYP/6-311++G(d,p) level as a function of the electric field frequency. The macroscopic parameters such as the linear refractive index and the third-order nonlinear susceptibility were also calculated, and the results compared with experimental data were obtained from literature. At ω = 0.086 a.u. the χ(3)-value for the Chalcone crystal is of 369.294 × 10⁻²² m2 V−2; this value is 1.33 times the experimental value for the 3MPNP55 and hundreds of times higher than some values experimentally obtained for other organic compounds, as shown in Table 6. Therefore, the chalcone crystal must be considered as a potential material to use in the fabrication of photonic devices.
Conflicts of interest
There are no conflicts to declare.Acknowledgements
The authors are thankful to Conselho Nacional de Desenvolvimento Científico e Tecnológico (CNPq), Fundação de Amparo à Pesquisa de Goiás (FAPEG) and to Coordenação de Aperfeiçoamento de Pessoal de Nível Superior (CAPES, Grant No. 465360/2014-9 to I. I.) for financial supports. Also, the authors are grateful to the High Performance Computing Center of the Universidade Estadual de Goiás (UEG) and to EZAT Análises Térmicas in the name of Pedro Zanetti Ribeiro Ferreira for the support in DSC analysis. L. D. D. thanks Fundação de Amparo à Pesquisa do Estado de São Paulo (FAPESP) for Post-doctoral grant 2019/13569-8. This work also was funded by FAPESP (CEPOF 2013/07276-1), and INCT “Basic Optics and Applied to Life Sciences” (FAPESP 2014/50857-8, CNPq 465360/2014-9).References
- K. Wu and S. Pan, Coord. Chem. Rev., 2018, 377, 191–208 CrossRef CAS.
- S. Basu, Ind. Eng. Chem. Prod. Res. Dev., 1984, 23, 183–186 CrossRef CAS.
- S. Raghavendra, K. V. Anil Kumar, T. Chandra Shekhara Shetty and S. M. Dharmaprakash, J. Mol. Struct., 2014, 1074, 653–659 CrossRef CAS.
- M. F. Zaini, S. Arshad, K. Thanigaimani, N. C. Khalib, D. A. Zainuri, M. Abdullah and I. A. Razak, J. Mol. Struct., 2019, 1195, 606–619 CrossRef CAS.
- E. D. D'Silva, G. K. Podagatlapalli, S. V. Rao, D. N. Rao and S. M. Dharmaprakash, Cryst. Growth Des., 2011, 11, 5362–5369 CrossRef.
- A. N. Prabhu, A. Jayarama, K. Subrahmanya Bhat and V. Upadhyaya, J. Mol. Struct., 2013, 1031, 79–84 CrossRef CAS.
- A. M. Arif, A. Yousaf, H. Xu and Z.-M. Su, Dyes Pigm., 2019, 171, 107742 CrossRef CAS.
- L. Eriksson, Int. J. Quantum Chem., 1992, 42, 1771–1772 CrossRef.
- C. Jiménez, A. Enríquez-Cabrera, O. González-Antonio, J. Ordóñez-Hernández, P. Lacroix, P. Labra-Vázquez, N. Farfán and R. Santillan, Inorganics, 2018, 6, 131 CrossRef.
- J.-X. Dong and H.-L. Zhang, Chin. Chem. Lett., 2016, 27, 1097–1104 CrossRef CAS.
- L. Beverina and G. A. Pagani, Acc. Chem. Res., 2014, 47, 319–329 CrossRef CAS PubMed.
- M. Albota, Science, 1998, 281, 1653–1656 CrossRef CAS PubMed.
- Y. Yang, X. Wu, J. Jia, L. Shen, W. Zhou, J. Yang and Y. Song, Opt. Laser Technol., 2020, 123, 105903 CrossRef CAS.
- E. Mathew, V. V. Salian, I. Hubert Joe and B. Narayana, Opt. Laser Technol., 2019, 120, 105697 CrossRef CAS.
- J. M. F. Custodio, C. N. Perez, C. Valverde, F. A. P. Osório and H. B. Napolitano, Chem. Phys. Lett., 2020, 738, 136852 CrossRef.
- S. Veeramanikandan, H. B. Sherine, A. Dhandapani and S. Subashchandrabose, J. Mol. Struct., 2019, 1180, 798–811 CrossRef CAS.
- J. M. F. Custodio, C. A. Moreira, C. Valverde, G. L. B. De Aquino, B. Baseiaa and H. B. Napolitano, J. Braz. Chem. Soc., 2018, 29, 258–268 CAS.
- L. R. Almeida, M. M. Anjos, G. C. Ribeiro, C. Valverde, D. F. S. Machado, G. R. Oliveira, H. B. Napolitano and H. C. B. de Oliveira, New J. Chem., 2017, 41, 1744–1754 RSC.
- L. M. G. Abegão, R. D. Fonseca, F. A. Santos, G. B. Souza, A. L. B. S. Barreiros, M. L. Barreiros, M. A. R. C. Alencar, C. R. Mendonça, D. L. Silva, L. De Boni and J. J. Rodrigues, Chem. Phys. Lett., 2016, 648, 91–96 CrossRef.
- A. H. Anizaim, S. Arshad, M. F. Zaini, M. Abdullah, D. A. Zainuri and I. A. Razak, Opt. Mater., 2019, 98, 109406 CrossRef CAS.
- C. Zhuang, W. Zhang, C. Sheng, W. Zhang, C. Xing and Z. Miao, Chem. Rev., 2017, 117, 7762–7810 CrossRef CAS PubMed.
- C. B. Patil, S. K. Mahajan and S. A. Katti, J. Pharm. Sci. Res., 2009, 1, 11–22 CAS.
- A. Ghouili, M. Dusek, V. Petricek, T. Ben Ayed and R. Ben Hassen, J. Phys. Chem. Solids, 2014, 75, 188–193 CrossRef CAS.
- C. Valverde, W. F. Vaz, J. M. F. Custodio, V. S. Duarte, P. S. Carvalho-Jr, A. S. Figueredo, G. L. B. de Aquino, B. Baseia and H. B. Napolitano, New J. Chem., 2017, 41, 11361–11371 RSC.
- A. N. Castro, F. A. P. Osório, R. R. Ternavisk, H. B. Napolitano, C. Valverde and B. Baseia, Chem. Phys. Lett., 2017, 681, 110–123 CrossRef CAS.
- C. Valverde, R. F. N. Rodrigues, D. F. S. Machado, B. Baseia and H. C. B. de Oliveira, J. Mol. Model., 2017, 23, 122 CrossRef PubMed.
- B. Baseia, F. Osório, L. Lima and C. Valverde, Crystals, 2017, 7, 158 CrossRef.
- R. F. N. Rodrigues, L. R. Almeida, F. G. dos Santos, P. S. Carvalho, W. C. de Souza, K. S. Moreira, G. L. B. de Aquino, C. Valverde, H. B. Napolitano and B. Baseia, PLoS One, 2017, 12, e0175859 CrossRef PubMed.
- J. Custodio, C. Moreira, C. Valverde, G. de Aquino, B. Baseia and H. Napolitano, J. Braz. Chem. Soc., 2017, 28(11), 2180–2191 CAS.
- G. C. Ribeiro, L. R. Almeida, H. B. Napolitano, C. Valverde and B. Baseia, Theor. Chem. Acc., 2016, 135, 244 Search PubMed.
- G. M. Sheldrick, Acta Crystallogr., Sect. A: Found. Crystallogr., 2015, 71, 3–8 CrossRef PubMed.
- G. M. Sheldrick, Acta Crystallogr., Sect. A: Found. Crystallogr., 2008, 64, 112–122 CrossRef CAS PubMed.
- O. V. Dolomanov, L. J. Bourhis, R. J. Gildea, J. A. K. Howard and H. Puschmann, J. Appl. Crystallogr., 2009, 42, 339–341 CrossRef CAS.
- L. J. Farrugia, J. Appl. Crystallogr., 2012, 45, 849–854 CrossRef CAS.
- C. F. Macrae, P. R. Edgington, P. McCabe, E. Pidcock, G. P. Shields, R. Taylor, M. Towler and J. van de Streek, J. Appl. Crystallogr., 2006, 39, 453–457 CrossRef CAS.
- M. J. Turner, J. J. McKinnon, S. K. Wolff, D. J. Grimwood, P. R. Spackman, D. Jayatilaka and M. A. Spackman, CrystalExplorer17, Univ. West. Aust., 2017 Search PubMed.
- A. L. Spek, Acta Crystallogr., Sect. D: Biol. Crystallogr., 2009, 65, 148–155 CrossRef CAS PubMed.
- M. A. Spackman and D. Jayatilaka, CrystEngComm, 2009, 11, 19–32 RSC.
- J. J. McKinnon, D. Jayatilaka and M. A. Spackman, Chem. Commun., 2007, 3814–3816 RSC.
- M. A. Spackman and J. J. McKinnon, CrystEngComm, 2002, 4, 378–392 RSC.
- M. J. Frisch, G. W. Trucks, H. B. Schlegel, G. E. Scuseria, M. A. Robb, J. R. Cheeseman, G. Scalmani, V. Barone, B. Mennucci, G. A. Petersson, H. Nakatsuji, M. Caricato, X. Li, H. P. Hratchian, A. F. Izmaylov, J. Bloino, G. Zheng, J. L. Sonnenberg, M. Hada, M. Ehara, K. Toyota, R. Fukuda, J. Hasegawa, M. Ishida, T. Nakajima, Y. Honda, O. Kitao, H. Nakai, T. Vreven, J. A. Montgomery, J. E. Peralta, F. Ogliaro, M. Bearpark, J. J. Heyd, E. Brothers, K. N. Kudin, V. N. Staroverov, T. Keith, R. Kobayashi, J. Normand, K. Raghavachari, A. Rendell, J. C. Burant, S. S. Iyengar, J. Tomasi, M. Cossi, N. Rega, J. M. Millam, M. Klene, J. E. Knox, J. B. Cross, V. Bakken, C. Adamo, J. Jaramillo, R. Gomperts, R. E. Stratmann, O. Yazyev, A. J. Austin, R. Cammi, C. Pomelli, J. W. Ochterski, R. L. Martin, K. Morokuma, V. G. Zakrzewski, G. A. Voth, P. Salvador, J. J. Dannenberg, S. Dapprich, A. D. Daniels, O. Farkas, J. B. Foresman, J. V Ortiz, J. Cioslowski, D. J. Fox, J. A. Montgomery Jr., J. E. Peralta, F. Ogliaro, M. Bearpark, J. J. Heyd, E. Brothers, K. N. Kudin, V. N. Staroverov, R. Kobayashi, J. Normand, K. Raghavachari, A. Rendell, J. C. Burant, S. S. Iyengar, J. Tomasi, M. Cossi, N. Rega, J. M. Millam, M. Klene, J. E. Knox, J. B. Cross, V. Bakken, C. Adamo, J. Jaramillo, R. Gomperts, R. E. Stratmann, O. Yazyev, A. J. Austin, R. Cammi, C. Pomelli, J. W. Ochterski, R. L. Martin, K. Morokuma, V. G. Zakrzewski, G. A. Voth, P. Salvador, J. J. Dannenberg, S. Dapprich, A. D. Daniels, Ö. Farkas, J. B. Foresman, J. V Ortiz, J. Cioslowski and D. J. Fox, Gaussian Inc., 2013, vol. 34, pp. 1–20.
- Y. Zhao and D. G. Truhlar, Theor. Chem. Acc., 2008, 120, 215–241 Search PubMed.
- F. Weinhold and C. R. Landis, Valency and bonding A Natural Bond Orbital Donor–Acceptor Perspective, 2005 Search PubMed.
- J. M. F. Custodio, G. D. C. D'Oliveira, F. Gotardo, L. H. Z. Cocca, L. De Boni, C. N. Perez, L. J. Q. Maia, C. Valverde, F. A. P. Osório and H. B. Napolitano, J. Phys. Chem. C, 2019, 123, 5931–5941 CrossRef CAS.
- P. K. Murthy, C. Valverde, V. Suneetha, S. Armaković, S. J. Armaković, N. U. Rani and N. V. Naidu, J. Mol. Struct., 2019, 1186, 263–275 CrossRef CAS.
- J. M. F. Custodio, R. R. Ternavisk, C. J. S. Ferreira, A. S. Figueredo, G. L. B. Aquino, H. B. Napolitano, C. Valverde and B. Baseia, J. Phys. Chem. A, 2019, 123, 153–162 CrossRef CAS PubMed.
- C. Valverde, F. A. P. Osório, T. L. Fonseca and B. Baseia, Chem. Phys. Lett., 2018, 706, 170–174 CrossRef CAS.
- J. M. F. Custodio, F. G. Santos, W. F. Vaz, C. E. P. Cunha, R. G. Silveira, M. M. Anjos, C. E. M. Campos, G. R. Oliveira, F. T. Martins, C. C. da Silva, C. Valverde, B. Baseia and H. B. Napolitano, J. Mol. Struct., 2018, 1157, 210–221 CrossRef CAS.
- M. J. Frisch, G. W. Trucks, H. B. Schlegel, G. E. Scuseria, M. A. Robb, J. R. Cheeseman, G. Scalmani, V. Barone, B. Mennucci, G. A. Petersson, H. Nakatsuji, M. Caricato, X. Li, H. P. Hratchian, A. F. Izmaylov, J. Bloino, G. Zheng, J. L. Sonnenberg, M. Hada, M. Ehara, K. Toyota, R. Fukuda, J. Hasegawa, M. Ishida, T. Nakajima, Y. Honda, O. Kitao, H. Nakai, T. Vreven, J. A. Montgomery Jr, P. E. Peralta, F. Ogliaro, M. Bearpark, J. J. Heyd, E. Brothers, K. N. Kudin, V. N. Staroverov, R. Kobayashi, J. Normand, K. Raghavachari, A. Rendell, J. C. Burant, S. S. Iyengar, J. Tomasi, M. Cossi, N. Rega, N. J. Millam, M. Klene, J. E. Knox, J. B. Cross, V. Bakken, C. Adamo, J. Jaramillo, R. Gomperts, R. E. Stratmann, O. Yazyev, A. J. Austin, R. Cammi, C. Pomelli, J. W. Ochterski, R. L. Martin, K. Morokuma, V. G. Zakrzewski, G. A. Voth, P. Salvador, J. J. Dannenberg, S. Dapprich, A. D. Daniels, Ö Farkas, J. V. Ortiz, J. Cioslowski and D. J. Fox, Gaussian 09, revision C.01, Gaussian Inc., Wallingford, CT, 2009 Search PubMed.
- W. B. Black and R. E. Lutz, J. Am. Chem. Soc., 1955, 77, 5134–5140 CrossRef CAS.
- A. P. Menezes, A. Jayarama and S. W. Ng, J. Mol. Struct., 2015, 1088, 85–94 CrossRef CAS.
- P. Politzer and D. G. Truhlar, Chemical Applications of Atomic and Molecular Electrostatic Potentials Reactivity, Structure, Scattering, and Energetics of Organic, Inorganic, and Biological Systems, New York, 1st edn, 1981 Search PubMed.
- H. Yin and X. Kong, J. Am. Soc. Mass Spectrom., 2015, 26, 1455–1461 CrossRef CAS PubMed.
- D. L. Pavia, G. M. Lampman, G. S. Kriz and J. A. Vyvyan, Introduction to Spectroscopy, Cengage Learning, Mason, Ohio, 5th edn, 2015 Search PubMed.
- S. R. Prabhu, A. Jayarama, K. Chandrasekharan, V. Upadhyaya and S. W. Ng, J. Mol. Struct., 2017, 1136, 244–252 CrossRef CAS.
- E. D. D'silva, G. K. Podagatlapalli, S. Venugopal Rao and S. M. Dharmaprakash, Mater. Res. Bull., 2012, 47, 3552–3557 CrossRef.
- A. N. Prabhu, V. Upadhyaya, A. Jayarama and K. Subrahmanya Bhat, Mater. Chem. Phys., 2013, 138, 179–185 CrossRef CAS.
- A. N. Prabhu, V. Upadhyaya, A. Jayarama and K. S. Bhat, Mol. Cryst. Liq. Cryst., 2016, 637, 76–86 CrossRef CAS.
- K. Naseema, K. Sujith, K. B. Manjunatha, B. Kalluraya, G. Umesh and V. Rao, Opt. Laser Technol., 2010, 42, 741–748 CrossRef CAS.
- H. J. Ravindra, K. Chandrashekaran, W. T. A. Harrison and S. M. Dharmaprakash, Appl. Phys. B, 2009, 94, 503–511 CrossRef CAS.
Footnote |
| † Electronic supplementary information (ESI) available. CCDC 1997399. For ESI and crystallographic data in CIF or other electronic format see DOI: 10.1039/d0ra03634j |
| This journal is © The Royal Society of Chemistry 2020 |

