 Open Access Article
Creative Commons Attribution 3.0 Unported Licence
Development of a flexible, sweat-based neuropeptide Y detection platform†
Nathan Kodjo Mintah Churcher‡
,
Sayali Upasham‡ ,
Paul Rice,
Serena Bhadsavle and
Shalini Prasad
 *
*
Department of Bioengineering, University of Texas at Dallas, Richardson, TX-75080, USA. E-mail: Shalini.Prasad@utdallas.edu
First published on 17th June 2020
Abstract
Neuropeptide Y (NPY) biomarker levels have a close association with the diagnosis of Major Depression Disorder (MDD) and anxiety disorders. Quantifying NPY in correlation to self-reported symptoms will be an important measure to ensure a relatively uniform diagnosis and help with disease prognosis of these disorders. The work presented is a novel, passive eccrine sweat based, electrochemical detection platform for quantification of NPY biomarker levels. The paper offers a comparison between non-porous and porous sensor platforms using various electrochemical detection techniques. This work uses a novel strategy towards designing an optimal nanobioelectronic interface to measure NPY. The portability aspect of this detection platform is discussed by the demonstration a novel, portable EmStat Pico based electronic platform. The detection limit of the sensor is 10 pg mL−1 and its range is 20–500 pg mL−1. The NPY detection platform is envisioned to be a wearable point-of need monitoring system for management of chronic anxiety disorders and MDD.
1 Introduction
Clinical depression, medically known as Major Depression Disorder (MDD) is the most common mental disorder characterized by symptoms like overwhelming feeling of sadness, isolation, and despair that usually lasts for at least two weeks at a time. According to the World Health Organization's (WHO) global health estimates (2015), it was reported that 4% of the global population suffers from depression. Anxiety disorders are another contributor to these statistics as it is estimated that 3.6% of the global population struggles with anxiety disorders.1 In the United States, according to the statistics determined by the National Institute of Mental Health (NIMH), as of 2017, 17.3 million adults have had at least one MDD episode.2 Out of this population group, 3.4% succumb to suicide and an estimated 60% of those people were known to be suffering from some form of depression or anxiety disorder. Currently, there are no quantifiable biological tests to confirm the diagnosis of MDD. Apart from the variability in diagnosis of MDD due to the different phenotypes presented by the disorder, diagnosis is solely based on the clinical judgement and experience of doctors which adds another factor to this gap in disease identification. Quantifying a biomarker in correlation to self-reported symptoms of MDD will be an important measure to ensure a relatively uniform diagnosis of MDD across the globe as well as help in the monitoring and treating patients already diagnosed with the disorder. Neuropeptide Y (NPY) has been identified as such a biomarker and has been shown to have a significant increase in concentration in patients diagnosed with MDD.Neuropeptide Y (NPY) is a neuropeptide belonging to the pancreatic polypeptide family involved in various essential biological processes such as stress, cardiovascular regulation, appetite, and neuroendocrine modulation.3 It is about 36 amino acids long and one of the most abundant neuropeptides in the central nervous system, synthesized in the arcuate nucleus (ARC) of the hypothalamus.4 A proper functioning NPY system has anxiolytic effects, partially counteracting some of the physiological effects and hormones associated with an elevated stress level. High levels of NPY has been shown to protect against the development of disorders such as PTSD and bipolar disorder, whereas depressed levels can lead to a higher risk of chronic stress and stress-related disorders;5 thus, NPY is a good molecule to study to help quantify a patient's level of stress and their body's ability to counteract these stress levels. Currently, these mental disorders often go undiagnosed due to their subjective nature. A biosensor solution such as the one described in this paper offers discrete, objective, and actionable data for a more accurate diagnosis prospect. Current NPY biosensor solutions (highlighted in Table 1), while capable of NPY detection within physiological ranges, often are invasive or may lack sensitivity for the detection of NPY that is necessary for prognostic monitoring. Sampling for the analyte required to measure NPY levels would typically involve pricking or drawing blood. If the purpose of measuring the biomarker is to diagnose the effect of stress on the body or to quantify anxiety, then the stress created during sampling might add to the response and give a false sense of biomarker elevation. Commercially, biomarker estimation is performed using Enzyme Linked Immunosorbent assays (ELISAs) or Radioimmunoassays (RIAs). These techniques are sensitive but require large sample volumes and results are not in real-time. For monitoring stress in the body, we need a system that would measure the biomarker levels in real time as stressful events or episodes are often time sensitive. Sweat based biosensing offers a potential solution to this problem.6 Not only does it offer a non-invasive path for biomarker estimation, but it also facilitates usage of lower sample volumes for detection. For point-of-care and point-of-need devices, sweat based biosensing is a very important bridge to cross. It provides significant improvement in performance, comfort, functionality, and cost effectivity of healthcare diagnostic and monitoring systems.7 This technology is sensitive, rapid and can be made reusable. When coupled with electrochemical transducers, these sweat based sensors can be used for combinatorial detection of multiple biomarkers and can be miniaturized and mass-produced.8
| Description | Type of sensor | Biofluid | Limit of detection | Reference |
|---|---|---|---|---|
| Label-free photonic guided mode resonance (GMR) biosensor, operating in near-IR wavelengths | Optical | PBS at pH = 7.4 | Limit of detection of 0.1 pM with a detection range of 0.1–10 pM | 9 |
| Quartz substrate with a glass cover slip microfabricated with electrochemical working, counter, and reference electrodes | Electrochemical | Cerebrospinal fluid, sweat, saliva, and blood serum samples | Limit of detection of 4 pM | 10 |
| Single-walled carbon nanotube (SWCNT) – aptamer biosensor with a label-free multisensing platform | Electrochemical | Blood serum | Limit of detection of 500 pM with a detection range of 1 μM to 100 pM | 11 |
| Aptamer and gold nanoparticle (AuNP) colorimetric sensor | Colorimetric | Artificial sweat | Limit of detection of 110 nM with a detection range of 50–400 nM | 12 |
| Sensing platform based on aptamer-immobilized graphene-gold nanocomposite microelectrodes embossed on cyclic olefin copolymer | Electrochemical | Blood serum | Limit of detection of 10 pM with a detection range of 10–1000 pM | 13 |
| Gold microelectrode based wearable NPY detection and monitoring platform | Electrochemical | Sweat | Limit of detection of 10 pg mL−1 with a range 10–500 pg mL−1 | This work |
These can be used as a self-monitoring platform for tracking user well-being; however, there are some hurdles on the path to perform successful NPY detection. For example, the physiological range of NPY in sweat is 50–200 pg mL−1. This poses a challenge as the detection system needs to be robust enough to generate a signal for concentrations that are a magnitude lower than those in commercially used gold standard biofluids like blood or serum. In a wearable system, electrode flexibility is an imperative. A very interesting approach has been adopted by B. Gao et al., where they have created a highly stretchable and flexible artificial skin platform inspired by fish and reptile scales. This “Kirigami”, a subset of origami artwork, patterns paper to mimic microfluidic and electronic devices used to perform biomarker detection.14 There is usually a tradeoff between conformation to the user's body movement and being mechanically resilient so that the signal is not degraded by motion artifacts. In this work, we aim to address these issues with a novel, flexible sweat NPY detection platform.
This work highlights a sensor prototype for a non-faradaic electrochemical biosensor for the detection of NPY within human sweat. It offers the advantages of being cost-effective, non-invasive, label-free, rapid, and sensitive. By offering a comprehensive analysis of porous vs. non-porous membranes, this paper highlights the importance of substrate optimization while designing wearable sensing technologies. Binding studies using FTIR confirm the functionality of the capture probe used in this system. Evaluation of the performance of both systems i.e. non-porous and porous systems was carried out using Electrochemical Impedance Spectroscopy (EIS). By using this detection modality, detection becomes rapid and label free, which is ideal for a point of need diagnostic and self-monitoring device. An alternative technique, chronoamperometry, confirms the sensitivity of the sensing platform to various NPY concentrations. We also discuss the usability of the system as a benchtop device vs. a wearable using a novel portable device which utilizes the commercially available EmStat Pico from Palmsens. The specificity of the sensor in the presence of interferents in sweat is also confirmed. Thus, this convenient biosensor platform functions using ultralow volumes of sweat, an easily accessible analyte, and addresses the need for a self-monitoring device for quantification of stress.
2 Results and discussion
2.1 Sensor platform characterization
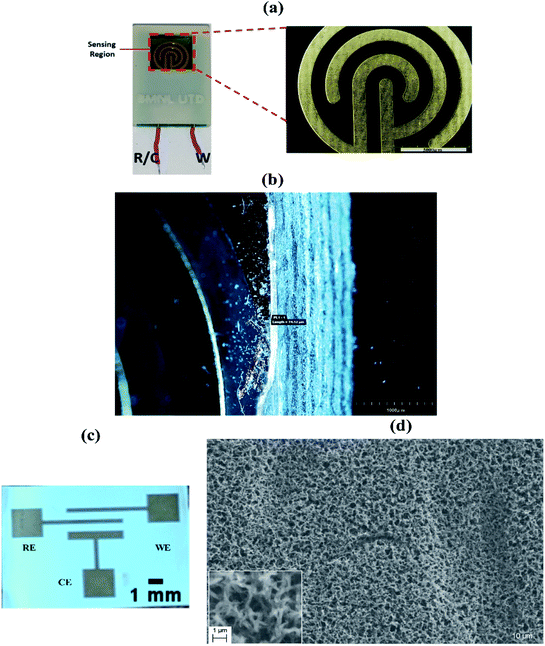
We have evaluated two types of sensing platforms for NPY detection one with a non-porous substrate and another with nano-porosity. We have leveraged our findings from the non-porous substrate and translated it to the nanoporous substrate which is more suitable for wearable bio sensing applications.![[thin space (1/6-em)]](https://www.rsc.org/images/entities/char_2009.gif) :
:![[thin space (1/6-em)]](https://www.rsc.org/images/entities/char_2009.gif) 10. The design of the gold electrodes microstructure provides a good anchoring platform for the immobilization of the self-assembled monolayer (SAM) for the detection of NPY in sweat. Also, this non-porous platform acts as optimal base substrate which helps in preliminary assay optimization studies. This is because non-porous platforms do not have the variability from variations in binding interactions created due to effective surface area coverage during fluid confinement inside the porous structure. Fig. 1a and b highlight the thickness of the gold electrodes that were used for electrochemical measurements. The SAM is formed on the biosensor illustrated by the schematic in Fig. 3c. The functionalization is described in detail in Section 2.2. In this work, we characterized and optimized the binding interactions between NPY and the immobilized detection probe using the non-porous substrate. After determining the sensing response and optimizing for the detection assay, the electrode substrate was switched to a porous platform to tune it towards a wearable application.
10. The design of the gold electrodes microstructure provides a good anchoring platform for the immobilization of the self-assembled monolayer (SAM) for the detection of NPY in sweat. Also, this non-porous platform acts as optimal base substrate which helps in preliminary assay optimization studies. This is because non-porous platforms do not have the variability from variations in binding interactions created due to effective surface area coverage during fluid confinement inside the porous structure. Fig. 1a and b highlight the thickness of the gold electrodes that were used for electrochemical measurements. The SAM is formed on the biosensor illustrated by the schematic in Fig. 3c. The functionalization is described in detail in Section 2.2. In this work, we characterized and optimized the binding interactions between NPY and the immobilized detection probe using the non-porous substrate. After determining the sensing response and optimizing for the detection assay, the electrode substrate was switched to a porous platform to tune it towards a wearable application.
2.2 Immunochemistry characterization
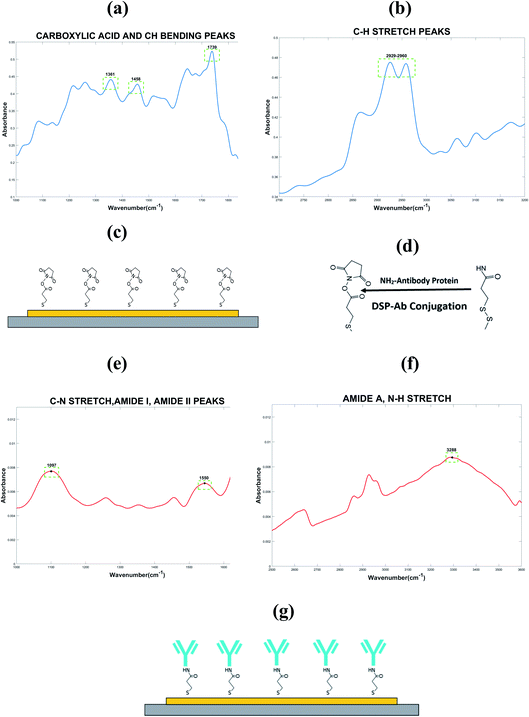
Validation of the formation of SAM on the biosensor electrode surface was done by Fourier-Transform Infrared Spectroscopy (FTIR). The spectrum for thiol linker, dithiobis-[succinimidyl propionate] (DSP) is depicted in Fig. 2a and b. FTIR was used to first validate the successful chemisorption of the cross-linker onto the gold electrode surface as illustrated in the schematic shown in Fig. 2c. It was also used to provide a binding site as a means of anchoring the NPY-antibody to the thiolated gold surface. This will act as the detection probe for this sensing platform as illustrated in the schematic shown in Fig. 2d and e. Table 2 presents the relevant IR spectra observed for the linker and antibody immobilized onto the gold electrode surface extracted from the FTIR spectrum graph shown in Fig. 2a, b and e, f respectively.| Description | Expected peak position (cm−1) | Observed peak position (cm−1) |
|---|---|---|
| Stretching of CH alkane chain | 2640–3000 | 2949 |
| Free carboxylic acid | 1743 | 1739 |
| CH2 bending | 1465 | 1458 |
| CH3 bending | 1375 | 1361 |
| Amide-I bond | 1600–1700 | 1657 |
| Amide-II bond | 1510–1580 | 1550 |
| C–N stretch | 1020–1250 | 1097 |
| Amide A, N–H stretch | 3225–3280 | 3288 |
The peak observed at 1739 cm−1 is a characteristic peak associated with the binding of DSP binding to gold, which indicates the presence of free carboxyl acid and the asymmetric stretching of the N-hydroxysuccinimide (NHS) ester. The peak observed at 2949 cm−1 is as a result of the stretching of the alkane chain present in DSP. Peaks also observed at 1458 cm−1 and 1361 cm−1 indicate the vibrations of methylene scissors in DSP and the symmetric stretching of C–N–C stretch of NHS. These observed peaks validate the formation of a SAM of DSP confirming the chemisorption of DSP to the gold surface. Upon the DSP–antibody, there is a visible reduction of the peak observed at 1739 cm−1 indicative of the breaking of the CO–NHS bond in the DSP to allow for the reaction with the primary amine groups of the antibody to form stable amide bonds. The peaks observed at 1657 cm−1 and 1550 cm−1 are indicative of the absorbance peaks associated with the formation of amide I and amide II bonds, respectively. The peak observed at 1097 cm−1 and 3288 cm−1 correspond to the C–N stretch and N–H stretch in the formation of the SAM capture probe on the gold electrode surface.23,24
2.3 Sensor performance in non-porous substrate
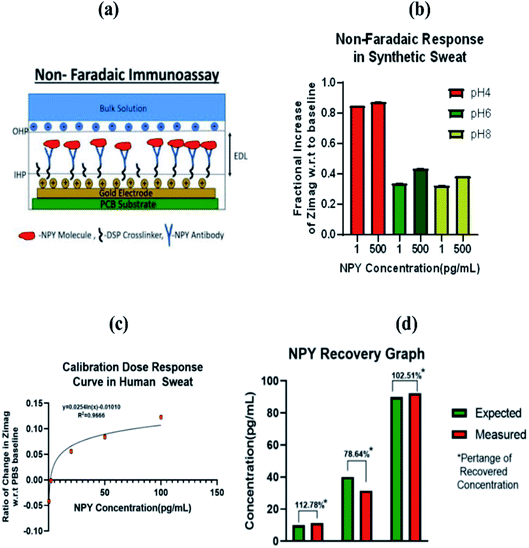
To validate the stability of the sensor response across the physiological pH of sweat, non-faradaic EIS, as explained above, was performed in synthetic sweat at pH 4, 6, and 8. Fig. 3b shows the results for the pH study on the rigid non-porous substrate. A detailed explanation behind the pH dependent response is further described in Section 2.4.3.
To test the efficacy of the CDR generated from our sensor, we performed a recovery experiment to see how well our CDR would be able to measure the concentration of sweat in pooled human sweat. We spiked pooled human sweat with NPY (10, 40 and 90 pg mL−1) and evaluated the immunoassay binding response on the sensor. Ratio off changes in Zimag were performed in the same way as in the development of the CDR. Based on change of Zimag calculated (y-axis), the x-axis concentrations of NPY was solved for from the fitting line equation of the CDR. Percentage recovered was calculated as
In analytical chemistry, recovery percentages between 70% to 120% of the expected value are deemed acceptable.30 The results of the recovery are shown in the graph in Fig. 3d. As clearly observed, the low, mid, and high doses fall in the desired percentage brackets as expected in recovery experiments. This clearly demonstrates the sensitivity of the sensor to build a robust CDR curve that can be used in the estimation of NPY concentrations in sweat. The Nyquist plot illustrated as Fig. S3.† The Nyquist plot shows the distribution of the Zimg component against the Zreal component of the impedance response. From the Nyquist, a dose dependent response can be observed. Using this plot, an equivalent electrochemical circuit fitting was performed to capture the binding response related modulations of the Randle's circuit elements. This electrochemical fitting of sensor response using a modified Randle's circuit is presented as Section S1.2.† From the fitting data, it can be observed that the response is driven by affinity binding, due to the dose dependant changes in the capacitive EDL component (modelled using a Constant Phase Element (CPE)) and Rct component. With the increase in concentration of NPY in the system, the overall capacitance of the EDL increases due to increased interaction between the capture probe and target molecule. Being a protein, NPY is insulative in nature and upon binding on the surface of the electrode, it creates additional resistance to the charge flow at the electrode–electrolyte interface. This is characterized by the sudden increase in Rct at higher dose concentrations of NPY (50–100 pg mL−1). Also, from the fitting data, it can be observed that the bulk solution resistance contributed by the bulk ions in human sweat does not significantly affect the response. Thus, the sensor response is directly correlated to the NPY binding events occurring at the capture probe/electrode–electrode interface.
The performance of the rigid non-porous substrate thus far is indicative of the use of our platform in the detection of NPY and the translatability to porous flexible substrates. Faradaic measurements were also taken on a non-porous substrate in the characterization of our immunoassay's response to NPY. The details and results are available in the ESI.†
2.4 Sensor performance in porous substrate
| Research | Target, buffer | Detection limit | Experimental | Reference |
|---|---|---|---|---|
| Disposable screen-printed amperometric biosensor utilizing monoclonal antibody as detection probe | Progesterone, phenol solution, cattle milk samples | 1 × 10⁻⁹ mol dm−3, 5 ng mL−1 | +0.70 V vs. saturated calomel (SCE) | 42 and 43 |
| Immunosensor development using polypyrrole-based layer for entrapping bovine leukemia virus (BLV) protein using antibodies | gp51 protein (BLV antigen), bovine serum | 10-Fold dilutions of serum, antigen–antibody complex driven response, concentrations not mentioned | 0 to 600 mV vs. Ag/AgCl, potential pulses of +950 mV vs. Ag/AgCl | 44 |
| Gold nanoparticle decorated polyaniline nanowire for covalent attachment of biorecognition elements – glucose oxidase enzyme (GOx), ssDNA, and lamin A antibody | Glucose, complementary DNA strand, and lamin A protein, phosphate buffer solution | 1 μM for glucose (chronoamperometric detection) | Operating potentials of −0.1 V and +0.8 mV | 45 |
| Cellular biosensor for detection of aflatoxin B1 (AFB1) using screen-printed electrodes (SPEs) and anti AFB1 antibody as biorecognition element, and engineered/plain monkey vero kidney cells | Aflatoxin B1 (AFB1)-mycotoxin, phosphate-buffered saline | 0.05 ng mL−1 (plain cells) and 1.5 ng mL−1 (vero-anti-AFB1 cells) | −100 mV potential | 46 |
| Chronoamperometric immunosensor using anti-TNF-α antibody functionalized on gold electrode using 4-carboxymethylaniline (CMA) | Tumor necrosis factor (TNF) – α artificial saliva, saliva | 1 pg mL−1 | 100 mV versus the saturated calomel reference electrode (SCE) | 47 |
2.5 Sensor specificity
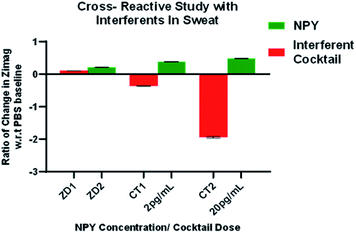
Detection of sweat-based protein biomarker at low concentrations via electrochemical modalities is challenging because of the highly ionic composition of sweat. Issues can arise due to non-specific binding from components like uric acid lactate, creatinine, and ascorbic acid, and glucose.49 A synthetic analogue representing the physiological concentrations of these interferent molecules was created. This formulation was used to characterize the non-specific response of the sensing platform. The response for NPY was compared with the dosing of interferent solution on the sensor interface. Fig. 5 illustrates the specific response for NPY and shows significant changes from baseline for NPY concentrations of 2 pg mL−1 and 20 pg mL−1. The non-specific response does not follow a specific trend and the results indicate a negative change in impedance, indicating that the presence of interferents does not affect the immunoassay and produce false positives. The response for specific NPY concentrations is significantly higher than the interferent buffer dosing with p < 0.05. The specificity of the response is triggered by the interfacial responses caused by anchoring of the protein on the surface of the electrode creating capacitive modulations. The testing scenario is presented for highest physiological conditions of interferents. However, in real wearable monitoring scenarios, the concentrations of interferents present would be at a lower level due to the resting, passive state of the user. These results conclude that the sensor response is specific for NPY and is suitable for monitoring in a wearable form factor via sweat.2.6 Portable sensor electronics interface
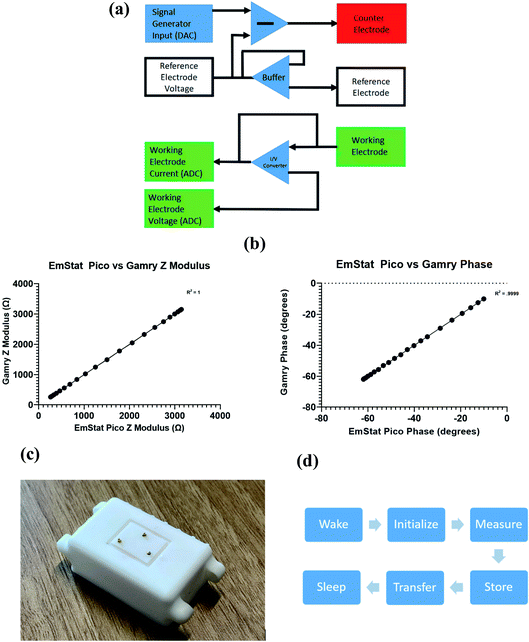
As a wearable, a device of this nature needs to provide actionable, useful information to the end user. After collection, data sets must be analysed and categorized. One can use a simple thresholding system or a more complex classification system to categorize the data. In the case of our device, we would use the change in impedance or the change in the chronoamperometric peaks to classify the sample into a low, medium, or high concentration. With respect to impedance spectroscopy, the simplest way to do this would be to pick a specific operating frequency where the highest sensitivity is seen in the original dose responses. A gradient would then be established, and thresholds could be defined. Because there is some sensor to sensor and dosing variability, the baseline must be recorded and the percent change in impedance should be the metric used to classify the data. The same concept can be employed for chronoamperometric peaks currents. This method of classification makes the user experience straightforward. The final aim of this work is to run human subject studies in order to have a better understanding of sweat concentrations before and after specific stimulation events. This would involve either wearing one of the porous sensors to later be tested on a benchtop form factor device, wearing the device with the porous sensor attached for live measurements, or using pooled human sweat with a rigid electrode system.Two alternative electronics form factors were designed to suit the final application of this work. These would also help validate the findings through the standard benchtop electrochemical instrumentation such as a Gamry potentiostat. We opted to use the EmStat Pico, which is a small form factor potentiostat. This features the ADuCM355 microcontroller with an onboard potentiostat. The process flow is illustrated in Fig. 6a. This device would then be paired with our rigid substrate electrode system and the porous electrode system to provide human sweat results. This system was designed to avoid significant physical stimulation so that we could have a better understanding of resting neuropeptide-Y concentrations.
The benchtop form factor requires the implementation of the UMFT234XD USB FTDI adaptor. This effectively turns the EmStat Pico into a thumb drive size device capable of taking measurements. Neuropeptide-Y has a very low charge at physiological pH; hence, the impedance, phase, and current changes will be quite small and require high resolution hardware. To assess the benchtop configuration's stability and accuracy, a controlled sweep from 10 to 1000 Hz on both the benchtop form factor and the Gamry potentiostat was performed. From Fig. 6b, a strong correlation between the two data sets (p > 0.99) was observed. This confirmed that the device would be viable for validation and further testing. It also ensures that the operating frequencies of our EIS scans will be stable.
The mobilized form factor would involve the addition of a voltage regulator and a 5 volt battery to power the system. A bluetooth module would also need to be added to the design so that this form factor could pair with the PSTouch Android software provided with the EmStat Pico. We would then use a gold plated pogo-pin system to interface with the porous substrate-based electrode system. An image of this interface can be found in Fig. 6c.
The core limitations of this design are artifact generation and battery life. The major artifacts generated are from human motion, such as walking. The built in Hann window on the ADuCM355 suppresses the noise from external artifacts by creating a strict high and low pass system on either side of the chosen operating frequency. As for battery life, we would employ a state machine to limit the microcontroller's on time by utilizing its sleep function. Additionally, data can be stored on the microcontroller's onboard flash memory and sent in bulk to limit the bluetooth module's on time. The general process flow of such state machine can be seen in Fig. 6d.
3 Experimental
3.1 Reagents and materials
NPY antibody and protein were purchased from Abcam (Cambridge, MA, USA). The thiol linker, DSP (Dithiobis-[Succinimidyl Propionate]) was procured from Sigma-Aldrich (St. Louis, MO, USA). The solvent, DMSO (Dimethyl Sulfoxide) and PBS (Phosphate Buffered Saline) were obtained from Thermofisher Scientific Inc. (Waltham, MA, USA). Sweat analogue used were prepared according to the protocol described in previous publication.35 Milipore DI water was employed for making dilutions and buffers. Pooled human sweat was purchased from Lee Biosolutions Inc. (St. Louis, MO, USA).3.2 Fabrication of sensing platforms
Non-porous electrode substrates were procured from PCB Universe Inc (Vancouver, WA, USA). Porous gold sensors were fabricated on flexible nanoporous polyamide substrate (GE Healthcare Life sciences (Piscataway, NJ, USA)) using a shadow mask technique. Gold was deposited using thin film deposition using a Temescal E-beam evaporator available in the cleanroom facility provided by the University of Texas at Dallas. The functionalization protocol is described in previous literature.50 Here the NPY antibody concentration used was 10 μg mL−1.3.3 Experimental design for FTIR
FTIR spectrum was captured using Thermo Scientific Nicolet iS50 FTIR in Attenuated Total Reflectance (ATR) mode. The instrument consists of a germanium ATR crystal, deuterated triglycine sulfate (DTGS) detector and a KBr window. Samples for analysis were prepped on a glass substrate with washing and drying steps in between immobilizations to remove physisorbed molecules. The spectrum was recorded between 800 cm−1 and 4000 cm−1 with a resolution of 0.5 cm−1 and 256 scans.3.4 Experimental design for electrochemical impedance spectroscopy
Following functionalization, synthetic sweat (5 μL) spiked with NPY concentrations was dispensed onto the sensor surface. An AC potential bias of 10 mV was applied to the sensor and impedance spectra was recorded for the Nyquist frequency range (1 Hz to 1 MHz). This Calibrated Dose Response (CDR) study was performed using Gamry Reference 600 potentiostat (Gamry Instruments, PA, USA). All the impedance data is extracted at 100 Hz, where peak capacitive behaviour of sensing system was observed.3.5 Experimental design for chronoamperometry measurements
For chronoamperometry measurements, a similar CDR protocol was used. DC step potential of 600 mV was applied to the electrode and current spectra was recorded for the period of 60 seconds. This was also performed using Gamry Reference 600 potentiostat (Gamry Instruments, PA, USA). The current peaks were extracted, and post analysis was performed using Echem Analyst™ software.3.6 Experimental details for portable electronics
EmStat Pico, a small form factor potentiostat, was created by PalmSens and Analog Devices. This features the ADuCM355 microcontroller with an onboard potentiostat. Electrodes fabricated from Section 3, were paired with this system to collect sweat and perform detection. Different revisions of portable device design, one benchtop and one wearable, with a 3D printed design was created using the Formlabs Form 2 3D printer.3.7 Statistics
Data is represented and plotted as mean ± SEM with N = 3. The sensor–sensor variability is under 20% which is CLSI guidelines compliant.51 Significance study between the groups was carried out using ANOVA followed by post-hoc Tukey test. For the significance study, which was carried out withing two groups, an unpaired two tailed T-test was performed. All the statistical studies, along with the correlation ad regression analysis presented in this work were performed using the statistical software Graph Pad Prism v8.01. (Graph Pad Software Inc., La Jolla, CA, USA).4 Conclusions
The work demonstrates the development of a wearable chronic disease management platform for MDD and anxiety disorders. In this work, comparison of electrochemical detection response between non-porous and porous substrates for optimal sensing performance. Detailed electrochemical analysis of sensor performance using various detection techniques like faradaic, non-faradaic EIS and chronoamperometry is provided. Electrochemical fitting of sensor response using modified Randle's equivalent circuit highlighted the dose dependent capacitive sensor response of the system. Detection limit of the sensing system is 10 pg mL−1 and dynamic range of operation is 10–500 pg mL−1. The sensor response is conserved in presence of pH fluctuations. Non-specific binding study using interferents indicates that sensor is specific to NPY molecule. Finally, novel portable electronic system highlights the wearable aspect of the device and provides insight into further application. Overall, this novel wearable NPY biomarker tracking system is envisioned to be a chronic anxiety and MDD management platform via self-monitoring.Author contributions
Data collection, analysis, writing: NC, SU, PR, SB; conceptualization, writing, analysis, reviewing: SP.Conflicts of interest
Dr Shalini Prasad has a significant interest in Enlisense LLC, a company that may have a commercial interest in the results of this research and technology. The potential individual conflict of interest has been reviewed and managed by The University of Texas at Dallas and played no role in the study design; in the collection, analysis, and interpretation of data; in the writing of the report, or in the decision to submit the report for publication.Acknowledgements
The authors would like to thank Ambalika Tanak for helping with the FTIR and SEM measurements. Also, Amulya Srivatsa and Kevin Thai for helping with some of the EIS measurements.References
- W. H. Organization, Disease burden and mortality estimates: cause-specific mortality, Geneva, Switzerland, 2000–2016 Search PubMed.
- N. I. of M. H. (NIHM), Transforming the understanding and treatment of mental illnesses, https://www.nimh.nih.gov/health/statistics/major-depression.shtml Search PubMed.
- A. Balasubramaniam, I. Grupp, L. Srivastava, K. Tatemoto, R. F. Murphy, S. N. Joffe and J. E. Fischer, Int. J. Pept. Protein Res., 1987, 29, 78–83 CrossRef CAS PubMed.
- K. Tatemoto, Proc. Natl. Acad. Sci. U. S. A., 1982, 79, 5485–5489 CrossRef CAS PubMed.
- L. Sousa-Ferreira, M. Garrido, I. Nascimento-Ferreira, C. Nobrega, A. Santos-Carvalho, A. R. Álvaro, J. Rosmaninho-Salgado, M. Kaster, S. Kügler and L. P. De Almeida, PLoS One, 2011, 6(7), e22333 CrossRef CAS PubMed.
- X. Xiao, Z. Kuang, W. J. Burke, Y. Chushak, B. L. Farmer, P. A. Mirau, R. R. Naik and C. K. Hall, J. Phys. Chem. B, 2020, 124(1), 61–68 CrossRef CAS PubMed.
- R. Fan and T. L. Andrew, J. Electrochem. Soc., 2020, 167, 37542 CrossRef CAS.
- N. J. Ronkainen, H. B. Halsall and W. R. Heineman, Chem. Soc. Rev., 2010, 39, 1747–1763 RSC.
- M. G. Abdallah, J. A. Buchanan-vega, K. J. Lee, B. R. Wenner, W. Allen, M. S. Allen, S. Gimlin, D. W. Weidanz and R. Magnusson, Sensors, 2020, 126 Search PubMed.
- C.-F. Chou, B. J. Sanghavi, W. Varhue, J. L. Chávez and N. S. Swami, Anal. Chem., 2014, 86(9), 4120–4125 CrossRef PubMed.
- M. Palma, X. Xu, P. Clément, J. Eklöf-Österberg, N. Kelley-Loughnane, K. Moth-Poulsen and J. L. Chávez, Nano Lett., 2018, 18, 4130–4135 CrossRef PubMed.
- J. Chavez, K. Rieger, J. A. Hagen and N. Kelley-Loughnane, in Smart Biomedical and Physiological Sensor Technology XVI, SPIE, 2019, p. 14 Search PubMed.
- R. E. Fernandez, B. J. Sanghavi, V. Farmehini, J. L. Chávez, J. Hagen, N. Kelley-loughnane, C. Chou and N. S. Swami, Electrochem. Commun., 2016, 72, 144–147 CrossRef CAS.
- B. Gao, A. Elbaz, Z. He, Z. Xie, H. Xu, S. Liu, E. Su, H. Liu and Z. Gu, Adv. Mater. Technol., 2018, 3, 1700308 CrossRef.
- N. R. Shanmugam, A. P. Selvam, T. W. Barrett, S. C. Kazmierczak, M. N. Rana and S. Prasad, Portable nanoporous electrical biosensor for ultrasensitive detection of Troponin-T, Future Sci. OA, 2015, 1(3) DOI:10.4155/fso.15.22.
- D. P. Rose, M. E. Ratterman, D. K. Griffin, L. Hou, N. Kelley-Loughnane, R. R. Naik, J. A. Hagen, I. Papautsky and J. C. Heikenfeld, IEEE Trans. Biomed. Eng., 2015, 62, 1457–1465 Search PubMed.
- W. He, C. Wang, H. Wang, M. Jian, W. Lu, X. Liang, X. Zhang, F. Yang and Y. Zhang, Sci. Adv., 2019, 5, eaax0649 CrossRef.
- D. Kinnamon, R. Ghanta, K.-C. Lin, S. Muthukumar and S. Prasad, Sci. Rep., 2017, 7, 13312 CrossRef PubMed.
- R. D. Munje, S. Muthukumar, B. Jagannath and S. Prasad, A new paradigm in sweat based wearable diagnostics biosensors using Room Temperature Ionic Liquids (RTILs), Sci. Rep., 2017, 7, 1950 CrossRef PubMed.
- H.-X. Zhou, G. Rivas and A. P. Minton, Annu. Rev. Biophys., 2008, 37, 375–397 CrossRef CAS PubMed.
- R. D. Munje, S. Muthukumar, A. Panneer Selvam and S. Prasad, Sci. Rep., 2015, 5, 14586 CrossRef CAS PubMed.
- J. H. Bae, J.-H. Han and T. D. Chung, Phys. Chem. Chem. Phys., 2012, 14, 448–463 RSC.
- W. Gallagher, Course Manual Chem, 2009, 455 Search PubMed.
- K.-C. Lin, B. Jagannath, S. Muthukumar and S. Prasad, Analyst, 2017, 142, 2770–2780 RSC.
- D. C. Grahame, Chem. Rev., 1947, 41, 441–501 CrossRef CAS PubMed.
- A. J. Bard, L. R. Faulkner, J. Leddy and C. G. Zoski, Electrochemical methods: fundamentals and applications, Wiley, New York, 1980, vol. 2 Search PubMed.
- T. Ohhashi, M. Sakaguchi and T. Tsuda, Physiol. Meas., 1998, 19, 449–461 CrossRef CAS PubMed.
- K. Sato, W. H. Kang, K. Saga and K. T. Sato, J. Am. Acad. Dermatol., 1989, 20, 537–563 CrossRef CAS.
- G. Cizza, A. H. Marques, F. Eskandari, I. C. Christie, S. Torvik, M. N. Silverman, T. M. Phillips, E. M. Sternberg and P. S. Group, Biol. Psychiatry, 2008, 64, 907–911 CrossRef CAS.
- N. Belmonte Valles, M. Retamal, M. Mezcua and A. R. Fernández-Alba, J. Chromatogr. A, 2012, 1264, 110–116 CrossRef CAS PubMed.
- K.-C. Lin, V. Kunduru, M. Bothara, K. Rege, S. Prasad and B. L. Ramakrishna, Biosens. Bioelectron., 2010, 25, 2336–2342 CrossRef CAS.
- A. Bhide, S. Muthukumar, A. Saini and S. Prasad, Sci. Rep., 2018, 8, 6507 CrossRef PubMed.
- I. O. O. K'Owino and O. A. A. Sadik, Electroanalysis, 2005, 17, 2101–2113 CrossRef.
- M. Dyck and M. Lösche, J. Phys. Chem. B, 2006, 110, 22143–22151 CrossRef CAS PubMed.
- S. Upasham, K. Thai, R. Muthyala and S. Prasad, Analyst, 2020, 145, 784–796 RSC.
- J. S. Daniels and N. Pourmand, Electroanalysis, 2007, 19, 1239–1257 CrossRef CAS PubMed.
- L. Thomas, H. A. Scheidt, A. Bettio, A. G. Beck-Sickinger, D. Huster and O. Zschörnig, Eur. Biophys. J., 2009, 38, 663–677 CrossRef CAS PubMed.
- M. J. Patterson, S. D. R. Galloway and M. A. Nimmo, Exp. Physiol., 2000, 85, 869–875 CrossRef CAS PubMed.
- K. Ensing, T. de Boer, N. Schreuder and R. A. de Zeeuw, J. Chromatogr. B: Biomed. Sci. Appl., 1999, 727, 53–61 CrossRef CAS.
- J. L. Krstenansky and S. H. Buck, Neuropeptides, 1987, 10, 77–85 CrossRef CAS PubMed.
- S. P. Adiga, C. Jin, L. A. Curtiss, N. A. Monteiro-Riviere and R. J. Narayan, Wiley Interdiscip. Rev.: Nanomed. Nanobiotechnol., 2009, 1, 568–581 CAS.
- J. P. Hart, R. M. Pemberton, R. Luxton and R. Wedge, Biosens. Bioelectron., 1997, 12, 1113–1121 CrossRef CAS PubMed.
- R. M. Pemberton, J. P. Hart and J. A. Foulkes, Electrochim. Acta, 1998, 43, 3567–3574 CrossRef CAS.
- A. Ramanavicius, Y. Oztekin and A. Ramanaviciene, Sens. Actuators, B, 2014, 197, 237–243 CrossRef CAS.
- A. D. Chowdhury, R. Gangopadhyay and A. De, Sens. Actuators, B, 2014, 190, 348–356 CrossRef CAS.
- S. Mavrikou, E. Flampouri, D. Iconomou and S. Kintzios, Food Control, 2017, 73, 64–70 CrossRef CAS.
- L. Barhoumi, A. Baraket, F. G. Bellagambi, G. S. Karanasiou, M. Ben Ali, D. I. Fotiadis, J. Bausells, N. Zine, M. Sigaud and A. Errachid, Sens. Actuators, B, 2018, 266, 477–484 CrossRef CAS.
- F. Crespi, D. Dalessandro, V. Annovazzi-Lodi, C. Heidbreder and M. Norgia, J. Neurosci. Methods, 2004, 140, 153–161 CrossRef CAS PubMed.
- S. Upasham, A. Tanak, B. Jagannath and S. Prasad, Sci. Rep., 2018, 8, 16745 CrossRef PubMed.
- S. Upasham, S. Bhadsavle and S. Prasad, Anal. Methods, 2019, 11, 1229–1236 RSC.
- M. Moretti, D. Sisti, M. B. Rocchi and E. Delprete, Clin. Chim. Acta, 2011, 412, 1143–1145 CrossRef CAS PubMed.
Footnotes |
| † Electronic supplementary information (ESI) available. See DOI: 10.1039/d0ra03729j |
| ‡ Equal contribution. |
| This journal is © The Royal Society of Chemistry 2020 |

