 Open Access Article
Fluorescence detection of fluorine ions in biological fluids based on aggregation-induced emission
Yanming Miao *,
Wenli Yang and
Jinzhi Lv
Shanxi Normal University, Linfen 041004, PR China. E-mail: mym8207@126.com; Fax: +86-357-2051243; Tel: +86-357-2051249
First published on 30th July 2020
Abstract
Traditional chemical and biological sensors developed through aggregation-induced emission (AIE) are mainly based on “Turning on” pattern of fluorescence enhancement, which often has poor selectivity and can be easily interfered with by other substances. On this basis, an AIE-based tetraphenyl ethylene (TPE) derivative (TPE-COOH) was prepared in this study and aggregated by adding Al3+, so as to form the TPE-COOH/Al3+ polymer. TPE-COOH fluorescence was enhanced through AIE principle, thus realizing the “Turning on” state. F− could bind to Al3+ after the addition of F− ions which would result in the decomposition of TPE-COOH/Al3+ aggregate, dissolved state of TPE-COOH and gradual reduction of fluorescence intensity of the system, thus realizing “Turning off” state. Moreover, F− ions in biological fluid were analyzed and detected through such AIE-based “Turning on-off” pattern. The linear range of this method for F− detection was 3–12 μM and the detection limit was 0.9 μM.
1. Introduction
Fluorescent anion sensors have important applications in various fields such as food safety, biological monitoring, environmental detection and biomedicine. As the smallest anion, F is an essential microelement for human beings and animals, which can enter into the human body via food, water or air. Intaking an appropriate amount of fluorine has a certain effect on preventing dental caries. However, excessive ingestion of fluorine can give rise to tooth and skeletal fluorosis, influence many cell signals and normal cell metabolism, and result in problems like neural and metabolic disorder, malignant tumors, low intelligence quotient and cancers.1,2 Therefore, the detection of fluorine ions in food, water and body fluid, which is directly related to human health, has attracted much attention. The traditional fluorine ion sensor techniques include ionic chromatography,3,4 flight mass spectrometry,5 electrochemical process,6 high-performance liquid chromatography7 and fluorescence method,8 and the last one is the most convenient and efficiency, which has become an important detection means. However, most reported F− fluorescence sensors can detect ions in tetrabutylammonium fluoride (TBAF) only in organic solvents or aqueous solutions with surfactants. Only a minority of fluorescence sensors can detect inorganic F− ions in aqueous solution or biological system without surfactant, possibly because F− ions are characterized by small size, high electronegativity and high hydration enthalpy. Therefore, constructing a fluorescence sensor to detect inorganic F− ions in aqueous solution or biological environment is still a very challenging problem.9 In addition, most fluorescent molecules can be easily quenched under aggregation state, namely the fluorescence of fluorescent molecules is quenched under high concentration or solid state due to the delocalization state and formation of excimers.10,11 Because of the small dose of fluorescent molecules, the generated fluorescence signal is weak when these fluorescent molecules are used to analyze low-concentration samples (e.g. biological samples). Elevating the concentration of fluorescent molecules will give rise to the aggregation and quenching, thus influencing the sensitivity of target detection. Therefore, to design fluorescent molecules that can enhance the aggregation-induced fluorescence will be of great application value of target analysis and detection in biological samples etc.12–21In recent years, aggregation-induced emission (AIE) materials have attracted high attention from researchers.13,15,19,22–29 No matter AIE materials emit weak fluorescence or don't emit fluorescent under dissolved state, the fluorescence will be obviously enhanced under aggregation state.16,23,24,28,30 AIE phenomenon has been applied to various fields, e.g. analytical chemistry, biosensor, bioimaging, including ions,19,26,31–33 DNAs,17,34 proteins20,35 and cancer cells.36–38
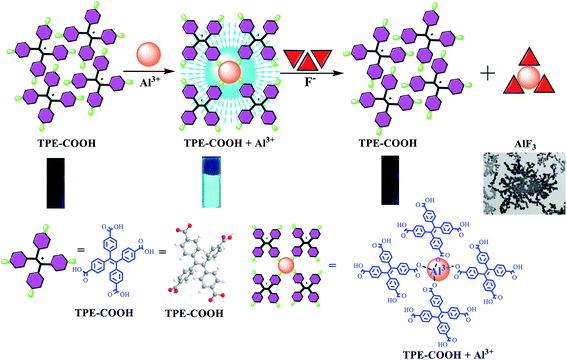
Traditional chemical and biological sensors were mainly developed by AIE based on “Turning on” pattern,5,18,19,27,28,37,39–45 namely the fluorescence of AIE materials would be enhanced when encountering the detection target, but there was no intermediate recognizer under this pattern, and it was easily interfered by other substances, thus causing poor selectivity. An AIE-based tetraphenyl ethylene (TPE) derivative (TPE-COOH) sensor was synthesized in this paper, and the analysis and detection of fluorine ions in biological fluid were realized through the “Turning on-off” pattern. As shown in Fig. 1, TPE-COOH was a TPE derivative containing 4-COOHs, which can enhance the dissolvability of TPE-COOH in Tris–HCl buffer solution, so TPE-COOH presents dissolved state in Tris–HCl buffer solution (pH 5.0) with very weak fluorescence. After Al3+ was added, TPE-COOH bound to Al3+, causing TPE-COOH aggregation, AIE and fluorescence enhancement of the system. After F− ions were added into the TPE-COOH/Al3+ system, F− could bind to Al3+ to generate AlF3 precipitation, giving rise to the decomposition of TPE-COOH/Al3+ polymer and the reduction of fluorescence intensity of TPE-COOH/Al3+ system. Therefore, an AIE-based fluorescence sensor of F− ions was constructed and applied to F− detection in body fluid.
2. Experimental part
2.1 Materials and reagents
4-Cyanophenylethylene was purchased from Changchun Sanbang Medical Technology Co., Ltd; ethylene glycol, KOH and Na2SO4 were from Fuchen (Tianjin) Chemical Reagents Co., Ltd; dichloromethane (DCM) was from Tianjin Shengdida Trading Co., Ltd; hydrochloric acid was from Huanghua Century Kebo Technology Development Co., Ltd; Al(NO3)3 was from Tianjin Guangfu Institute of Fine Chemical Engineering; NaF, NaCl, KBr, NaI, NaNO3 and Na2CO3 were from Tianjin Kermel Chemical Reagents Co., Ltd and sodium acetate was from Tianjin No.3 Chemical Reagent Plant. All reagents were analytically pure, and the ultrapure water (18.2 MΩ cm) was prepared using the WaterPro ultrapure water system (Labconco, US).2.2 Instruments
The morphological structure of AlF3 was characterized on field emission transmission electron microscope (FEI Tecnai G2 F20 S-Twin Energy Dispersive Spectrometer: Oxford Aztec X-Max 80). The fluorescence was determined using Cary Eclipse fluorescence spectrophotometer (Varian, US). pH value was determined using a pH meter (Shanghai Leici, China). UV/vis absorption spectra were determined via UV-29100 UV/vis (Shimadzu, Japan) UV-vis spectrophotometer. The magnetic stirring was performed on constant-temperature magnetic stirring apparatus (Shanghai Sile Instrument Co., Ltd). The fluorescence lifetime was tested by FLS 980 series of fluorescence spectrometers (Edinburgh Company, UK). The excitation wavelength was 340 nm, double exponential fitting was used and the service life was calculated by following formula:2.3 Synthesis of TPE-COOH
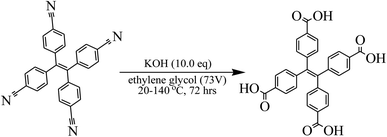
300 mg of 4-cyanophenyl ethylene (694 μmol) and 22.0 mL of ethylene glycol were added into a 100 mL three-mouth flask at 20 °C, followed by stirring until substrate dissolution. Then 401 mg of KOH (7.14 mmol) was added one time, and the nitrogen displacement was implemented. The mixture was stirred for 72 h after the reaction and heating until 140 °C (Fig. 2). LCMS (ET18435-77-P1B, product RT = 0.191 min) detected MS in the reaction product and TLC (petroleum ether/ethyl acetate = 3/1, starting material Rf = 0.3) monitored that 4-cyanophenyl ethylene was completely reacted. The reaction system was then cooled to 20 °C, and three parallel reactions were treated in batches. The combined reaction fluid was poured into 20.0 mL of ice water. Then the aqueous phase was extracted by DCM (10.0 mL × 2). After that, DCM phases were combined together. The pH value of aqueous phase was regulated to 1.0, followed by filtration, and solids were collected together. Finally, the solid mixture was concentrated and swabbed off. 1.01 g of yellow solid was obtained, and then 1H NMR detection (ET28840-2-P1A1 400 MHz CDCl3) was performed.2.4 Al3+ determination method
To investigate the influence of Al3+ on fluorescence intensity of TPE-COOH, 500 μL of 0.1 M Tris–HCl buffer solution (pH 5.0) was firstly added, followed by 500 μL (10 μM) of TPE-COOH and Al3+ solutions with different concentrations (1.0 mM).The constant volume was made as 5 mL, and the fluorescence was detected after shaking the mixture for 40 min with an excitation wavelength of 340 nm.2.5 F− determination method
In order to study the influence of F− on florescence intensity of TPE-COOH/Al3+, 500 μL of 0.1 M Tris–HCl buffer solution (pH 5.0) was firstly added, followed by 500 μL (10 μM) of TPE-COOH, 40 μL (1.0 mM) of Al3+ solution and F− solutions (1.0 mM) with different solutions. The constant volume was made as 5 mL, and the fluorescence was detected after shaking the mixture for 50 min with anexcitation wavelength of 340 nm.2.6 Determination of actual samples
Urine samples were provided by the authors of this study (Informed consent was obtained from all human subjects). As urine contained fluorescent molecules like proteins with high liquid turbidity, the pretreatment process was essential. First of all, the urine sample was centrifuged at the speed of 12![[thin space (1/6-em)]](https://www.rsc.org/images/entities/char_2009.gif) 000 rpm for 15 min to remove proteins, and subsequently, impurities were also removed using 0.22 μm filtering membrane and the sample was preserved in refrigerator at 4 °C.
000 rpm for 15 min to remove proteins, and subsequently, impurities were also removed using 0.22 μm filtering membrane and the sample was preserved in refrigerator at 4 °C.
In the determination process, 500 μL of 0.1 M Tris–HCl buffer solution (pH 5.0) was firstly added into a colorimetric tube, followed by 500 μL (10 μM) of TPE-COOH and 40 μL of Al3+ solution (1.0 mM), then 50 μL of urine after labeling was taken and added into the above solution, and the final scalar quantities in the system were 3 μM, 7 μM and 9 μM, respectively. The sample detection steps were the same as 2.5, and the experiment was repeated for three times.
2.7 Calculation TPE-COOH and Al3+ interaction
All calculations were implemented through the hybrid density function B3LYP in density functional theory (DFT) by using Gaussian 09 program package.46,47 The basis set used in the calculation was 6-31+G (dp), followed by comprehensive natural bond orbital (POP = NBO) of the molecules. Frequency calculation and optimization were carried out at the same level to ensure that geometrical structures given here were local minimum values, where the frequency of obtaining stable structures was positive. After the completion of each step, the existence of imaginary frequency in any stable structure was further confirmed with full consideration of zero-point energy (ZPE) correction. In the end, the energy E-ZPE (energy containing zero-point energy (ZPE)) of stable structure was obtained.Binding energy was calculated at 298.15 K (ΔE) using the following formula:
| ΔE = E(TPE-COOH)+(Al) − E(TPE-COOH) − E(Al) |
3. Results and analysis
3.1 TPE-COOH preparation and reaction with Al3+
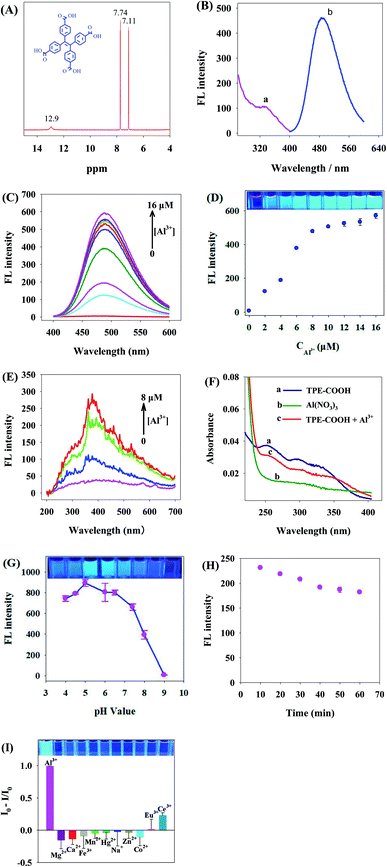
Based on 1H NMR detection, TPE-COOH (12.9 (s, 3H), 7.74 (d, J = 8.4 Hz, 8H), 7.11 (d, J = 8.4 Hz, 8H)) (Fig. 3A) was synthesized in this study. The peak value of TPE-COOH excitation spectra and emission spectra was 340 nm and t 480 nm, respectively (Fig. 3B).Fig. 3C is the spectrogram reflecting the change of TPE-COOH fluorescence intensity with the increase of Al3+ concentration. As the Al3+ concentration increased, TPE-COOH strength was gradually enhanced at 480 nm. Under Al3+ concentration of 8 μM, the change of fluorescence intensity of TPE-COOH gradually tended to be steady, and it was no longer 78 times of that without addition of Al3+ (Fig. 3D), indicating that Al3+ had obvious enhancing effect on the fluorescence of TPE-COOH.
If two substances can be aggregated and generate scattering particles through interaction, they will generate obvious resonance light scattering (RLS) signal. The RLS change spectra of Al3+–TPC-COOH interaction manifested that, with the addition of Al3+, the RLS intensity of Al3+ and TPE-COOH system was gradually enhanced, indicating that larger particles were formed in the system, namely the two experienced evident aggregation (Fig. 3E).
Fig. 3F shows UV spectra of TPE-COOH (curve a), Al3+ (curve b) and TPE-COOH + Al3+ (curve c). After Al3+ was added, red shift appeared in UV spectra of TPE-COOH, indicating that Al3+ interacted with TPE-COOH.
pH is an important factor influencing the fluorescence property of TPE-COOH/Al3+. It could be known from Fig. 3G that, as the pH value increased, the fluorescence intensity of TPE-COOH/Al3+ was firstly enhanced and then reduced. When pH value was 5.0, the fluorescence intensity of TPE-COOH/Al3+ was the strongest, so pH 5.0 was taken as the optimal pH value of this system. The fluorescence intensity of TPE-COOH/Al3+ was kept relatively stable 40 min later (Fig. 3H).
In order to further verify the selective binding ability of Al3+ and TPE-COOH, the effect of other metal ions on the fluorescence of TPE-COOH was also researched in this paper (Fig. 3I), and the results showed that, at the same concentration (8 μM), Mg2+, Ca2+, Fe3+, Mn2+, Hg2+, Na+, Zn2+, Co2+, Eu3+ and Ce3+ had relatively little effect on the fluorescence of TPE-COOH compared with Al3+, indicating that the combination of TPE-COOH and Al3+ has a relatively strong specificity.
The above results indicated that, the basically stable fluorescence of TPE-COOH/Al3+ system could be formed under pH 5.0 after reacting for 40 min.
3.2 TPE-COOH/Al3+ AIE mechanism
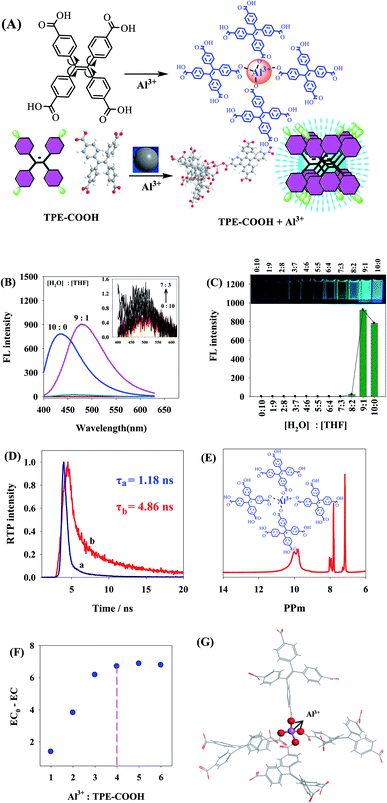
Intramolecular motions mainly include molecular rotation and vibration, corresponding to molecular spectral properties, which can be used to study molecular spectra and speculate intramolecular motion status. On the contrary, the goal of regulating molecular spectra can be reached by controlling intramolecular motions. TPE in TPE-COOH is a simple and typical AIE molecule, with four phenyls connected through C–C single bond and realized the luminescence around double ethylene bonds. While TPE is a simple and typical AIE molecule, with four phenyls connected through C–C single bond and encircle ethylene double bonds, each phenyl can be regarded as a rotor and double bonds in the center are equivalent to fixed stators. After TPE molecules were dissolved in dilute solution, its four phenyls can make free rotational motion around double bonds. When excited by light, the excited-state energy was rapidly consumed and lost, then the excited state of molecules was attenuated to ground state by means of nonradiative jump, and the system fluorescence was weakened or disappeared. When TPE molecules were under aggregation state, due to the reduction of intermolecular distance and packing of adjacent molecules, the phenyl rotation was effectively inhibited, and the energy absorbed by molecules could not be absorbed through the rotation of benzene ring on ethylene, reducing the energy attenuated in way of nonradiative jump by a large margin. However, the energy on ethylene would gradually increase, tending to conjugate on the whole, thus resulting in the fluorescence enhancement of compound. In the meantime, TPE molecules would not generate π–π packing because of their propeller-like structure, so a strong fluorescence was displayed under aggregation state, certifying that spectral properties of AIE molecules with propeller structure were mainly decided by the internal rotation of molecules.16,48–51 –COOH on TPE-COOH can not only enhance the dissolvability of TPE-COOH in Tris–HCl buffer solution, but also form TPE-COOH/Al3+ chelate with Al3+ as it is distributed with –COOHs on the surface, further causing TPE-COOH aggregation. Thus, phenyls in TPE-COOH were effectively inhibited, the nonradiative energy loss was reduced by a large margin, and the light was emitted by TPE-COOH because of the aggregation (Fig. 4A).To further prove that TPE-COOH can be aggregated to emit light, TPE-COOH was dissolved in H2O/THF mixed solutions with different matching ratios. As TPE-COOH was of poor dissolvability in pure water but dissolvable in THF, as the proportion of H2O/THF was increased, and TPE-COOH was gradually aggregated as it became more and more difficult to dissolve, accompanied by the enhancement of fluorescence intensity (Fig. 4B and C), indicating that the fluorescence of TPE-COOH was enhanced by the aggregation of TPE-COOH.
Studying the change of fluorescence lifetime is an effective path of exploring the fluorescence decay process. Fig. 4D shows the fluorescence lifetime before (a) and after (b) addition of Al3+ into TPE-COOH, where the fluorescence lifetime before and after this was 1.18 ns and 4.86 ns, respectively. After the aggregation of TPE-COOH, the fluorescence lifetime was lengthened by 4.1 times. When TPE-COOH was under the dissolved state in dilute solution, phenyls on TPE-COOH could do free rotational motion, the energy under the excited sate was rapidly lost in a nonradioactive way, and the fluorescence lifetime was a rapid decay process; After Al3+ was added into the solution, TPE-COOH molecules were under the aggregation state. Moreover, the rotation in molecules was restricted, and the fluorescence decay was gradually slowed down. The above experiment certified that AIE effect of TPE-COOH was mainly generated by the restriction of rotation in molecules.
The aggregation mode between TPE-COOH and Al3+ was verified through 1H NMR of TPE-COOH/Al3+, change in electrical conductivity and hybrid density function B3LYP in density functional theory (DFT). By comparing Fig. 4E and 3A, 12.9 (s, 3H) in TPE-COOH 1H NMR disappeared after addition of Al3+, indicating that Al3+ replaced H to bind to –COOH. It can be seen from the change in electrical conductivity of TPE-COOH/Al3+ (Fig. 4F) that, the EC of system was gradually decreased after adding Al(NO3)3 with different concentrations into TPE-COOH solution, because a coordination structure was formed between TPE-COOH and Al3+, which caused TPE-COOH and Al3+ changing from free state to combined state, and further resulted in the decrease of EC. When the proportion between Al3+ to TPE-COOH was greater than 4, the change value of EC became basically stable, indicating that one Al3+ bound to four TPE-COOH approximately. To further explain the concrete binding mode between TPE-COOH and Al3+, the most stable binding mode (binding energy was −16.7 eV) between TPE-COOH and Al3+ was calculated through Gaussian, and the most stable binding structure between TPE-COOH and Al3+ was achieved when Al3+ replaced H to bind to –COOH as shown in Fig. 4G.
3.3 F− detection by the TPE-COOH/Al3+ system
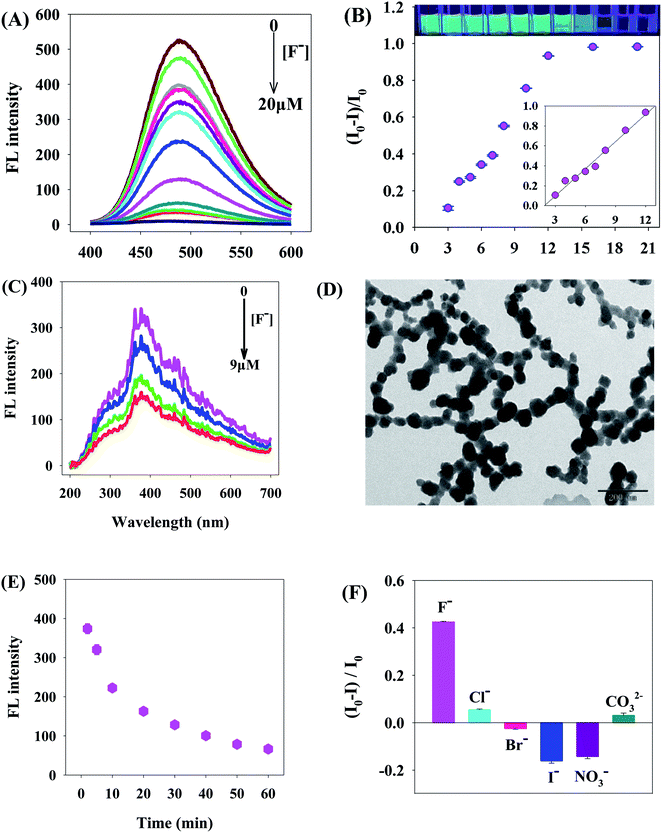
It could be seen from Fig. 5A and B that, as the F− concentration increased, the fluorescence intensity of TPE-COOH/Al3+ was regularly and gradually quenched, indicating that TPE-COOH/Al3+ could be used as a fluorescence probe of F−. The linear range of this TPE-COOH/Al3+ sensor for F− detection was 3–12 μM, the linear equation was (I0 − I)/I0 = 0.0908CF − 0.1737 (R = 0.991) and the detection limit was (3σ) 0.9 μM (Calculated the standard deviation (σ) after testing samples without F− and those containing 3 μM F− in parallel for 11 times, and took the three times of the standard deviation as the detection limit.). The relative standard deviation (RSD) of fluorescence intensities without F− and those containing μM F−, which were detected in parallel for 11 consecutive times, was 3.1%. The detection limit of this method was lower than that of fluorescence method,25,52,53 approximating to that of absorbance method54 (Table 1). In comparison with general fluorescence methods for organic small molecules based on “Turning on” pattern,52,53 this detection system can not only realize fluorescence analysis and detection of fluorine ions under “Turning on-off” pattern, but also improve the selectivity of fluorescence detection of AIE-based organic molecules.| Method | Detection signal | Linear range (μM) | Detection limit (μM) | Reference |
|---|---|---|---|---|
| Organic small molecule | Fluorescence | 102–106 | 100 | 52 |
| Carbon quantum dots | Fluorescence | 53–1316 | 53 | 25 |
| 8-Silyloxyquinoline scaffold | Fluorescence | 20–200 | 3.8 | 53 |
| Thin polymeric film | Absorbance | 0.1–1600 | 0.1 | 54 |
| This work | Fluorescence | 3–12 | 0.9 |
Fig. 5C shows the RLS spectra describing the interaction between TPE-COOH/Al3+ and F−; the RLS intensity of single TPE-COOH/Al3+ was strong. After the addition of F−, F− reacted with Al3+ to form AlF3 sediments insoluble in Tris–HCl buffer solution (pH 5.0) (Fig. 5D). TPE-COOH was gradually separated from Al3+ and dissolved in Tris–HCl buffer solution (pH 5.0), so the RLS intensity of reaction system was weakened. The TPE-COOH/Al3+ system rapidly responded to F− within 0–10 min (Fig. 5E) and stabilized after 50 min. The initial response time of this system was faster than the fluorescence method53 and the absorbance method.54 Under the concentration of 8.0 μM, the fluorescence disturbance of Cl−, Br−, I−, NO3− and CO32−on TPE-COOH/Al3+ was minor, indicating a good selectivity of TPE-COOH/Al3+ to F− detection (Fig. 5F).
Based on the above results, a TPE-COOH/Al3+-based fluorescence detection method was designed in this study. Under the optimal conditions, (I0 − I)/I0 value of TPE-COOH/Al3+ fluorescence intensity presented a linear relation with F− concentration within a certain scope, so that the fluorescence detection method of F− was established.
3.4 Standard recovery test of actual biological samples
To verify whether TPE-COOH/Al3+ could be applied to F− detection in actual biological samples, the standard recovery test of F− in urine was designed in this study, and the results showed that the standard recovery rate in urine ranged from 86.7% to 110% (Table 2).| Samples | Spiked (μM) | Found (μM) | Recovery (%) | RSD (%, n = 3) |
|---|---|---|---|---|
| Urine | 0 | — | — | — |
| 3 | 3.3 | 110 ± 6 | 5.5 | |
| 7 | 7.2 | 102 ± 2 | 2.0 | |
| 9 | 7.8 | 86.7 ± 1 | 1.0 |
4. Conclusion
A TPE derivative TPE-COOH was synthesized in this study, which bound to Al3+, formed TPE-COOH/Al3+ polymer and finally triggered AIE. As a result, the fluorescence of reaction system was enhanced (on). TPE-COOH/Al3+ was used as a sensor to realize the trace amount of fluorescence detection of F− through fluorescence quenching (off). The linear range and detection limit of this method for F− detection were 3–12 μM and 0.9 μM, respectively. Furthermore, the sensor of “Turning on-off” pattern can be used to realize the analysis and detection of F− in biological fluids.Conflicts of interest
The authors declare that there is no conflict of interest.Acknowledgements
The work was completed under the support of the National Natural Science Foundation of China (NSFC) (Grant 31700862).References
- Y. Yu, W. Yang, Z. Dong, C. Wan, J. Zhang, J. Liu, K. Xiao, Y. Huang and B. Lu, Fluoride, 2008, 41, 134–138 CAS.
- O. Barbier, L. Arreola-Mendoza and L. M. Del Razo, Chem.-Biol. Interact., 2010, 188, 319–333 CrossRef CAS PubMed.
- M. T. S. D. Vasconcelos, C. A. R. Gomes and A. A. S. C. Machado, J. Chromatogr. A, 1994, 685, 53–60 CrossRef CAS.
- O. Kalyakina and A. Dolgonosov, J. Am. Chem. Soc., 2003, 58, 951–953 CAS.
- P. Konieczka, B. Zygmunt and J. Namiesnik, Bull. Environ. Contam. Toxicol., 2000, 64, 794–803 CrossRef CAS PubMed.
- A. Ruiz-Payan, M. Ortiz and M. Duarte-Gardea, Microchem. J., 2005, 81, 19–22 CrossRef CAS.
- X. R. Xu, H. B. Li, J. D. Gu and K. J. Paeng, Chromatographia, 2004, 59, 745–747 CrossRef CAS.
- M. Garrido, A. G. Lista, M. Palomeque and B. S. Fernández Band, Talanta, 2002, 58, 849–853 CrossRef CAS PubMed.
- X. Wu, X. X. Chen, B. N. Song, Y. J. Huang, W. J. Ouyang, Z. Li, T. James and Y. B. Jiang, Chem. Commun., 2014, 50, 13987–13989 RSC.
- J. R. Lakowicz, Principles of fluorescence spectroscopy, Springer Science & Business Media, 2013 Search PubMed.
- R. B. Thompson, Fluorescence sensors and biosensors, CRC Press, 2005 Search PubMed.
- Z. Chi, X. Zhang, B. Xu, X. Zhou, C. Ma, Y. Zhang, S. Liu and J. Xu, Chem. Soc. Rev., 2012, 41, 3878–3896 RSC.
- D. Ding, K. Li, B. Liu and B. Z. Tang, Acc. Chem. Res., 2013, 46, 2441–2453 CrossRef CAS PubMed.
- J. Mei, Y. Hong, W. Jacky, A. Qin, Y. Tang and B. Tang, Adv. Mater., 2014, 26, 5429–5479 CrossRef CAS PubMed.
- Y. Hong, J. W. Lam and B. Z. Tang, Chem. Soc. Rev., 2011, 40, 5361–5388 RSC.
- C. Zhu, R. T. K. Kwok, J. W. Y. Lam and B. Z. Tang, ACS Appl. Bio Mater., 2018, 1, 1768–1786 CrossRef CAS.
- S. Niu, C. Bi and W. Song, Anal. Biochem., 2020, 590, 113532 CrossRef PubMed.
- H. Shi, R. T. Kwok, J. Liu, B. Xing, B. Z. Tang and B. Liu, J. Am. Chem. Soc., 2012, 134, 17972–17981 CrossRef CAS PubMed.
- M. J. Chang, K. Kim, C. Kang and M. H. Lee, ACS Omega, 2019, 4, 7176–7181 CrossRef CAS.
- H. Choi, S. Kim, S. Lee, C. Kim and J. H. Ryu, ACS Omega, 2018, 3, 9276–9281 CrossRef CAS PubMed.
- F. Dong, H. Lai, Y. Liu, Q. Li, H. Chen, S. Ji, J. Zhang and Y. Huo, Talanta, 2020, 206, 120177 CrossRef CAS PubMed.
- G. Huang, G. Zhang and D. Zhang, Chem. Commun., 2012, 48, 7504–7506 RSC.
- M. Wang, G. Zhang, D. Zhang, D. Zhu and B. Z. Tang, J. Mater. Chem., 2010, 20, 1858–1867 RSC.
- D. Wang and B. Z. Tang, Acc. Chem. Res., 2019, 52, 2559–2570 CrossRef CAS PubMed.
- P. Singhal, B. G. Vats, S. K. Jha and S. Neogy, ACS Appl. Mater. Interfaces, 2017, 9, 20536–20544 CrossRef CAS PubMed.
- P. Guan, B. Yang and B. Liu, Spectrochim. Acta, Part A, 2020, 225, 117604 CrossRef CAS PubMed.
- Q. Gao, L.-H. Xiong, T. Han, Z. Qiu, X. He, H. H. Y. Sung, R. T. K. Kwok, I. D. Williams, J. W. Y. Lam and B. Z. Tang, J. Am. Chem. Soc., 2019, 141, 14712–14719 CrossRef CAS PubMed.
- X. Wang, H. Wang, Y. Niu, Y. Wang and L. Feng, Spectrochim. Acta, Part A, 2020, 226, 117650 CrossRef CAS PubMed.
- F. Ye, Y. Liu, J. Chen, S. H. Liu, W. Zhao and J. Yin, Org. Lett., 2019, 21, 7213–7217 CrossRef CAS PubMed.
- G. Zhang, F. Hu and D. Zhang, Langmuir, 2014, 31, 4593–4604 CrossRef PubMed.
- N. B. Shustova, B. D. McCarthy and M. Dinca, J. Am. Chem. Soc., 2011, 133, 20126–20129 CrossRef CAS PubMed.
- N. Bian, Q. Chen, X.-L. Qiu, A.-D. Qi and B. H. Han, New J. Chem., 2011, 35, 1667–1671 RSC.
- L. Zhao, Z. Zhang, Y. Liu, J. Wei, Q. Liu, P. Ran and X. Li, J. Hazard. Mater., 2020, 385, 121556 CrossRef PubMed.
- M. Wang, D. Zhang, G. Zhang, Y. Tang, S. Wang and D. Zhu, Anal. Chem., 2008, 80, 6443–6448 CrossRef CAS PubMed.
- H. Shi, J. Liu, J. Geng, B. Z. Tang and B. Liu, J. Am. Chem. Soc., 2012, 134, 9569–9572 CrossRef CAS PubMed.
- F. Hu, Y. Huang, G. Zhang, R. Zhao, H. Yang and D. Zhang, Anal. Chem., 2014, 86, 7987–7995 CrossRef CAS PubMed.
- Y. Huang, F. Hu, R. Zhao, G. Zhang, H. Yang and D. Zhang, Chem.–Eur. J., 2014, 20, 158–164 CrossRef CAS PubMed.
- Y. Yang, L. Wang, H. Cao, Q. Li, Y. Li, M. Han, H. Wang and J. Li, Nano Lett., 2019, 19, 1821–1826 CrossRef CAS PubMed.
- R. Zhang, S. H. Sung, G. Feng, C.-J. Zhang, B. Z. Tang and B. Liu, Anal. Chem., 2017, 90, 1154–1160 CrossRef PubMed.
- Y. Hong, M. Häußler, J. W. Lam, Z. Li, K. K. Sin, Y. Dong, H. Tong, J. Liu, A. Qin and R. Renneberg, Chem. - Eur. J., 2008, 14, 6428–6437 CrossRef CAS PubMed.
- J.-P. Xu, Y. Fang, Z.-G. Song, J. Mei, L. Jia, A. J. Qin, J. Z. Sun, J. Ji and B. Z. Tang, Analyst, 2011, 136, 2315–2321 RSC.
- S. Gui, Y. Huang, F. Hu, Y. Jin, G. Zhang, L. Yan, D. Zhang and R. Zhao, Anal. Chem., 2015, 87, 1470–1474 CrossRef CAS PubMed.
- A. Chatterjee, M. Banerjee, D. Khandare, R. Gawas, S. Mascarenhas, A. Ganguly, R. Gupta and H. Joshi, Anal. Chem., 2017, 89, 12698–12704 CrossRef CAS PubMed.
- S. Chen, Y. Hong, Y. Liu, J. Liu, C. W. Leung, M. Li, R. T. Kwok, E. Zhao, J. W. Lam and Y. Yu, J. Am. Chem. Soc., 2013, 135, 4926–4929 CrossRef CAS PubMed.
- Z. Zhang, R. T. K. Kwok, Y. Yu, B. Z. Tang and K. M. Ng, ACS Appl. Mater. Interfaces, 2017, 9, 38153–38158 CrossRef CAS PubMed.
- A. D. Becke, J. Chem. Phys., 1997, 107, 8554–8560 CrossRef CAS.
- A. D. Becke, J. Chem. Phys., 1993, 98, 5648–5652 CrossRef CAS.
- H. Tong, Y. Hong, Y. Dong, M. Häußler, J. W. Y. Lam, Z. Li, Z. Guo, Z. Guo and B. Z. Tang, Chem. Commun., 2006, 21, 3705–3707 RSC.
- Y. Yuan, R. T. K. Kwok, B. Z. Tang and B. Liu, J. Am. Chem. Soc., 2014, 136, 2546–2554 CrossRef CAS PubMed.
- J. Liang, R. T. K. Kwok, H. Shi, B. Z. Tang and B. Liu, ACS Appl. Mater. Interfaces, 2013, 5, 8784–8789 CrossRef CAS PubMed.
- Y. Hu, L. Shi, Y. Su, C. Zhang, X. Jin and X. Zhu, Biomater. Sci., 2017, 5, 792–799 RSC.
- B. Sui, B. Kim, Y. Zhang, A. Frazer and K. D. Belfield, ACS Appl. Mater. Interfaces, 2013, 5, 2920–2923 CrossRef CAS PubMed.
- X. Zhou, R. Lai, H. Li and C. I. Stains, Anal. Chem., 2015, 87, 4081–4086 CrossRef CAS PubMed.
- I. H. Badr and M. E. Meyerhoff, J. Am. Chem. Soc., 2005, 127, 5318–5319 CrossRef CAS PubMed.
| This journal is © The Royal Society of Chemistry 2020 |

