 Open Access Article
Retracted Article: Color tuning of Bi3+-doped double-perovskite Ba2(Gd1−x,Lux)NbO6 (0 ≤ x ≤ 0.6) solid solution compounds via crystal field modulation for white LEDs
Xufang Tanga,
Dingfeng Jin*a,
Jun Zhaob and
Min Jin *c
*c
aCollege of Materials and Chemistry, China Jiliang University, Hangzhou 310018, P. R. China. E-mail: dfjin@cjlu.edu.cn
bSichuan College of Architectural Technology, Deyang 618000, P. R. China
cDepartment of Physics, Sichuan University, Huanlu Nan No. 21, Chengdu 610041, Sichuan, P. R. China. E-mail: superman_minjin@163.com
First published on 6th July 2020
Abstract
Nowadays, rare-earth-free color-tunable solid solutions are receiving great attention. Here, we synthesize a type of double-perovskite Ba2(Gd1−x,Lux)NbO6:Bi3+ (0 ≤ x ≤ 0.6) solid solution compound using high temperature solid state reaction. The structural phase purity and photoluminescence (PL) properties of the samples are characterized by powder X-ray diffraction (XRD), density functional theory (DFT) calculations, UV-visible diffuse reflectance spectroscopy and PL spectroscopy. Structural analysis shows that all the samples are crystallized in the double-perovskite structure with a cubic space group of Fm![[3 with combining macron]](https://www.rsc.org/images/entities/char_0033_0304.gif) m. Moreover, with the increase of Lu3+ content, the XRD positions are gradually shifted toward higher diffraction angles, indicating the shrinkage of the crystal lattice. Our PL results show that the Ba2(Gd1−x,Lux)NbO6:Bi3+ solid solutions can show Bi3+ tunable emissions from 462 nm to 493 nm and excitation peaks from 363 nm to 390 nm with the increase of Lu3+ content from 0 to 0.6, owing to the crystal field modulation around the Bi3+ ion. In addition, the blue-shift of the host excitation peaks is also observed, which is ascribed to the increase of bandgap energies (i.e., from 3.01 eV to 4.14 eV based on the DFT calculations). Besides, due to the closer structural rigidity induced by the replacement of larger Gd3+ ions with smaller Lu3+ ions, the Ba2(Gd1−x,Lux)NbO6:Bi3+ solid solutions show an increase of Bi3+ emission intensity and QE values followed by a subsequent decrease. As a result, the highest QE value, which corresponds to Ba2Gd0.8Lu0.2NbO6:Bi3+, is 49%. Finally, by coating this optimal blue phosphor and the red CsPb(Br0.4I0.6)3 phosphor on a commercial UV LED chip, a white LED device with a color temperature (CT) of 3633 K, CIE value at (0.381, 0.379), color rendering index (CRI) of 78.4, and luminous efficiency of 48 lm W−1 is achieved.
m. Moreover, with the increase of Lu3+ content, the XRD positions are gradually shifted toward higher diffraction angles, indicating the shrinkage of the crystal lattice. Our PL results show that the Ba2(Gd1−x,Lux)NbO6:Bi3+ solid solutions can show Bi3+ tunable emissions from 462 nm to 493 nm and excitation peaks from 363 nm to 390 nm with the increase of Lu3+ content from 0 to 0.6, owing to the crystal field modulation around the Bi3+ ion. In addition, the blue-shift of the host excitation peaks is also observed, which is ascribed to the increase of bandgap energies (i.e., from 3.01 eV to 4.14 eV based on the DFT calculations). Besides, due to the closer structural rigidity induced by the replacement of larger Gd3+ ions with smaller Lu3+ ions, the Ba2(Gd1−x,Lux)NbO6:Bi3+ solid solutions show an increase of Bi3+ emission intensity and QE values followed by a subsequent decrease. As a result, the highest QE value, which corresponds to Ba2Gd0.8Lu0.2NbO6:Bi3+, is 49%. Finally, by coating this optimal blue phosphor and the red CsPb(Br0.4I0.6)3 phosphor on a commercial UV LED chip, a white LED device with a color temperature (CT) of 3633 K, CIE value at (0.381, 0.379), color rendering index (CRI) of 78.4, and luminous efficiency of 48 lm W−1 is achieved.
1. Introduction
In recent years, Bi3+-doped phosphors have received more and more attention due to the crystal host-dependent Bi3+ photoluminescence (PL) resulting from its electron configuration of [Xe]-4f145d106s2.1,2 So far, single Bi3+-doped phosphors can show emission colors from UV,3 blue,4 and green,5 to yellow.6,7 Besides, Bi3+ is also reported to serve as an energy transfer sensitizer for rare-earth (RE) (e.g., Eu3+–Tb3+,4,8 Pr3+,9 and Sm3+ (ref. 10)) and non-RE (e.g., Mn4+ (ref. 11) and Cr3+ (ref. 12)) ions to enhance the PL intensity of these RE and non-RE ions. In addition, this energy transfer can sometimes lead to the PL tuning due to the combination of the emissions of the Bi3+ and RE or non-RE ions.4,8,9,11 Nowadays, tunable solid solutions play an important role in the lighting field because they can emit a desirable wavelength for device design but other factors should also be considered, such as the different responses of different phosphors to the same LED chip temperature.13 Thus, exploring tunable solid solutions is receiving great attention. Although some Bi3+ doped tunable solid solutions14–17 have been reported, their numbers are still very rare and need to be increased.Nowadays, perovskite-typed crystals used for white LEDs are hot research topic.18–25 As an important type of inorganic materials, the double-perovskite crystals with the structural composition of (A2BB′O6) can have good electrical and optical properties.22,23 Depending on the A, B and B′ atoms, they can show different crystal hosts for different RE and non-RE ions doping such as Bi3+–Mn4+,22 Eu3+,23,24 and Pr3+.25 Among them, Huang et al.22 reported that the co-substitution of the Gd3+/Nb5+ ions with the Bi3+/Mn4+ ions in the Ba2GdNbO6 crystal host could lead to the emission tuning, but the tunable solid solutions using the Ba2GdNbO6 as the starting host and the Bi3+ ion as the luminescent center are still not reported.
In this work, we reported a new type of Ba2(Gd1−x,Lux)NbO6:Bi3+ (0 ≤ x ≤ 0.6) solid solutions that can show the Bi3+ emission tuning from 462 nm to 493 nm and Bi3+ excitation tuning from 363 nm to 390 nm as the x value is increased from 0 to 0.6. To reveal the reason of this spectral tuning, we carried out the DFT calculations, UV-vis reflectance and PL spectral measurements. Results and discussions are shown below.
2. Synthesis, characterization, and DFT calculations
Here, a series of Ba2(Gd1−x,Lux)NbO6:Bi3+ (x = 0, 0.1, 0.2, 0.3, 0.4, 0.5, and 0.6) solid solutions were prepared using the high temperature solid-state reaction method, and the raw chemical materials were BaCO3 (analytical reagent), Gd2O3 (99.9%), Lu2O3 (99.99%), Nb2O5 (99.9%), and Bi2O3 (99.98%). The doping content of Bi3+ ion is 0.01, which is from Huang et al.22 Firstly, the reagents were weighed according to the above chemical composition, and milled in an agate mortar for 1 h. Then, the mixed powders were fired in an oven at 1200 °C for 5 h in air. Finally, after re-milling for 15 min after cooling to room temperature, we achieved the required solid solutions.The powder X-ray diffraction (XRD) and PL spectra of the Ba2(Gd1−x,Lux)NbO6:Bi3+ samples were recorded on a powder diffractometer used a Cu Kα irradiation source of λ = 1.5406 Å, tube voltage of 36 kV, and tube current of 20 mA, and a Hitachi F-7000 fluorescent spectrophotometer equipped with a mercury lamp as the excitation source, respectively. The UV-vis reflectance spectra, quantum efficiency (QE) yields, and electroluminescence (EL) performances of the LED device were recorded using the UV-2550 PC UV-vis spectrometer (Shimadzu Corp., Japan), C9920-02 quantum yield system (Hamamatsu Photonics K. K., Japan), and StarspecSS-P6612 spectrometer, respectively.
The first-principle calculations on the Ba2(Gd1−x,Lux)NbO6:Bi3+ (x = 0, 0.1, 0.2, 0.3, 0.4, 0.5, and 0.6) solid solutions were performed within the framework of DFT using the Vienna ab initio simulation package (VASP),26 with a kinetic energy cutoff of 400 eV for the plane wave basis set expansion and 2π × 0.1 Å−1 k-spacing to sample the Brillouin zone. Lattice dynamical properties and bandgap energies were calculated using the projector-augmented plane–wave (PAW) potentials27 with the generalized gradient approximation (GGA) of Perdew–Burke–Ernzerh of parameterization.28
3. Results and discussion
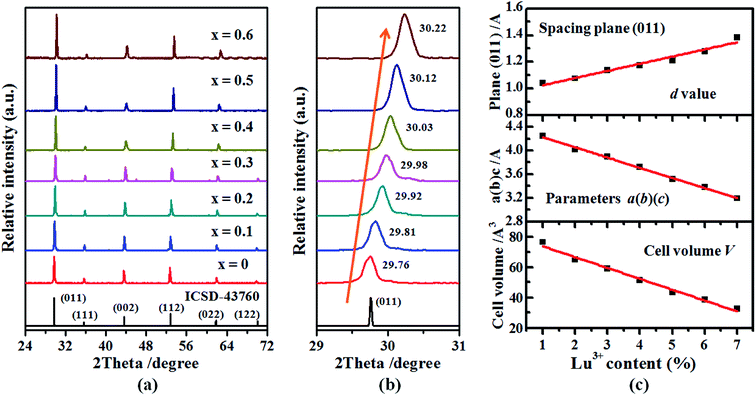
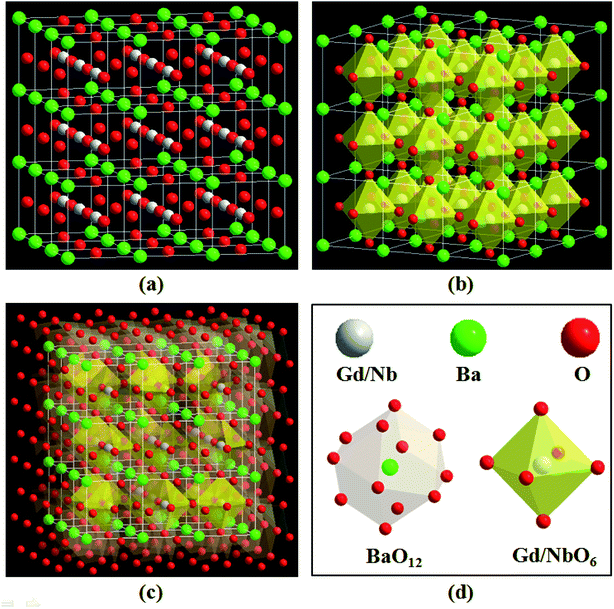
The XRD patterns of Ba2(Gd1−x,Lux)NbO6:Bi3+ (x = 0, 0.1, 0.2, 0.3, 0.4, 0.5, and 0.6) solid solutions are shown in Fig. 1. It is obvious that all XRD positions of the samples match with that of ICSD file no. 43760, indicating that the addition of the Bi3+ ions and the change of the Gd3+ and Lu3+ ratios in the Ba2(Gd1−x,Lux)NbO6:Bi3+ solid solutions do not induce the change of phase purification (Fig. 1a). Hence, we achieve the aimed solid solutions. As depicted by the XRD range of 29–31° (where the (011) plane is in this range, and its diffraction intensity is the strongest line), the XRD peaks are gradually shifted to higher angle as the Lu3+ content is increased from 0 to 0.6, the diffraction angle, (Fig. 1b), indicating that the change of the Gd3+ and Lu3+ ratio influences the crystal lattice but can keep the phase purification.To explain the XRD peak shifting, we draw the crystal structure of the starting crystal Ba2GdNbO6, as shown in Fig. 2. In this figure, we can see that the A, B and B′ are related to the Ba, Gd, and Nb atoms, which are coordinated with 12, 6, and 6 oxygen atoms, respectively. When considered the Gd3+ ions are replaced by the Lu3+ ions, the Lu3+ ions are also coordinated with 6 oxygen atoms. According to the previous works,22,24,25 we can know that the radii of Ba2+, Gd3+, Lu3+, and Nb5+ ions are 1.61 Å, 0.938 Å, 0.861 Å, and 0.64 Å, respectively. On one hand, since the radius of the Bi3+ ion at six coordination number is 1.03 Å while the Ba2+ ion is located in the interstitial void between octahedra, the Bi3+ ions tend to substitute the Gd3+ ions rather than the Ba2+, Lu3+, and Nb5+ ions. On the hand, the ionic radii and charge differences between the Bi3+ and Ba2+/Lu3+/Nb5+ ions are larger than that between the Bi3+ and Gd3+ ions. In this case, when the Bi3+ content is fixed (i.e., 0.01), the shrinkage of lattice cells, as shown by taking the spacing plane (011) as an example, appears with the substitution of larger Gd3+ ions with smaller Lu3+ ions. As a result, based on the equation of nλ = 2d![[thin space (1/6-em)]](https://www.rsc.org/images/entities/char_2009.gif) sin
sin![[thin space (1/6-em)]](https://www.rsc.org/images/entities/char_2009.gif) θ14–16,29,30 (where n is an integer, λ is the wavelength of incident X-ray, d is the spacing between the planes in the atom lattice, and θ is the angle between the incident XRD ray and the scattering planes), when the n and λ are fixed, the decrease of d values leads to the increase of the values from sin
θ14–16,29,30 (where n is an integer, λ is the wavelength of incident X-ray, d is the spacing between the planes in the atom lattice, and θ is the angle between the incident XRD ray and the scattering planes), when the n and λ are fixed, the decrease of d values leads to the increase of the values from sin![[thin space (1/6-em)]](https://www.rsc.org/images/entities/char_2009.gif) θ, thereby shifting the XRD peak to higher angle. Moreover, according to the Végard law, we also calculated the lattice parameters a(b)(c), and cell volume (V), as shown in Fig. 1c. In addition to the spacing d values, it is obvious that the lattice parameters a(b)(c), and cell volume V are also decreased with the increase of the Lu3+ content, indicating the shrinkage of the lattice cell. Due to this regular change of the crystal lattice, the regular change of the optical bandgaps energy and spectral properties may appear.
θ, thereby shifting the XRD peak to higher angle. Moreover, according to the Végard law, we also calculated the lattice parameters a(b)(c), and cell volume (V), as shown in Fig. 1c. In addition to the spacing d values, it is obvious that the lattice parameters a(b)(c), and cell volume V are also decreased with the increase of the Lu3+ content, indicating the shrinkage of the lattice cell. Due to this regular change of the crystal lattice, the regular change of the optical bandgaps energy and spectral properties may appear.
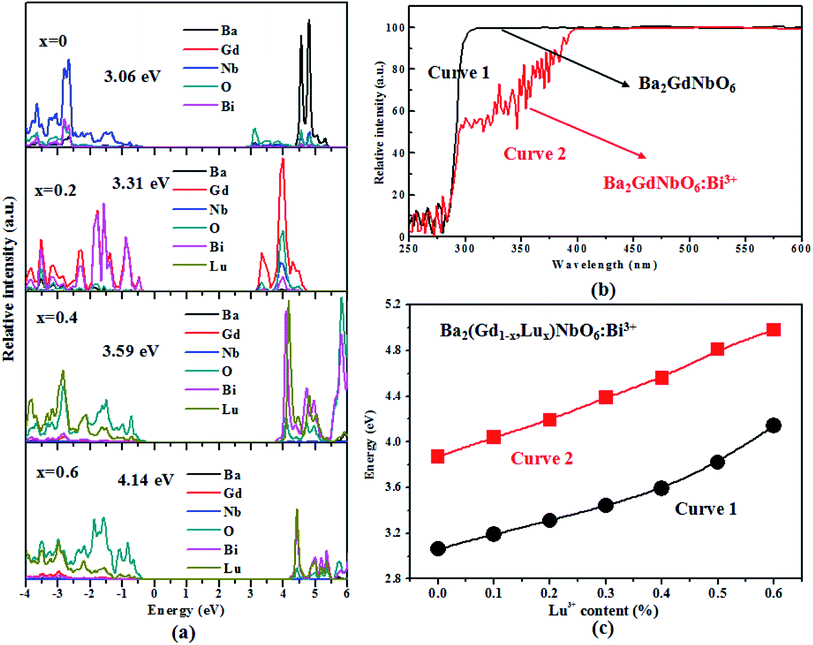
The density of state (DOS) results of the Ba2(Gd1−x,Lux)NbO6:Bi3+ (x = 0, 0.2, 0.4, and 0.6) solid solutions are shown in Fig. 3a. Clearly, the top of valence band (VB) and the bottom of conduction band (CB) of the Ba2GdNbO6:Bi3+ are composed of the Nb(4d) states and O(2p) states, respectively. However, for other compounds (namely, Ba2(Gd1−x,Lux)NbO6:Bi3+ (x = 0.2, 0.4, and 0.6)), the top of the VB mainly consists of Gd(3d) states and Bi(6p) states for the Ba2(Gd0.8,Lu0.2)NbO6:Bi3+, and O(2p) states for the Ba2(Gd0.6,Lu0.4)NbO6:Bi3+ and Ba2(Gd0.4,Lu0.6)NbO6:Bi3+, but the bottom of the CB mainly consists of the Gd(3d) states for Ba2(Gd0.8,Lu0.2)NbO6:Bi3+, Bi(6p) states and Lu(5d) states for Ba2(Gd0.6,Lu0.4)NbO6:Bi3+ and Ba2(Gd0.4,Lu0.6)NbO6:Bi3+. It is also shown in Fig. 3a that the contribution of the Lu(5d) states to the CB ad VB appears with the increase of the Lu3+ content. Based on our DFT calculations, we find reveal that replacing the Gd3+ by Lu3+ ions increases the band-gap (Eg) energies from 3.01 eV to 4.14 eV (Fig. 3b). Our DFT results are similar to other Bi3+-doped solid solutions featured the increase of Eg with the replacement of larger ions by smaller ions (e.g., Sc(Vx,P1−x)O4:Bi3+,15 Ba3−xSrxSc4O9:Bi3+,16 and YPxV1–xO4:Bi3+).17
The UV-vis diffuse reflectance spectra of Ba2GdNbO6 and Ba2GdNbO6:Bi3+ samples are shown in Fig. 3b. A strong absorption band in the range of 250–310 nm appear in bulk Ba2GdNbO6, which is due to the host absorption. In Ba2GdNbO6:Bi3+, another weak absorption band in the range of 310–370 nm appears, which is assigned to the absorption of Bi3+ ions. Based on the reflectance curve of Ba2GdNbO6, we obtain the optical bandgap values using the Kubelka–Munk equation,31 F(R∞) = (1 − R∞)2/2R∞ = K/S, where parameters R∞, K, and S are the reflectance, absorption, and scattering co-efficiencies, respectively. As a result, with the relationship between the absorption efficient α and bandgap Eg values,22,31 αhv = C1(hv − Eg)n/2 (where parameters C1, h, v, and n are the proportionality constant, Planck constant (h = 4.14 × 10⁻¹⁵ eV s−1), light frequency and constant, respectively), the Eg value (5.34 eV) of this sample can be achieved. Similarly, the Eg values of the Ba2(Gd1−x,Lux)NbO6:Bi3+ solid solutions are obtained. The Lu3+ content dependent experimental and theoretical Eg values are shown in Fig. 3c. Obviously, these experimental Eg values with the increase of the Lu3+ (x) content show the similar tendency.
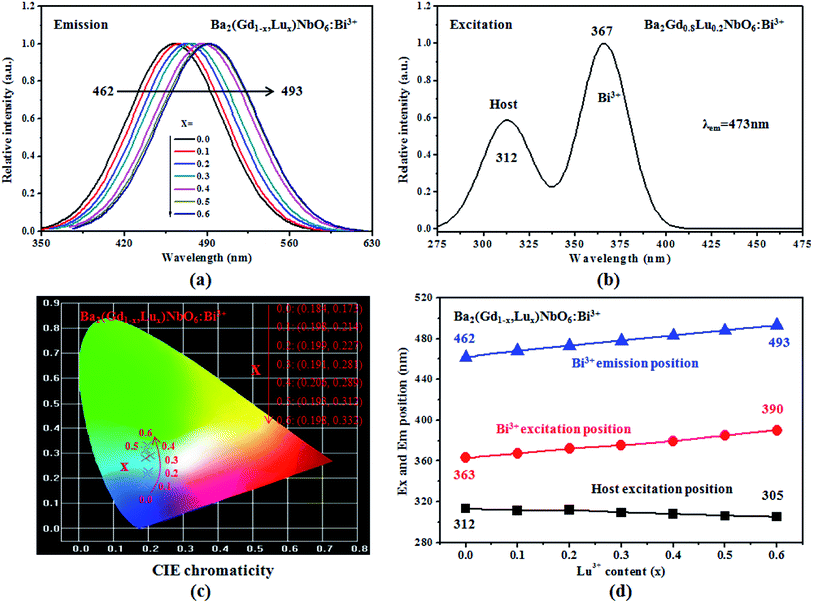
The emission and excitation spectra of Ba2(Gd1−x,Lux)NbO6:Bi3+ (x = 0, 0.1, 0.2, 0.3, 0.4, 0.5, and 0.6) samples are shown in Fig. 4a and b. There is only one emission band of the Bi3+ 3P1 → 1S0 transition, confirming that the obtained solid solutions have only one crystal site (i.e., Gd3+) for the Bi3+ substitution. The emission position with the increase of the Lu3+ content is shifted from 462 nm to 493 nm. This result verify the microenvironment around Bi3+ ions is regularly changed in the formation of the solid solutions. Upon monitoring at the maximum emission intensity, the excitation spectra of the solid solutions can be achieved, and they consist of two broad yet overlapping bands. Among them, the bands peaked at higher energy are from the host absorption and the positions with the increase of the Lu3+ content are slightly shifted to shorter wavelength (the shifting range is not broad); other bands peaked at lower energy are due to the Bi3+ 1S0 → 3P1 transition and the positions are shifted from 363 nm to 390 nm. For the former positions tuning, it is consistent with the increase of Eg values. Thus, they can be ascribed to the optical bandgap modulation. However, since the Bi3+ ion is a type of ion sensitive to its local microenvironment, the Bi3+ excitation and emission positions tuning can be ascribed to the modulation of crystal field strength, as we will discuss below. The tunable emission positions are reflected by the tunable CIE chromaticity coordinates, as shown in Fig. 4c. Obviously, the colors are tuned in the blue region, from deep blue to pale blue. Fig. 4d show the dependence of the excitation positions of the host and Bi3+ ions and Bi3+ emission positions on the Lu3+ content. A linear relationship against the Lu3+ content is seen, meaning that the Bi3+ excitation and emission position can be achieved in the range of 363–390 nm and 462–493 nm by adjusting the Lu/Gd ratios.
According to the previous works,14–16,30,31 the major reason for the red-shift of the emission position of a given dopant in the solid solutions is assigned to the crystal field modulation caused by the size mismatching of the replacement ions. In general, the crystal field strength (Dq) of the doping ion in a given solid solution is expressed as below:16
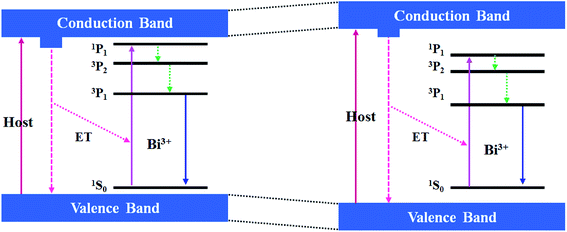
The mechanistic diagram depicted in Fig. 5 can be used to explain the above Bi3+ luminescence. Upon excitation with the excitation wavelengths of Bi3+ ions, the Bi3+ electrons are lifted from the 1S0 ground state to the 3P1, 3P2, 1P1 excited states. Then, the excited electrons relax from the 3P2 and 1P1 energy level to the 3P1 energy level and come back the 1S0 ground energy level followed by the generation of the Bi3+ emissions. Sine the crystal field around Bi3+ ions is strengthened as the Gd3+ ions are substituted by the Lu3+ ion, the lowest 3P1 state of Bi3+ ion is closer to its 1S0 ground state. In this case, the red-shift of Bi3+ emission positions appears. Moreover, the Bi3+ emission can be achieved when the excitation wavelengths are less 315 nm (namely, the host excitation, e.g., under 290 nm excitation) (not shown here), which means that there is the energy transfer from the host to the Bi3+ ion. However, the bulk samples without Bi doping do not have the luminescence, so there is no transition from the bottom of conduction band (CB) to the top of valence band (VB). Besides, since the host excitation energies (the blueshift of excitation position) are increased with the increase of the Lu3+ content, the bandgap energies are increased, as reflected by the enlarged VB and CB gaps.
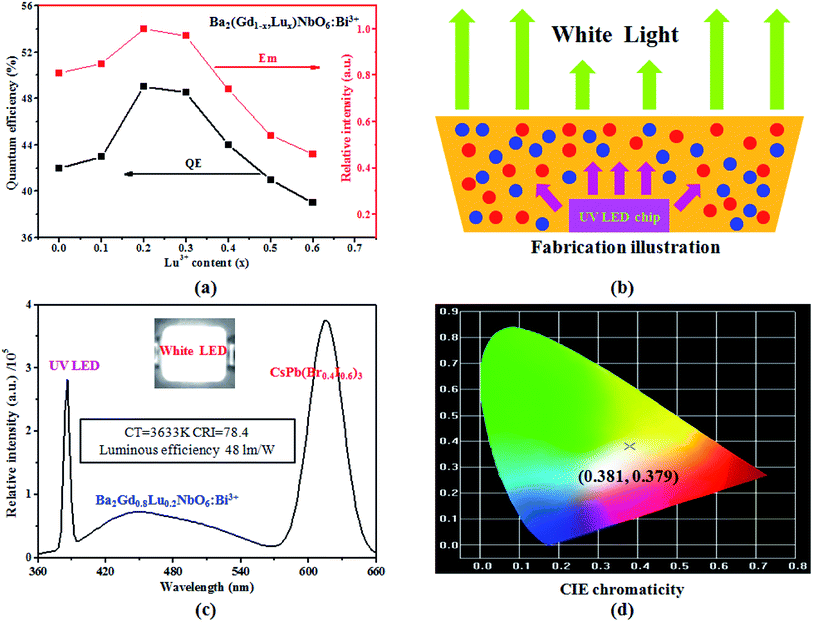
In addition to the above PL spectral results, here we also have measured the QE of the Ba2(Gd1−x,Lux)NbO6:Bi3+ (x = 0–0.6) samples by exciting with the maximum Bi3+-excitation intensity. Although these samples show different QE values, but the highest QE value is 49% (Fig. 6a, black), relating to the Ba2Gd0.8Lu0.2NbO6:Bi3+ sample. Moreover, these QE values experience an initial increase followed by a subsequent decrease. This QE variation is similar to the emission intensity variation of Bi3+ ion (Fig. 6a, red). In a word, the improved emission intensity is observed in the Ba2(Gd1−x,Lux)NbO6:Bi3+ (x = 0–0.6) solid solutions. Since the Gd3+, Lu3+ and Bi3+ ions have the same valence and the content of Bi3+ ions (i.e., 0.01) is fixed, this crystal lattice regulation can be assigned to the change of the Gd3+ and Lu3+ radii mismatching. Hence, the shrinkage of the crystal lattice induced by the replacement of larger Gd3+ ions with smaller Lu3+ ions induces the closer structure rigidity, leading to the enhanced emission of Bi3+ ions. However, once the distance of the Bi3+ ions is too close, the relative Bi3+ concentration in a given lattice volume is increased, which leads to the PL quenching from the Bi3+ ions themselves. This increase and decrease progress of the PL intensity is similar to the dopant-content induced PL quenching. In the previous works,16,22,30 several RE and non-RE doped solid solutions can show the improved emission intensity of these RE and non-RE ion. Importantly, the excitation peak of the Ba2Gd0.8Lu0.2NbO6:Bi3+ sample is located at 388 nm, which matches with the commercial UV LED chip with the emission range at around 385–400 nm. Hence, we use this UV-converted blue-emitting sample to prove the application of the as-obtained solid solutions for the white LEDs by combining the red CsPb(Br0.4I0.6)3 perovskite crystals reported byref. 32. The fabrication patterns, EL spectrum, key parameters, photographs and CIE chromaticity of this white LED device are shown in Fig. 6b–d. Our measurements show that this LED device show the white-emitting color, with the CIE chromaticity coordinates at (0.381, 0.379). The related CT, CRI, and luminous efficiency are 3633 K, 78.4, and 48 lm W−1, respectively, proving the potential application for white LEDs.
4. Conclusion and perspectives
In this work, the double-perovskite Ba2(Gd1−x,Lux)NbO6:Bi3+ tunable solid solutions are synthesized using the high temperature solid-state reaction. Structural analysis reveals that the as-obtained tunable solid solutions are crystallized in a cubic structure with the space group of Ia3d (No. 230). Due to the radii difference between the Gd3+ and Lu3+ ions, the XRD positions with the increase of Lu3+ (x) content shift to higher diffraction angle, leading to the change of lattice parameters a(b)(c) and the shrinkage of cell volume (V). The electronic Eg bandgaps energies, evaluated basing on the DFT calculations and UV-visible diffuse reflectance spectra, are increased with the increase of Lu3+ (x) content, leading to the shifting of the host excitation positions to shorter wavelength (i.e., higher energy). In addition, with the increase of Lu3+ content, we find that the Bi3+ emission and excitation positions are tuned from 462 nm to 493 nm and 363 nm to 390 nm, respectively, which are assigned to the crystal strength field modulation around Bi3+ ions. Moreover, the enhanced Bi3+ emission intensity and QE values, possibly caused by the closing structure rigidity, is also observed, where the Ba2Gd0.8Lu0.2NbO6:Bi3+ is the optimal sample. Based on this Ba2Gd0.8Lu0.2NbO6:Bi3+ blue sample and red CsPb(Br0.4I0.6)3 perovskite crystals and a 385 nm UV LED chip, we fabricate a white LED device that can show the CIE coordinates at (0.381, 0.379), color rendering index (CRI) of 78.4, color temperature (CT) of 3633 K, and luminous efficiency of 48 lm W−1. In addition, the Ba2(Gd1−x,Lux)NbO6:Bi3+ perovskites are oxygen-contained perovskites, which can exhibit the moisture-induced PL quenching and structural instability much better than those oxygen-free perovskites such as the CsPb2Br5,18 CsPbBr3,19 CsPbBr1.5Cl1.5,20 and so on. Moreover, although some of oxygen-contained perovskites, such as Ba2GdNbO6:Bi3+,Mn4+,22 La2ATiO6:Bi3+,Mn4+ (A = Mg,Zn),30 and La2(Znx,Mg1−x)TiO6 (0 ≤ x ≤ 1):Bi3+,31 are also reported, our luminous parameters are better or comparable to theirs. More importantly, the Ba2(Gd1−x,Lux)NbO6:Bi3+ solid solutions contain the non-toxic metals (e.g., Pb), which could have less bad influence on the environment and human heath. All in all, this work reports a new type of perovskite-typed Bi3+-doped tunable solid solutions, which can have the potential application for the white LEDs,33,34 and the building lighing.35,36 Futhermore, this work can also give clues to other fields, such as the use of the light to address the environmental problems, such as the degradation of antibiotic materials,37 organic materials,38 and the treatment of wastewater,38 acid water.39Conflicts of interest
There are no conflicts to declare.Acknowledgements
This work is funded by the project of Natural Science Foundation (no. 18zx7125) from Southwest University of Science and Technology.References
- R. H. P. Awater and P. Dorenbos, The Bi3+ 6s and 6p electron binding energies in relation to the chemical environment of inorganic compound, J. Lumin., 2017, 184, 221–231 CrossRef CAS.
- A. Kudo and H. Satoshi, H2 or O2 Evolution from Aqueous Solutions on Layered Oxide Photocatalysts Consisting of Bi3+ with 6s2 Configuration and d0 Transition Metal Ions, Chem. Lett., 1999, 28, 1103–1104 CrossRef.
- F. J. Lohmeier and F. Fischer, VUV and UV Spectroscopy of Pb2+ and Bi3+ Centres in Alkaline-Earth Fluorides, Phys. Status Solidi B, 1989, 154, 789–803 CrossRef.
- P. Yang, Yu Xue, H. Yu, T. Jiang, X. Xu, Z. Yang, D. Zhou, Z. Song, Y. Yang, Z. Zhao and J. Qiu, Ca2Al2SiO7:Bi3+,Eu3+,Tb3+: a potential single-phased tunable-color-emitting phosphor, J. Lumin., 2013, 135, 206–210 CrossRef CAS.
- H. Ju, W. Deng, B. Wang, J. Liu, X. Tao and S. Xu, The structure and luminescence properties of green Ca3Al2O6:Bi3+ phosphors, J. Alloys Compd., 2012, 516, 153–156 CrossRef.
- R. Cao, G. Quan, Z. Shi, Z. Luo, Q. Hu and S. Guo, A double perovskite Ca2MgWO6:Bi3+ yellow-emitting phosphor: synthesis and luminescence properties, J. Lumin., 2017, 181, 332–336 CrossRef CAS.
- F. Kang, M. Peng, Q. Zhang and J. Qiu, Abnormal Anti-Quenching and Controllable Multi-Transitions of Bi3+ Luminescence by Temperature in a Yellow-Emitting LuVO4:Bi3+ Phosphor for UV-Converted White LEDs, Chem.– Eur J., 2014, 20, 11522–11530 CrossRef CAS PubMed.
- W. Xie, Y. Mo, C. Zou, F. Kang and G. Sun, Broad color tuning and Eu3+-related photoemission enhancement via controllable energy transfer in the La2MgGeO6:Eu3+,Bi3+ phosphor, Inorg. Chem. Front., 2018, 5, 1076–1084 RSC.
- W. Tan and D. Chen, Enhanced red emission in CaTiO3:Pr3+,Bi3+,B3+ phosphors, Phys. Status Solidi A, 2009, 206, 229–232 CrossRef.
- Z. Wang, H. Liang, M. Gong and Q. Su, Novel red phosphor of Bi3+,Sm3+ co-activated NaEu(MoO4)2, Opt. Mater., 2007, 29, 896–900 CrossRef CAS.
- Yu Ding, N. Guo, L. ü Xiang, H. Zhou, Lu Wang, R. Ouyang, Y. Miao and B. Shao, None-rare-earth activated Ca14Al10Zn6O35:Bi3+,Mn4+ phosphor involving dual luminescent centers for temperature sensing, J. Am. Ceram. Soc., 2019, 102, 7436–7447 CrossRef CAS.
- Z. Zou, X. Tang, C. Wu, D. Wang, J. Zhang, Z. Ci, S. Du and Y. Wang, How to tune trap properties of persistent phosphor: photostimulated persistent luminescence of NaLuGeO4:Bi3+,Cr3+ tailored by trap engineering, Mater. Res. Bull., 2018, 97, 251–259 CrossRef CAS.
- F. Kang, G. Sun, A. Wang, X. Xiao, Y. Y. Li, J. Lu and B. Huang, Multicolor Tuning and Temperature-Triggered Anomalous Eu3+-Related Photoemission Enhancement via Interplay of Accelerated Energy Transfer and Release of Defect-Trapped Electrons in the Tb3+,Eu3+-Doped Strontium-Aluminum Chlorites, ACS Appl. Mater. Interfaces, 2018, 10, 36157–36170 CrossRef CAS.
- F. Kang, M. Peng, X. Yang, G. Dong, G. Nie, W. Liang, S. Xu and J. Qiu, Broadly tuning Bi3+ emission via crystal field modulation in solid solution compounds (Y,Lu,Sc)VO4:Bi for ultraviolet converted white LEDs, J. Mater. Chem. C, 2014, 2, 6068–6076 RSC.
- F. Kang, G. Sun, P. Boutinaud, F. Gao, Z. Wang, J. Lu, Y. Y. Li and S. Xiao, “Tuning the Bi3+-photoemission color over the entire visible region by manipulating secondary cations modulation in the ScVxP1−xO4:Bi3+ (0 ≤ x ≤ 1) solid solution, J. Mater. Chem. C, 2019, 7, 9865–9877 RSC.
- P. Dang, S. Liang, G. Li, H. Lian, M. Shang and J. Lin, Broad color tuning of Bi3+/Eu3+-doped (Ba,Sr)3Sc4O9 solid solution compounds via crystal field modulation and energy transfer, J. Mater. Chem. C, 2018, 6, 9990–9999 RSC.
- E. Cavalli, F. Angiuli, F. Mezzadri, M. Trevisani, M. Bettinelli, P. Boutinaud and M. G. Brik, Tunable luminescence of Bi3+-doped YPxV1−xO4 (0≤ x≤ 1), J. Phys.: Condens. Matter, 2014, 27, 385503 CrossRef PubMed.
- C. Han, C. Li, Z. Zang, M. Wang, K. Sun, X. Tang and J. Du, Tunable luminescent CsPb2Br5 nanoplatelets: applications in light-emitting diodes and photodetectors, Photonics Res., 2017, 5, 473–480 CrossRef CAS.
- C. Li, Z. Zang, W. Chen, Z. Hu, X. Tang, W. Hu, K. Sun, X. Liu and W. Chen, Highly pure green light emission of perovskite CsPbBr3 quantum dots and their application for green light-emitting diodes, Opt. Express, 2016, 24, 15071 CrossRef CAS PubMed.
- S. Zhao, Y. Zhang and Z. Zang, Room-temperature doping of ytterbium into efficient near-infrared emission CsPbBr1.5Cl1.5 perovskite quantum dots, Chem. Commun., 2020, 56, 5811–5814 RSC.
- H. Guan, S. Zhao, H. Wang, D. Yan, M. Wang and Z. Zang, Room temperature synthesis of stable single silica-coated CsPbBr3 quantum dots combining tunable red emission of Ag-In-Zn-S for High-CRI white light-emitting diodes, Nano Energy, 2020, 67, 104279 CrossRef CAS.
- D. Huang, P. Dang, H. Lian, Q. Zeng and J. Lin, Luminescence and Energy-Transfer Properties in Bi3+/Mn4+-Codoped Ba2GdNbO6 Double-Perovskite Phosphors for White-Light-Emitting Diodes, Inorg. Chem., 2018, 58, 15507–15519 CrossRef PubMed.
- S. Ye, C. H. Wang, Z. S. Liu, J. Lu and X. P. Jing, Photoluminescence and Energy Transfer of Phosphor Series Ba2−zSrzCaMo1−yWyO6:Eu,Li for White Light UVLED Applications, Appl. Phys. B: Lasers Opt., 2008, 91, 551–557 CrossRef CAS.
- V. Sivakumar and U. V. Varadaraju, Synthesis, phase transition and photoluminescence studies on Eu3+-substituted double perovskites—A novel orange-red phosphor for solid-state lighting, J. Solid State Chem., 2008, 181, 3344–3351 CrossRef CAS.
- E. Sreeja, V. Vidyadharan, S. K. Jose, A. George, C. Joseph, N. V. Unnikrishnan and P. R. Biju, A single-phase white light emitting Pr3+ doped Ba2CaWO6 phosphor: synthesis, photoluminescence and optical properties, Opt. Mater., 2018, 78, 52–62 CrossRef CAS.
- G. Sun, J. Kürti, P. Rajczy, M. Kertesz, J. Hafner and Georg Kresse, Performance of the Vienna ab initio simulation package (VASP) in chemical applications, J. Mol. Struct., 2003, 624, 37–45 CrossRef CAS.
- N. A. W. Holzwarth, G. E. Matthews, R. B. Dunning, A. R. Tackett and Y. Zeng, Comparison of the projector augmented-wave, pseudopotential, and linearized augmented-plane-wave formalisms for density-functional calculations of solids, Phys. Rev. B: Condens. Matter Mater. Phys., 1997, 55, 2005 CrossRef CAS.
- H. L. Fu, M. M. Wang, P. Li, S. Jiang, W. Hu, X. T. Guo and M. Cao, Tracing Knowledge Development Trajectories of the Internet of Things Domain: A main path analysis, IEEE Transactions on Industrial Informatics, 2019, 15, 6531–6540 Search PubMed.
- H. Van Swygenhoven and S. Petegem, In-situ mechanical testing during X-ray diffraction, Mater. Charact., 2013, 78, 47–59 CrossRef CAS.
- G. Xing, Y. Feng, M. Pan, W. Yi, G. Li, P. Dang, S. Liang, S. Maxim, Molokeev, Z. Cheng and J. Lin, Photoluminescence tuning in a novel Bi3+/Mn4+ co-doped La2ATiO6:(A = Mg, Zn) double perovskite structure: phase transition and energy transfer, J. Mater. Chem. C, 2018, 6, 13136–13147 RSC.
- T. Xie, Li Zhang, Y. Guo, X. Wang and Y. Wang, Tuning of Bi3+-related excitation and emission positions through crystal field modulation in the perovskite-structured La2(Znx,Mg1−x)TiO6 (0 ≤ x ≤ 1):Bi3+ solid solution for white LEDs, Ceram. Int., 2019, 45, 3502–3509 CrossRef CAS.
- B. P. Singh, S. Y. Lin, H. C. Wang, An C. Tang, H. C. Tong, C. Yi Chen, Yu C. Lee, T. L. Tsai and R. S. Liu, Inorganic red perovskite quantum dot integrated blue chip: a promising candidate for high color-rendering in w-LEDs, RSC Adv., 2016, 79410–79414 RSC.
- C. Duan, Y. Yu, J. Xiao, X. Zhang, L. Li, P. Yang, J. Wu and H. Xi, Water-based routes for synthesis of metal-organic frameworks: A review, Sci. China Mater., 2020, 63, 667 CrossRef.
- C. Duan, Y. Yu, J. Xiao, Y. Li, P. Yang, F. Hu and H. Xi, Recent advancements in metal-organic frameworks for green applications, Green Energy & Environment, 2020 DOI:10.1016/j.gee.2020.04.006.
- L. Jiang, L. Yan, Y. Liu, L. Tang, Z. Chen and D. Hong, Climatic and seasonal suitability of phase change materials coupled with night ventilation for office buildings in Western China, Renew. Energy, 2020, 147(1), 356–373 Search PubMed.
- W. Liu, J. Li, L. Ren, J. Xu, C. Li and S. Li, Exploring Livelihood Resilience and Its Impact on Livelihood Strategy in Rural China, Soc. Indicat. Res., 2020 DOI:10.1007/s11205-020-02347-2.
- D. L. Yuan, C. Zhang, S. F. Tang, M. T. Sun, Y. T. Zhang, Y. D. Rao, Z. B. Wang and J. Ke, Fe3+-sulfite complexation enhanced persulfate Fenton-like process for antibiotic degradation based on response surface optimization, Sci. Total Environ., 2020, 727, 138773 CrossRef CAS PubMed.
- S. F. Tang, Z. T. Wang, D. L. Yuan, C. Zhang, Y. D. Rao, Z. B. Wang and K. Yin, Ferrous ion-tartaric acid chelation promoted calcium peroxide fenton-like reactions for simulated organic wastewater treatment, J. Clean. Prod., 2020, 268, 122253 CrossRef CAS.
- S. F. Tang, J. C. Tang, D. L. Yuan, Z. T. Wang, Y. T. Zhang and Y. D. Rao, Elimination of humic acid in water: comparison of UV/PDS and UV/PMS, RSC Adv., 2020, 10, 17627–17634 RSC.
| This journal is © The Royal Society of Chemistry 2020 |

