 Open Access Article
Synthesis of narrow-band curled carbon nitride nanosheets with high specific surface area for hydrogen evolution from water splitting by low-temperature aqueous copolymerization to form copolymers†
Wenbo Liu,
Zhendong Zhang,
Deguang Zhang,
Runwei Wang ,
Zongtao Zhang
 * and
Shilun Qiu
State Key Laboratory of Inorganic Synthesis and Preparative Chemistry, College of Chemistry, Jilin University, Changchun 130012, China. E-mail: zzhang@jlu.edu.cn
First published on 4th August 2020
Abstract
Carbon nitride has become a focus of photocatalytic materials research in recent years, but the low specific surface area, the bad separation efficiency of photocarriers, poor quantum efficiency, terrible photocatalytic activity hinder the development of carbon nitride in the field of photocatalysis. The preparation of carbon nitride nanosheets is one of the effective methods to improve the photocatalytic efficiency of carbon nitride, but the traditional top-down stripping process is time-consuming, complicated and expensive. Here we report a simple, cheap, non-toxic and environmentally friendly bottom-up method to prepare a curled g-C3N4 nanosheet (NS-C3N4), which is performed at low temperature and normal pressure. In the aqueous solution, melamine and cyanuric acid are copolymerized to form a copolymer. Glycerol is inserted between the molecular layers of the prepolymer by thermal diffusion. Finally, high-quality and high-yield curled g-C3N4 nanosheets (NS-C3N4) are obtained by thermal peeling and polycondensation. The NS-C3N4 has an highly efficient photocatalytic hydrogen production of 4061.8 μmol h−1 g−1, and the hydrogen evolution activity is 37.5 times that of bulk-C3N4 (B-C3N4). The specific surface area of NS-C3N4 is 60.962 m2 g−1. UV-vis absorption spectra, steady-state and time-resolved photoluminescence, and photoelectrochemical tests were used to study its photocatalytic mechanism.
Introduction
With the depletion of fossil fuels and increasing environmental problems, the importance of clean energy has been gradually taken seriously.1 Hydrogen is considered an ideal candidate for fossil energy and the production of hydrogen by water splitting under sunlight irradiation is considered to be one of the effective methods to convert solar energy and hydrogen energy, among which semiconductor catalysts have become a hot spot of research.2–4 Graphitic carbon nitride is a promising semiconductor photocatalyst, which has attracted extensive attention due to its excellent chemical stability, suitable energy band structure and cheap and easy preparation of starting material.5–9 However, due to the high electrical resistivity, wide bandgap, fast charge carrier recombination and limited active sites provided by the low surface area of carbon nitride, its application in photocatalysis is greatly limited.10,11In the past decade, a large number of methods have been proposed to improve the photocatalytic activity of carbon nitride, such as the controlled synthesis of nanostructures,12,13 element doping,14,15 and the construction of heterojunctions.16,17 The contribution of the synthesis of nanostructures to the photocatalytic activity is mainly reflected in the preparation of structures with large specific surface area, thus providing more active sites. The appropriate band structure can enhance light absorption property and improve the catalytic ability.18 Increasing the specific surface area of the material to enhance the photocatalytic ability has been a hot spot in recent years. Inspired by the method of delaminating bulk graphene, people have explored many top-down methods of delaminating bulk carbon nitride.19,20 However, these methods are complicated, time-consuming and expensive, and the catalytic effect of the synthesized samples is often not as good as expected. In contrast, bottom-up synthesis of g-C3N4 nanosheets is rarely proposed, but it has shown great promise for 2D materials.21 Copolymerization is an effective means for synthesizing carbon nitride from the bottom up. It can be used to optimize the composition of carbon nitride and adjust band structure, improve the separation efficiency of photo-generated carriers, and ultimately improve the hydrogen production efficiency of the catalyst.22,23 However, the carbon nitride obtained by the copolymerization method often has a small specific surface area, cannot be well dispersed, and is easily agglomerated. This phenomenon also hinders the further development of carbon nitride as a photocatalyst.
Herein, we introduce a simple, inexpensive, low-temperature, atmospheric-pressure, non-toxic and environmentally friendly bottom-up method to prepare a curled g-C3N4 nanosheet (NS-C3N4). In this method, melamine and cyanuric acid are copolymerized in the water at a low temperature and normal pressure to form a prepolymer. Glycerol is inserted between the molecular layers of the prepolymer by thermal diffusion. Finally, we get high-quality, high-yield of NS-C3N4. The NS-C3N4 has a high specific surface area, hierarchical porous structure, excellent electrochemical and photoelectrochemical properties, and excellent photocatalytic hydrogen production performance.
Experimental sections
Materials
Melamine (C3H6N6, 99.0%) was purchased from Sinopharm Chemical Reagent Co., Ltd. Cyanuric acid (C3H3N3O3, 98%) was purchased from Energy Chemical. Ethanol (C2H6O) and glycerol (C3H8O3) were purchased from Beijing Chemical Works. Nafion D-520 was purchased from Alfa Aisha (China) Chemical Co., Ltd. All chemical reagents were analytical grade (AR) and were used without any further purification. The deionized water used throughout all experiments with a specific resistance of 18.2 MΩ cm was obtained by reverse osmosis followed by ion-exchange and filtration.Synthesis of copolymer
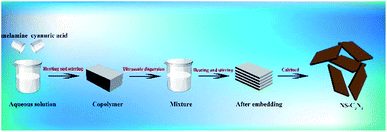
The scheme for synthesis of NS-C3N4 is as follows (Scheme 1): First, 0.5 g of melamine and 0.5 g of cyanuric acid were dispersed in 50 mL of deionized water, respectively, and then heated at 60 °C under continuous stirring to form a clear solution. Under continuous heating, the cyanuric acid solution was slowly added dropwise to the melamine solution and quickly copolymerized to form a white precipitate. The suspension was continuously stirred for 1 h. The product was then collected by centrifugation, washed repeatedly with deionized water and ethanol and dried under vacuum for 12 h to collect a white solid as a copolymer.Synthesis of NS-C3N4
Subsequently, the copolymer was grinded into a powder and ultrasonically dispersed in a mixed solution of 15 mL of glycerol and 45 mL of ethanol, and stirred at 90 °C for 3 h.21 The white solid was collected by centrifugation, washed several times with water and ethanol, and dried under vacuum overnight. Finally grind the white solid into powder and place it in a crucible with a lid. The crucible was heated in the air in a muffle furnace at 500 °C for 2 h. After leaving to cool to room temperature, a brown-yellow sample was collected was NS-C3N4.Synthesis of B-C3N4
B-C3N4 is made by simple thermal polycondensation, 2 g of melamine was placed in a crucible with a lid, then the crucible was heated in a muffle furnace at 500 °C for 2 h. After leaving to cool to room temperature, a yellow sample B-C3N4 was collected and grinded to a powder.Characterization
The crystalline structure of the sample was characterized by powder X-ray diffraction (XRD) with a Rigaku D/Max-2550 diffractometer using Cu Kα radiation (λ = 1.54056 Å) at 50 KV and 200 mA in the 2θ range of 10° to 80° at 7° min−1. X-ray photoelectron spectroscopy (XPS) measurement was conducted using a Thermo VG Scientific ESCALAB 250 spectrometer using monochromatized Al Kα excitation. The light absorption property of the samples was measured on a UV-vis-NIR spectrophotometer (Shimadzu UV-3600) in the range of 300–800 nm. Photoluminescence (PL) spectra with an excitation wavelength of 385 nm were recorded on a FLUOROMAX-4. Time-resolved photoluminescence (TRPL) decay spectra were measured on a FLS920 (Edinburgh Instrument). The morphologies of the samples were examined by scanning electron microscopy (SEM) using a JSM-6700F field emission scanning electron microscope. The transmission electron microscopy (TEM) and the high-resolution transmission electron microscopy (HRTEM) images were conducted on a Tecnai G2 S-Twin F20 TEM microscope (FEI Company).Photocatalytic hydrogen evolution from water splitting
The visible-light-driven photocatalytic hydrogen evolution experiments were performed with 10 mg of photocatalyst suspended in a 100 mL of solution containing 90 mL of H2O and 10 mL of TEOA in a quartz glass reaction cell at ambient temperature and atmospheric pressure. A 300 W Xe lamp with cooling water and an ultraviolet cut-off filter (λ > 400 nm) served as the simulated visible light source to trigger the photocatalytic reaction. Hydrogen gas production was analysed using an online gas chromatograph (GC-8A, Shimadzu Co., Japan, with N2 as the carrier gas) equipped with an MS-5A column and a thermal conductivity detector (TCD).The apparent quantum efficiency (AQE) was measured under the above experimental condition. The light densities of incident light were 2.95 mW cm−2, 5.32 mW cm−2, 7.36 mW cm−2, 8.63 mW cm−2 and 9.97 mW cm−2 for the 420 nm, 450 nm, 500 nm, 550 nm and 600 nm filters, respectively. The AQE under different wavelengths was calculated by eqn (1).
 | (1) |
Photoelectrochemical measurement
The electrochemical analysis was performed using an electrochemical analyser (CHI760E Instruments) with a standard three-electrode cell using the Ag/AgCl (saturated KCl), a Pt foil and prepared sample films as the reference electrode, counter electrode and working electrodes, respectively. The working electrodes were prepared as follows: At room temperature, 4 mg of the photocatalyst was uniformly dispersed in a mixed solution containing 300 μL of ethanol and 10 μL of naphthol to obtain the ink solution. Then, 30 μL of ink was dripped onto the FTO electrode. Next, the resulting electrodes were air dried and heated at 180 °C for 6 h in an oven before use. Electrochemical impedance spectroscopy (EIS) measurement was performed by applying a three-electrode system with an open-circuit potential in a 1 M KOH aqueous solution and applying an AC voltage of 5 mV amplitude in the frequency range of 0.1 Hz to 100 kHz. Mott–Schottky (M–S) measurements were performed in the above mentioned three electrode system and recorded over an AC frequency of 1 kHz in 0.5 M Na2SO4 aqueous solution. The transient photocurrents and I–t curves were obtained in the above mentioned three electrode system at 0 V vs. Ag/AgCl under simulated visible light irradiation provided by a 300 W Xe lamp with an ultraviolet cut-off filter (λ > 400 nm) and 0.5 M Na2SO4 aqueous solution was used as the electrolyte.Results and discussion
Fig. 1 shows the SEM and TEM images of the sample at different stages. It can be seen from the Fig. 1a that the polycondensation is small and the size is about 200–500 nm. After calcination, the polycondensation is thermally peeled and polycondensed to form a smaller and loosely curled carbon nitride sheet (NS-C3N4) in Fig. 1b. Fig. 1c and d further reveal the thin layer structure of NS-C3N4. It is well illustrated in the figures that the sample is well peeled into nanosheets and the looseness is good without obvious bulk samples. Fig. S1 and S2† are SEM and TEM images of B-C3N4, respectively. The figures illustrate the morphology and thickness of B-C3N4. B-C3N4 is highly agglomerated and has a very large size, so that its specific surface area is small and the electron–hole separation efficiency is not high. Fig S3† depicts the polycondensation product of a copolymer without glycerol intercalation. Fig S4† shows that NS-C3N4 has a rich hierarchical porous structure. The pore size of the macropores in the sample is mainly around 100 nm. In addition, some mesopores with a pore size of 5–20 nm are also distributed in the sample. There are obvious flaky formations compared with B-C3N4, but the separation between the layers is not sufficient. Combining the SEM and TEM images of Fig. 1 and S1–S3,† it can be shown that the structure of the copolymer can show a small layered structure after calcination, which has a higher degree of dispersion compared to B-C3N4. After intercalation treatment of ethanol and glycerol obtained NS-C3N4 with higher dispersion and larger specific surface area. Glycerol plays a very important role in generating curled carbon nitride nanosheets. Without glycerol, the relevant morphology will not be obtained. And its hydrogen production rate is not outstanding compared to NS-C3N4.21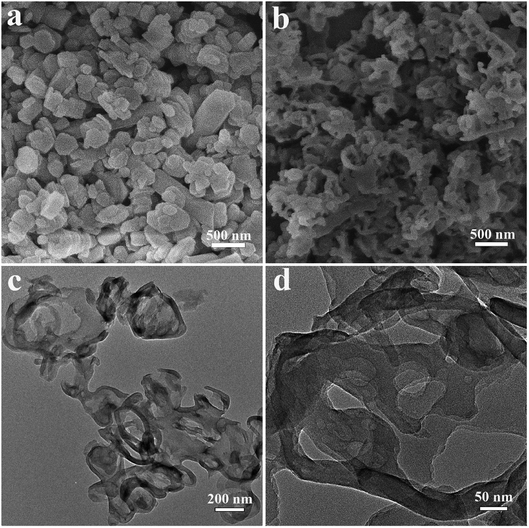 | ||
| Fig. 1 SEM image of (a) the NS-C3N4 copolymer, (b) the NS-C3N4, (c and d) TEM images of the NS-C3N4. | ||
As shown in Fig. 2a, XRD patterns of the NS-C3N4 have two consistent peaks with B-C3N4.This shows that they have the same crystal structure. The peak at 27.7° (002) plane is weaker and broader, suggesting that there are fewer layer structures in NS-C3N4. In Fig. S5,† the sample of copolymer after thermal polycondensation has broader peak at 27.7°, which indicates interlayer stacking between conjugated aromatic systems is reduced and the sample has a small amount of nanosheet structure. The peak at 13.1° (100) demonstrates the in-plane structural packing, the motif of peak becomes weaker in the NS-C3N4, implying it has a porous structure in the plane.24,25
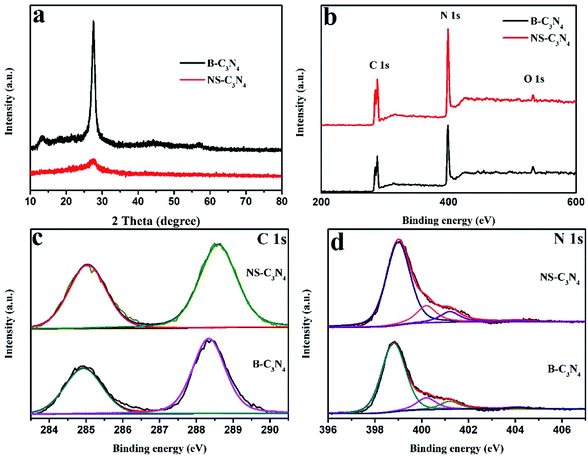 | ||
| Fig. 2 (a) XRD patterns of B-C3N4 and NS-C3N4, (b) XPS survey spectrum of B-C3N4 and NS-C3N4 samples, (c) C 1s, and (d) N 1s XPS spectra of B-C3N4 and NS-C3N4. | ||
In addition, XPS patterns of the obtained g-C3N4 samples were recorded. XPS survey spectra clearly stated that all samples contain three elements (C, N, O) and no other elements are detected. The possibility of a very small O 1s peak in the sample is due to the oxygen-containing species adsorbed on the surface (Fig. 2b). In the high-resolution spectra of C 1s (Fig. 2c), it can be observed that there are mainly two carbon atoms in the sample, one peak around 284.6 eV is related to sp2 C–C bonds, and the other peak around 288.1 eV is associated with sp2-hybridized carbon in N-containing aromatic ring (N–C![[double bond, length as m-dash]](https://www.rsc.org/images/entities/char_e001.gif) N).26,27 There are four parts in the high-resolution spectra of N 1s (Fig. 2d). The two main peaks around 398.6 eV and 400.1 eV are caused by the sp2-hybridized nitrogen in triazine rings (C–N
N).26,27 There are four parts in the high-resolution spectra of N 1s (Fig. 2d). The two main peaks around 398.6 eV and 400.1 eV are caused by the sp2-hybridized nitrogen in triazine rings (C–N![[double bond, length as m-dash]](https://www.rsc.org/images/entities/char_e001.gif) C) and the tertiary nitrogen N–(C)3 groups constitute heptazine heterocyclic ring respectively which is basic substructure units of g-C3N4.11,28,29 The peak (401.2 eV) is caused by amino functions (C–N–H) resulting from incomplete condensation of tris-s-triazine structures.30,31 Furthermore, the weakest peak of 404.2 eV may be caused by the charging effects or π-excitations in the heterocycles.32–35 According to the Table S2,† we can prove that glycerol does not cause the carbon content of the sample to change. In the Fig. S6,† the TG/DTA curves of copolymer without intercalation and copolymer after intercalation are almost coincident, they both show a dramatic weight loss in the range of 350 °C to 450 °C. This is due to the thermal polycondensation reaction of the copolymer. In this process, glycerol and ethanol will be released with a variety of gas. We can only find an endothermic peak on their DTA curve. Nonetheless, according to the TG curve, we found that the weight of the two samples is about 2% of their original weight at 500 °C. Therefore, we believe that calcination at 500 °C for 2 hours can completely remove traces of glycerol and ethanol.
C) and the tertiary nitrogen N–(C)3 groups constitute heptazine heterocyclic ring respectively which is basic substructure units of g-C3N4.11,28,29 The peak (401.2 eV) is caused by amino functions (C–N–H) resulting from incomplete condensation of tris-s-triazine structures.30,31 Furthermore, the weakest peak of 404.2 eV may be caused by the charging effects or π-excitations in the heterocycles.32–35 According to the Table S2,† we can prove that glycerol does not cause the carbon content of the sample to change. In the Fig. S6,† the TG/DTA curves of copolymer without intercalation and copolymer after intercalation are almost coincident, they both show a dramatic weight loss in the range of 350 °C to 450 °C. This is due to the thermal polycondensation reaction of the copolymer. In this process, glycerol and ethanol will be released with a variety of gas. We can only find an endothermic peak on their DTA curve. Nonetheless, according to the TG curve, we found that the weight of the two samples is about 2% of their original weight at 500 °C. Therefore, we believe that calcination at 500 °C for 2 hours can completely remove traces of glycerol and ethanol.
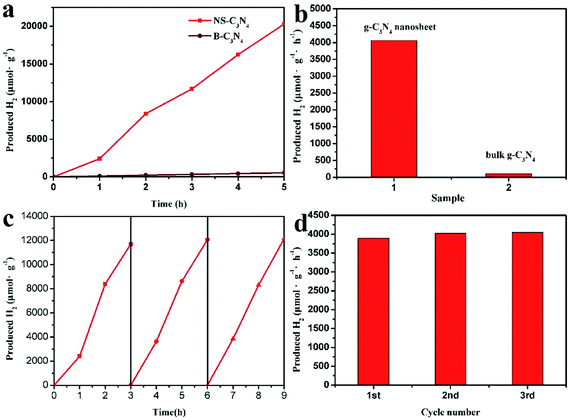
The photocatalytic activity of NS-C3N4 on hydrogen was examined by visible light irradiation. TEOA was used as the sacrificial electron donor and Pt was used as the co-catalyst. As presented in Fig. 3, the average hydrogen evolution rate of the B-C3N4 and NS-C3N4 achieved 108.2 μmol h−1 g−1 and 4061.8 μmol h−1 g−1 respectively, the hydrogen evolution efficiency of NS-C3N4 is almost 37.5 times that of B-C3N4. There is no significant attenuation of the NS-C3N4 during 9 h recycled HER experiment under visible light irradiation. In summary, NS-C3N4 has excellent photocatalytic activity and photostability.
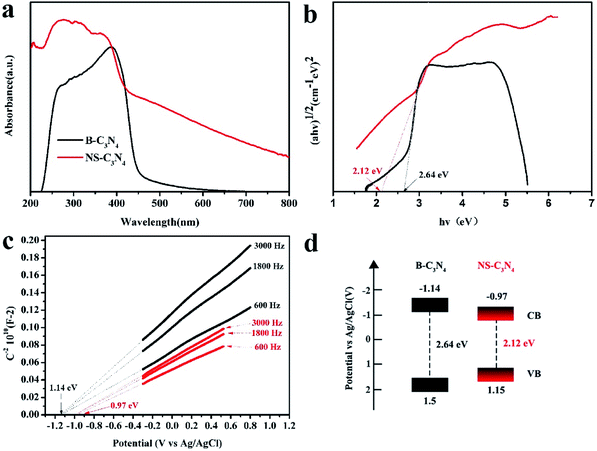
UV-vis absorption spectra (Fig. 4a) show that both NS-C3N4 and B-C3N4 absorb visible light. The red shift of the edge of the absorption band can be clearly observed for the NS-C3N4 sample, and according to transformed Kubelka–Munk function, the bandgaps of B-C3N4 (2.64 eV) and NS-C3N4 (2.12 eV) can be obtained (Fig. 4b). The change in the color of catalyst also implies a change in band gap. The darker color of NS-C3N4 indicated that its ability to absorb light is stronger than that of B-C3N4, and the absorption range is wider, which narrows the band gap.36–38 Moreover, the wavelength dependence of the AQE of NS-C3N4 is shown in Fig. S7.† The AQE gradually decreases with the increase of light wavelength, and the largest AQE value of NS-C3N4 is evaluated to be 3.22% at 420 nm. Furthermore, we noticed that the AQE value (0.07%) of NS-C3N4 is still observed even at 600 nm. This shows that NS-C3N4 can harvest more visible light photons, which is inseparable from the narrow band gap of NS-C3N4. The conduction band of B-C3N4 and NS-C3N4 were measured by the Mott–Schottky curve at 0.3, 1.8 and 3.0 kHz frequency. NS-C3N4 and B-C3N4 also exhibit the characteristics of n-type semiconductors because their Mott–Schottky curves have a positive slope (Fig. 4c). Since the conduction band potential of n-type semiconductors is generally considered to be approximately equal to the flat band potential,39,40 the conduction band potentials of B-C3N4 and N-C3N4 are approximately equal to the flat band positions derived from the intersection is ∼−1.14 eV and ∼−0.97 eV respectively. According to the energy band gap formula: ECB = EVB − Eg41 the potentials of the valence band of B-C3N4 and NS-C3N4 are calculated as 1.5 eV and 1.15 eV, respectively. This is consistent with the result of VB XPS spectra of B-C3N4 and NS-C3N4 (Fig. S8†). According to the above analysis, the band structure alignments of B-C3N4 and NS-C3N4 are described in Fig. 4d. The data of Fig. 4d is described in Table S3.†
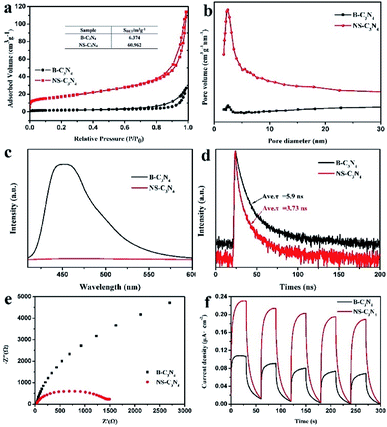
As shown in Fig. 5a, the N2 adsorption isotherm of NS-C3N4 shows a type IV curve with a typical H3 type hysteresis loop, indicating that it has a highly porous structure. The specific surface area (BET) of NS-C3N4 is 60.962 m2 g−1, which is about 10 times that of B-C3N4 (6.374 m2 g−1). In addition, it can be found from the pore size distribution curve (Fig. 5b) that NS-C3N4 has a rich porous structure. The high specific surface area of NS-C3N4 comes from its highly hierarchical porous structure, which provides it with a wealth of active sites to participate in the reaction and effectively reduces the recombination of electrons and holes.
Steady-state and time-resolved photoluminescence (PL) spectroscopy were used to study the photophysical properties of photogenic electron holes. The PL intensity of NS-C3N4 decreased sharply compared with that of B-C3N4 (Fig. 5c), which means that the electron–hole recombination rate of NS-C3N4 can be effectively prevented. In addition, the PL emission peak of NS-C3N4 relative to B-C3N4 was observed to red shift from 452 nm to 468 nm, which was quite consistent with the change of band gap decrease of NS-C3N4. Measurements of time-resolved fluorescence spectra (Fig. 5d) are used to account for the lifetime of charge carriers. When the sample is copolymerized in solvents, the fluorescence lifetime of the sample decreased from B-C3N4 (5.9 ns) to NS-C3N4 (3.73 ns). It is believed that in a new non-radiative pathway, charge transfer is active in the nanosecond range while enhancing photostability and photocatalytic activity.42 The fluorescence lifetime of NS-C3N4, which has high photocatalytic hydrogen production activity, is smaller. This result strongly illustrates that the formation of a new path of charge transfer can enhance the photocatalytic hydrogen production activity.
In order to gain a deeper understanding of charge transfer efficiency, the electrochemical impedance and transient photocurrent response of NS-C3N4 and B-C3N4 were measured simultaneously. In electrochemical impedance (EIS) measurements (Fig. 5e), the arc radius of NS-C3N4 was much smaller than that of B-C3N4, indicating that it demonstrated the fastest electron transfer and the most efficient carrier separation. As can be seen from Fig. 5f, both samples showed stable and fast photocurrent response, and the photocurrent response of NS-C3N4 was higher than that of B-C3N4, which also proved that the transfer and separation of charge carriers were greatly enhanced.
The reaction mechanism of photocatalytic water splitting by NS-C3N4 is shown in Fig. 6. Under visible light, the energy of NS-C3N4 to absorb photons is higher than its inherent band gap. Therefore, electrons can be excited and transferred from the valence band to the conduction band, while the positive holes remain in the valence band. The excited electrons migrate to the Pt nanoparticles on the surface of the sample to reduce H2O/H to H2 molecules, and the photogenerated holes are consumed by TEOA in the entrainment.
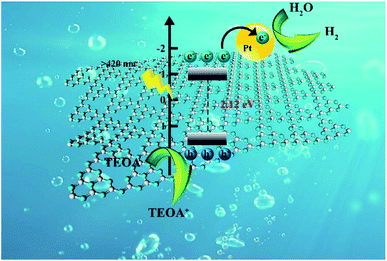 | ||
| Fig. 6 Schematic illustration of photocatalytic mechanism for NS-C3N4 sample under visible light irradiation. | ||
The mechanism of the enhanced photocatalytic activity for NS-C3N4 can be attributed to the following reasons: (1) since the band gap of NS-C3N4 is small, the energy required for electron excited transfer is less than that of the sample with large band gap. Therefore, under the same visible light intensity, NS-C3N4 can be excited more electrons to participate in the photocatalytic reaction to produce more hydrogen. (2) The large specific surface area of NS-C3N4 stripped by glycerol can provide a large number of reactive sites for photocatalytic reactions, improve the separation efficiency of electrons and holes, and thus improve photocatalytic activity.
Conclusions
In conclusion, our study proposed a bottom-up strategy for preparing carbon nitride nanosheets with high specific surface area at low temperature and atmospheric pressure. Carbon nitride was stripped into a thin sheet by embedding glycerol in an intermediate layer of a pre-assembled precursor of cyanuric acid and melamine, and vaporizing glycerol by calcination. High specific surface area and a rich hierarchical porous structure can provide sufficient active sites, which makes NS-C3N4 show super high hydrogen production activity. The hydrogen evolution reaction mechanism of materials and the transfer and separation of charge carriers have been reasonably verified through electrochemical and photoelectrochemical characterization. This work provides further information for the fields of photocatalysis, electrocatalysis, and photocatalytic hydrogen evolution from carbon nitride.Conflicts of interest
The authors declare no competing financial interest.Acknowledgements
This work was financially supported by the National Natural Science Foundation of China (21771081, 21390394), the Chang Bai Mountain Scholars Program (2014004), and Jilin Scientific and Technological Development Program (20180101001JC).References
- J. Yi, W. El-Alami, Y. Song, H. Li, P. M. Ajayan and H. Xu, Chem. Eng. J., 2019, 122812 Search PubMed.
- J. Huang, W. Ho and X. Wang, Chem. Commun., 2014, 50, 4338–4340 RSC.
- P. Wang, T. Wu, C. Wang, J. Hou, J. Qian and Y. Ao, ACS Sustainable Chem. Eng., 2017, 5, 7670–7677 CrossRef CAS.
- T. Wang, C. Nie, Z. Ao, S. Wang and T. An, J. Mater. Chem. A, 2020, 8, 485–502 RSC.
- X. Wang, K. Maeda, A. Thomas, K. Takanabe, G. Xin, J. M. Carlsson, K. Domen and M. Antonietti, Nat. Mater., 2009, 8, 76 CrossRef CAS PubMed.
- Y. Wang, J. Zhang, X. Wang, M. Antonietti and H. Li, Angew. Chem., Int. Ed., 2010, 49, 3356–3359 CrossRef CAS PubMed.
- G. Dong and L. Zhang, J. Mater. Chem., 2012, 22, 1160–1166 RSC.
- X. Chen, J. Zhang, X. Fu, M. Antonietti and X. Wang, J. Am. Chem. Soc., 2009, 131, 11658–11659 CrossRef CAS PubMed.
- X. Zhang, X. Xie, H. Wang, J. Zhang, B. Pan and Y. Xie, J. Am. Chem. Soc., 2012, 135, 18–21 CrossRef PubMed.
- J. Ran, T. Y. Ma, G. Gao, X.-W. Du and S. Z. Qiao, Energy Environ. Sci., 2015, 8, 3708–3717 RSC.
- J. Zhang, X. Chen, K. Takanabe, K. Maeda, K. Domen, J. D. Epping, X. Fu, M. Antonietti and X. Wang, Angew. Chem., Int. Ed., 2010, 49, 441–444 CrossRef CAS PubMed.
- G. Zhou, Y. Shan, Y. Hu, X. Xu, L. Long, J. Zhang, J. Dai, J. Guo, J. Shen and S. Li, Nat. Commun., 2018, 9, 3366 CrossRef PubMed.
- Z. Tong, D. Yang, Z. Li, Y. Nan, F. Ding, Y. Shen and Z. Jiang, ACS Nano, 2017, 11, 1103–1112 CrossRef CAS.
- Q. Liu, J. Shen, X. Yu, X. Yang, W. Liu, J. Yang, H. Tang, H. Xu, H. Li, Y. Li and J. Xu, Appl. Catal., B, 2019, 248, 84–94 CrossRef CAS.
- Y. Li, Z. Ruan, Y. He, J. Li, K. Li, Y. Yang, D. Xia, K. Lin and Y. Yuan, Int. J. Hydrogen Energy, 2019, 44, 707–719 CrossRef CAS.
- M. Zhu, S. Kim, L. Mao, M. Fujitsuka, J. Zhang, X. Wang and T. Majima, J. Am. Chem. Soc., 2017, 139, 13234–13242 CrossRef CAS PubMed.
- J. Liu, Y. Liu, N. Liu, Y. Han, X. Zhang, H. Huang, Y. Lifshitz, S.-T. Lee, J. Zhong and Z. Kang, Science, 2015, 347, 970–974 CrossRef CAS PubMed.
- Y. Liu, X. Zhang, J. Wang and P. Yang, Phys. Chem. Chem. Phys., 2016, 18, 31513–31520 RSC.
- Q. Han, B. Wang, J. Gao, Z. Cheng, Y. Zhao, Z. Zhang and L. Qu, ACS Nano, 2016, 10, 2745–2751 CrossRef CAS PubMed.
- G. Liu, T. Wang, H. Zhang, X. Meng, D. Hao, K. Chang, P. Li, T. Kako and J. Ye, Angew. Chem., Int. Ed., 2015, 54, 13561–13565 CrossRef CAS PubMed.
- Y. Xiao, G. Tian, W. Li, Y. Xie, B. Jiang, C. Tian, D. Zhao and H. Fu, J. Am. Chem. Soc., 2019, 141, 2508–2515 CrossRef CAS PubMed.
- J. Sun, J. Xu, A. Grafmueller, X. Huang, C. Liedel, G. Algara-Siller, M. Willinger, C. Yang, Y. Fu, X. Wang and M. Shalom, Appl. Catal., B, 2017, 205, 1–10 CrossRef CAS.
- L. Tian, X. Xian, X. Cui, H. Tang and X. Yang, Appl. Surf. Sci., 2018, 430, 301–308 CrossRef CAS.
- Y. Wang, L. Li, Y. Wei, J. Xue, H. Chen, L. Ding, J. Caro and H. Wang, Angew. Chem., Int. Ed., 2017, 56, 8974–8980 CrossRef CAS PubMed.
- Y. Kang, Y. Yang, L. C. Yin, X. Kang, G. Liu and H. M. Cheng, Adv. Mater., 2015, 27, 4572–4577 CrossRef CAS PubMed.
- X. Bai, L. Wang, R. Zong and Y. Zhu, J. Phys. Chem. C, 2013, 117, 9952–9961 CrossRef CAS.
- K. Chen, X.-M. Zhang, X.-F. Yang, M.-G. Jiao, Z. Zhou, M.-H. Zhang, D.-H. Wang and X.-H. Bu, Appl. Catal., B, 2018, 238, 263–273 CrossRef CAS.
- X. Yang, H. Tang, J. Xu, M. Antonietti and M. Shalom, ChemSusChem, 2015, 8, 1350–1358 CrossRef CAS PubMed.
- G. Zhang, J. Zhang, M. Zhang and X. Wang, J. Mater. Chem., 2012, 22, 8083–8091 RSC.
- Y. Cui, Z. Ding, X. Fu and X. Wang, Angew. Chem., Int. Ed., 2012, 51, 11814–11818 CrossRef CAS PubMed.
- B. Luo, R. Song and D. Jing, Chem. Eng. J., 2018, 332, 499–507 CrossRef CAS.
- M. Yan, Y. Hua, F. Zhu, L. Sun, W. Gu and W. Shi, Appl. Catal., B, 2017, 206, 531–537 CrossRef CAS.
- Y. Di, X. Wang, A. Thomas and M. Antonietti, ChemCatChem, 2010, 2, 834–838 CrossRef CAS.
- X. Wang, S. Blechert and M. Antonietti, ACS Catal., 2012, 2, 1596–1606 CrossRef CAS.
- Q. Liu, X. Wang, Q. Yang, Z. Zhang and X. Fang, Appl. Catal., B, 2018, 225, 22–29 CrossRef CAS.
- Y. X. Wang, H. Wang, F. Y. Chen, F. Cao, X. H. Zhao, S. G. Meng and Y. J. Cui, Appl. Catal., B, 2017, 206, 417–425 CrossRef CAS.
- T. Xiong, W. L. Cen, Y. X. Zhang and F. Dong, ACS Catal., 2016, 6, 2462–2472 CrossRef CAS.
- Y. B. Li, H. M. Zhang, P. R. Liu, D. Wang, Y. Li and H. J. Zhao, Small, 2013, 9, 3336–3344 CAS.
- T. W. Kim and K.-S. Choi, Science, 2014, 343, 990–994 CrossRef CAS PubMed.
- Y. Wang, Z. Zhang, L. Zhang, Z. Luo, J. Shen, H. Lin, J. Long, J. C. Wu, X. Fu and X. Wang, J. Am. Chem. Soc., 2018, 140, 14595–14598 CrossRef CAS PubMed.
- L. Liu, X. Luo, Y. Li, F. Xu, Z. Gao, X. Zhang, Y. Song, H. Xu and H. Li, Colloids Surf., A, 2018, 537, 516–523 CrossRef CAS.
- Y. Jiang, F. Qu, L. Tian, X. Yang, Z. Zou and Z. Lin, Appl. Surf. Sci., 2019, 487, 59–67 CrossRef CAS.
Footnote |
| † Electronic supplementary information (ESI) available. See DOI: 10.1039/d0ra03802d |
| This journal is © The Royal Society of Chemistry 2020 |

