 Open Access Article
Enhanced carbon and nitrogen removal in an integrated anaerobic/anoxic/aerobic-membrane aerated biofilm reactor system
Zhiye Sunabcde,
Mei Lif,
Guofeng Wangg,
Xiaojun Yang,
Yi Liabcde,
Meichao Lanabcde,
Rukang Liuabcde and
Baoan Li *abcde
aChemical Engineering Research Center, School of Chemical Engineering and Technology, Tianjin University, Tianjin 300072, PR China. E-mail: libaoan@tju.edu.cn
bState Key Laboratory of Chemical Engineering, Tianjin University, Tianjin 300072, PR China
cTianjin Key Laboratory of Membrane Science and Desalination Technology, Tianjin University, Tianjin 300072, PR China
dTianjin Collaborative Innovation Center of Chemical Science and Engineering, Tianjin 300072, PR China
eQingdao Institute for Ocean Engineering of Tianjin University, Qingdao 266200, PR China
fCollege of Fisheries, Henan Normal University, Xinxiang 453007, PR China
gHydroking Sci & Tech, Ltd., Tianjin300384, PR China
First published on 4th August 2020
Abstract
A pilot-scale anaerobic/anoxic/aerobic-membrane aerated biofilm reactor (A2/O-MABR) system was constructed to enhance carbon and nitrogen removal. The effects of major operating parameters including the nitrate recycling ratio (R), sludge recycling ratio (r), and aerobic tank dissolved oxygen (DO) concentration on the system performance were investigated. The average removal efficiencies of the chemical oxygen demand (COD), ammonium nitrogen (NH4+-N), and total nitrogen (TN) were 89.0 ± 3.2%, 98.8 ± 1.3%, and 68.5 ± 4.2%, respectively, and their effluent concentrations were averagely 22.6 ± 7.3, 0.32 ± 0.2, and 13.3 ± 1.2 mg L−1. The suspended sludge and biofilm in aerobic tank facilitated the simultaneous nitrification and denitrification (SND) processes. Indeed, unique biofilm layered structure and abundant microbial community in the biofilm on MABR would enhance nitrogen removal. Compared with the A2/O system, the A2/O-MABR system exhibited higher nitrifying bacteria oxygen uptake rate (OUR) of 58.1 and 54.5 mgO2 per gMLSS per h in suspended sludge and biofilm, respectively, and the lower mixed liquor suspended solid (MLSS) concentration of 1800 mg L−1. Moreover, high-throughput sequencing indicated that putative nitrogen removal bacteria such as Thauera and Paracoccus could be effectively enriched in the biofilm. Since the volume proportions of the anaerobic, anoxic, aerobic and settling tank in the existing A2/O system of the WWTP was not changed, the A2/O-MABR system was simple and practical for the upgrading of A2/O system.
1. Introduction
With rapid economic development and urbanization, large amounts of domestic and industrial wastewater are increasingly produced and discharged into natural water systems without sufficient treatment. Nearly 12–30% of the nitrogen contaminants in rivers around the world originate from the effluent of WWTP, which is the main source of anthropogenic nitrogen.1 Yang et al.2 reported that the discharge of nitrogen contaminants in the effluent of WWTP alters the structure and function of the aquatic communities such as microbes, algae, aquatic higher plants, various invertebrates and vertebrates, and ultimately harms human health through the transmission of the food chain. Therefore, it is essential to develop economic and sustainable technologies for existing WWTP, and to further enhance nitrogen removal.Conventionally, the biological nutrient removal (BNR) system exhibits high-efficiency and relatively low cost when compared with physio-chemical methods, including the SBR system, the A2/O system, the University of Cape Town (UCT) system,3 and the five-stage Bardenpho system.4 Due to its cost-effectiveness and high efficiency, the A2/O system is widely used in most WWTPs.5 A number of studies have been performed to demonstrate the effect of operating parameters on carbon and nitrogen removal efficiency, including the reflux ratio, influent carbon/nitrogen (C/N) ratio, salinity, step-feed and aeration rate.6–8 However, there are some challenges associated with the single-sludge A2/O system during the practical operation. The differences in the proliferation rates of nitrifying bacteria, denitrifying bacteria and heterotrophic bacteria reduce the efficient removal of COD and nitrogen.9 The high sludge concentration should be generally maintained to achieve a excellent contaminant removal efficiency,10 this increases the cost of subsequent sludge disposal. Moreover, external carbon sources such as acetate and ethanol are usually added to treat low C/N ratio wastewater for promote the denitrification yield, which would increase the operation cost and sludge production.11
Recently, a dual sludge system combining biofilm and activated sludge was introduced, including the anaerobic/anoxic/aerobic-moving bed biofilm reactor (A2/O-MBBR), anaerobic/anoxic/aerobic-biological aerated filter (A2/O-BAF), and anaerobic/anoxic/aerobic-biological contact oxidation (A2/O-BCO) systems, to improve the contaminant removal performance.12–14 The improved dual sludge system achieved better contaminant removal performance over that of the traditional single sludge A2/O system. However, most of these experiments were performed on the lab scale, and the system was greatly modified based on the original A2/O system. These dual sludge systems need to redistribute the volume proportions of anaerobic, anoxic, and aerobic tanks in A2/O system that had been constructed in the WWTP. These requirements limit the application for upgrading the existent A2/O system in WWTPs.
Integrated with the gas permeable membrane and biofilm technology, membrane aerated biofilm reactor (MABR) is a promising technology in the field of wastewater treatment.15 Differing from the conventional membrane bioreactors, a unique biofilm layered structure is formed on the hollow fiber membrane due to the counter-diffusion of oxygen and soluble contaminants.16 The simultaneous nitrification and denitrification (SND) processes are achieved in MABR system, which enhances the removal of the TN in wastewater with low C/N ratios. Lin et al.17 reported MABR for nitrogen removal from the low C/N domestic wastewater. The results indicated that SND process was realized in the MABR system, and the nitrogen removal performances were affected by the influent NH4+-N concentration. The limitation of influent NH4+-N concentration for this MABR system was 70 mg L−1 with a maximum specific NH4+-N conversion rate and specific total nitrogen removal rate of 55.67 and 52.87 kg m−3 d−1, showing better performances compared with other studies. The bubbleless aeration process greatly improves the oxygen utilization efficiency and suppresses the emission of volatile contaminants.18 MABR has been extensively applied in the field of wastewater treatment, including urban river remediation, high-strength nitrogen swine wastewater, pharmaceutical wastewater, and coal chemical reverse osmosis concentrate.19–22 Moreover, studies have shown that the hybrid MABR-activated sludge process can achieve 100% denitrification rate when BOD/N ratios was 12.5, which confirms the feasibility of the hybrid MABR activated sludge system in municipal wastewater treatment.23
In this experiment, a pilot-scale A2/O-MABR system was designed to enhance the carbon and nitrogen removal in WWTP. The volume proportions of the anaerobic, anoxic, aerobic and settling tank in the A2/O-MABR system was same as the existing A2/O system in the WWTP. The MABR membrane module was placed directly in the aerobic tank to form a A2/O-MABR dual sludge system. The operation parameters, including nitrate recycling ratio (R), sludge recycling ratio (r), and aerobic tank dissolved oxygen (DO) were optimized and determined by analyzing the removal performance of the COD and nitrogen, as well as the energy consumption. Subsequently, the 120 day continuous operation was conducted based on the optimal operation parameters to evaluate the stability of contaminants effluent concentration and removal efficiency. Batch experiments was conducted to determine the oxygen uptake rate (OUR) of microorganism. In order to investigate the practicability of the A2/O-MABR system, compared the A2/O-MABR system contaminants removal efficiency, effluent concentration and operating parameters (R, r, DO) related to energy consumption with the A2/O system. Moreover, microbial communities in the A2/O-MABR and A2/O system were also analyzed by the high-throughput sequencing technology to investigate the relationship between contaminants removal and microbial communities.
2. Materials and methods
2.1 Structure of the A2/O-MABR system
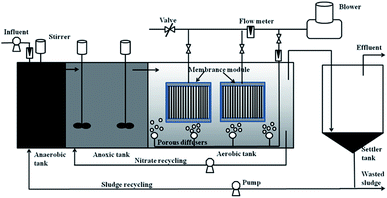
As shown in Fig. 1, the structure of the pilot-scale A2/O-MABR system is composed of four distinct tanks, including the anaerobic, anoxic, oxic, and settling tank, and the volumes of that are 1.5, 4.35, 17.55, and 3.3 m3, respectively. The wastewater from the WWTP primary settler tank was pumped into the anaerobic tank and overflowed to the anoxic tank, successively, where the hydraulic mixing of wastewater and sludge was sufficiently achieved by the overhead mechanical stirrers. Inside the aerobic tank, two membrane module units were placed and porous diffusers were installed at the bottom of the tank, both of which were utilized to aerate via the roots blower. Furthermore, the A2/O-MABR system was equipped with a nitrate recycle and sludge recycle system to enhance the contaminant removal by circulating nitrate from aerobic to anoxic as well as sludge from settling to anaerobic.The seed sludge used in the A2/O-MABR system was obtained from the excess sludge at the Qingdao Daren Water West Wastewater Treatment Plant (Qingdao, China). The MLSS concentration in its aerobic tank was 6000 mg L−1. The sludge retention time (SRT) in WWTP system was 12 days. The influent wastewater was obtained from the WWTP primary sedimentation tank with the main characteristics presented in Table 1.
| Parameter | Range | Value (mean ± standard deviation) |
|---|---|---|
| T/(°C) | 12–28 | 18.7 ± 3.4 |
| pH | 7.2–7.6 | 7.4 ± 0.2 |
| COD/(mg L−1) | 65.8–642.3 | 287.6 ± 136.8 |
| NH4+-N/(mg L−1) | 6.4–52.7 | 34.6 ± 10.3 |
| TN/(mg L−1) | 16.5–120 | 56.3 ± 17.8 |
| TP/(mg L−1) | 2.1–18.3 | 6.3 ± 2.1 |
| NO2−-N/(mg L−1) | 0.01–0.07 | 0.034 ± 0.01 |
| NO3−-N/(mg L−1) | 0.1–5.2 | 2.3 ± 1.8 |
| SS/(mg L−1) | 36–1030 | 563 ± 168 |
The system achieved steady state after 30 days of culturing and acclimation. During the experiment, the influent flow was 1.5 m3 h−1, and the hydraulic retention times (HRT) in the four reactor tanks were 1.0, 2.9, 11.7, and 2.2 h. The SRT in the system was 15 days. During the experiment, the DO concentration of the anaerobic and anoxic tanks were kept below 0.2 mg L−1 and 0.5 mg L−1, respectively. The gas flow rate was adjusted according to the change of DO in the aerobic tank, in which the flow rate of the bottom microporous diffuser and the flow rate of the hollow fiber membrane were 2 to 1. The air diffuser had two main functions: on the one hand, it maintained the DO in the aerobic tank. Because in the coupling system of biofilm and activated sludge, when the concentration of organic matter in the influent was high, it was difficult to maintain aerobic tank sufficient dissolved oxygen concentration by membrane aeration alone.22 On the other hand, the diffuser at the bottom of the membrane module could flush the membrane surface during aeration to maintain thin biofilm and enhanced the mass transfer rate. The existing A2/O system of the WWTP was the control group for the A2/O-MABR system. The treatment capacity of the A2/O system was 20![[thin space (1/6-em)]](https://www.rsc.org/images/entities/char_2009.gif) 000 m3 d−1, and the SRT and HRT are 20 d and 17.2 h, respectively. After the effluent from the secondary sedimentation tank of the A2/O system of the WWTP, chemical phosphorus removal was used, and carbon and nitrogen were mainly removed in the biochemical treatment stage. Therefore, the A2/O-MABR system also mainly considers the removal of carbon and nitrogen.
000 m3 d−1, and the SRT and HRT are 20 d and 17.2 h, respectively. After the effluent from the secondary sedimentation tank of the A2/O system of the WWTP, chemical phosphorus removal was used, and carbon and nitrogen were mainly removed in the biochemical treatment stage. Therefore, the A2/O-MABR system also mainly considers the removal of carbon and nitrogen.
2.2 Membrane module unit
The main technical parameters of the hollow fiber and the membrane module are detailed in Table 2. The membrane material used in this experiment was a modified polymer composite specified for MABR engineering application and obtained from Hydroking Sci & Tech, Ltd. (Tianjin, China). Eight hundred hollow fiber ends were sealed with epoxy resin on the plastic shell to form a membrane module. Subsequently, 32 membrane modules were divided into eight rows and four columns, after which they were assembled inside a stainless steel stent to form the membrane module unit. The membrane module unit dimension is 1.5 m × 1.2 m × 1.6 m. Two membrane module units were placed in the aerobic tank.| Value | |
|---|---|
| Hollow fiber | |
| Outer diameter (μm) | 750 |
| Wall thickness (μm) | 80 |
| Hollow fiber number (amount) | 800 |
| Effective length (m) | 1.5 |
![[thin space (1/6-em)]](https://www.rsc.org/images/entities/char_2009.gif) |
|
| Membrane module | |
| Module number (amount) | 64 |
| Total surface area (m2) | 112 |
2.3 Optimization of operation parameters
R, r, and DO are very important operation parameters in A2/O system. Chen et al.24 reported that increasing the R from 100% to 400% decreased the nitrate effluent content and improved the nitrogen removal efficiency of the system. Li et al.25 indicated that the contaminants removal efficiency of the system reached the best level at r of 75%. During the A2/O process, insufficient DO concentration leads to incomplete nitrification, resulting in reduced TN removal performance. However, the over aeration of the aerobic tank increased the oxygen content in the nitrate reflux, which inhibited the denitrification process in the anoxic tank.26According to the above literature reports and the actual situation and purpose of the A2/O-MABR reactor, as well as the operating parameters of the on-site A2/O system (R = 300%, r = 100%, DO = 2–4 mg L−1), in this experiment, R was regulated from 100% to 400% with a fixed r of 75% and aerobic tank DO of 1.5 mg L−1 to determine the changing tendency of the systematic performance. The optimization of the sludge recycling system was investigated under the optimal R value by regulating r from 60% to 105% at a fixed DO content of 1.5 mg L−1. Finally, the effect of the aerobic tank DO on the contaminant removal performance was investigated under optimal R and r values by varying the concentration from 0.5 to 3.5 mg L−1. The experiment of the effect of each process parameter on the removal of contaminants was run for 40 days.
2.4 Analysis methods
COD, NH4+-N, TN, NO3−-N and NO2−-N were detected by spectrophotometry using a Multiparameter Bench Photometer (DR3900 and DRB200, Hach Instruments Inc, USA). The DO concentration were monitored using a DO electrode (JPB-607A, Shanghai Precision & Scientific Instrument Co. Ltd., China). The pH was measured using a pH electrode (PHB-4, Shanghai Precision & Scientific Instrument Co. Ltd., China). The measurement of MLSS and sludge volume index (SVI) followed the method.272.5 Batch experiment for evaluating microbial oxygen uptake rate (OUR)
After the A2/O-MABR system was continuously operated for 120 days with the optimal parameters, active sludge and biofilm samples were taken from A2/O-MABR and A2/O system for OUR testing and high-throughput sequencing analysis. Used a 500 mL measuring cylinder to take suspended sludge in the aerobic tank of A2/O-MABR system and A2/O system respectively. Lifted the MABR membrane module with a crane, and took the biofilm from the surface of the MABR membrane with a razor blade. The suspend sludge and biofilm samples were taken out and immediately transferred to a sealed flask that was fully aerated and saturated with oxygen, after adding substrate and stirred with a magnetic stirrer. A DO electrode was inserted into the flask that was sealed with a silicone plug to prevent oxygen transfer. The DO concentration in the flask was recorded in real-time by the DO electrode as a function of time. The MLSS concentration in the flask was recorded at certain time intervals. The OUR was measured following the method in ref. 28. The OUR of ammonium oxidizing bacteria (AOB) was calculated using NH4Cl as the ammonia nitrogen source with an NH4+-N concentration of 50 mg L−1. The OUR of the nitrite oxidizing bacteria (NOB) was calculated using NaNO2 as the nitrite nitrogen source with a NO2−-N concentration of 50 mg L−1. The OUR of the heterotrophic bacteria (HOB) was calculated using C6H12O6 as the carbon source with a COD concentration of 300 mg L−1. The OUR of bacteria can be calculated by the following equation:| OUR = (C0 − Ct)/(t × MLSS) | (1) |
2.6 Microbial community analysis
The collected suspended sludge and attached biofilm samples were obtained from the A2/O, and the A2/O-MABR systems were used during a stable operation to study the relationship between the microbial communities and contaminant removal. The attached biofilm in aerobic tank of the A2/O-MABR system, the suspended sludge in aerobic tank for A2/O process of the WWTP system, and the suspended sludge in aerobic tank of the A2/O-MABR system were labeled as A1, B1, and C1, respectively. DNA was extracted using the Fecal/Soil Microbe DNA Miniprep Kit (Tianmo SCI & TECH, CHINA), the quantity and quality after DNA extraction was determined using the QuantiFluor™-ST Blue fluorescence quantitative system (Promega, USA). The extracted DNA was quantified and then amplified with 338F primer (ACTCCTACGGGAGGCAGCAG) and 806R primer (GGACTACHVGGGTWTCTAAT) targeting the V3–V4 region of the 16S rRNA gene. The PCR was performed at 94 °C for 5 min, 5 cycles of 94 °C for 30 s, 55 °C for 30 s, 72 °C for 60 s, and 72 °C for 7 min, then a final extension at 4 °C to end. The purified PCR products were sequenced on the Miseq sequencing platform by Tianmo Biotech Co., Ltd. (Beijing, China). Miseq library was built and Miseq sequencing was conducted. The analytic platform and software used were QIIME (V1.8), UCLUST (Version1.2.22), and USEARCH (Version8.1.1861). The detailed high-throughput sequencing procedures can be found in ref. 20.3. Results and discussion
3.1 Effect of R on COD and nitrogen removal
As shown in Fig. 2A, the COD removal efficiency varied between 90.4% and 91.7% as R ranged from 100% to 400%. COD concentration significantly decreased in the anaerobic and anoxic tanks, while it decreased slightly in the aerobic tank. When R increased from 100% to 300%, the COD effluent concentration in the anoxic tank decreased from 56.6 to 36.3 mg L−1, indicating that the amount of the COD utilized in the denitrification process increased as R increased. However, when R increased from 300% to 400%, the COD effluent concentration in the anoxic tank increased to 47.8 mg L−1. This might be due to the increase in the content of refractory organics in the COD component of the influent. Several studies have reported that the COD is mainly utilized by the polyphosphate accumulating organisms (PAOs) in the anaerobic tank of the A2/O system.29 In our experiment, the concentration of phosphate in the anaerobic tank was not high, which was equivalent to the phosphorus concentration in the influent, between 2.6 mg L−1 and 7.3 mg L−1 (data unshown), suggesting that the COD was not utilized by the PAOs. The recycled sludge from the settler tank contained a large amount of nitrate, which aided the heterotrophic denitrifiers to outcompete the PAOs for organic matter.30 The heterotrophic denitrifiers preferentially utilized organic matter as the electron donor for the denitrification of nitrate.31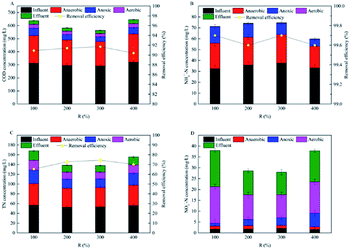 | ||
| Fig. 2 Evolution of COD and nitrogen in A2/O-MABR system at various R. (A) COD; (B) NH4+-N; (C) TN; (D) NO3−-N. | ||
When R increased from 100% to 400%, NH4+-N removal efficiency was always maintained above 99% (Fig. 2B). The concentration of NH4+-N in the anaerobic tank and the anoxic tank was decreased due to the dilution of the recycled sludge (r = 75%) and recycled nitrate mixed liquor. In the subsequent aerobic tank, NH4+-N concentration decreased significantly, and NH4+-N effluent concentration was almost 0, indicating that the A2/O-MABR system exhibited a good nitrification performance. This is because the content of nitrifying bacteria in the A2/O-MABR system was very high, in addition to the nitrifying bacteria in the suspended sludge, a part of the nitrifying bacteria were attached to the MABR membrane (Fig. 6 and 7).
As shown in Fig. 2C, TN removal efficiency improved from 65.4% to 74.4% as R increased from 100% to 300%, but decreased to 70.2% as R further increased to 400%. The TN concentration decreased significantly in the anaerobic tank and anoxic tank due to the reduction of NO3−-N from the recycled sludge, and the recycled nitrate mixed liquor serving as an electron acceptor during the denitrification process. The effluent TN concentration in the anoxic tank decreased from 27.5 to 17.8 mg L−1 as R increased from 100% to 300%, indicating that the increased NO3−-N load supplied to the anoxic tank improved the denitrification rate. However, when R further increased from 300% to 400%, the effluent TN concentration in the anoxic tank improved to 24.4 mg L−1. This might be induced by the increased DO content in the anoxic tank under a relatively high R, with the anoxic environment remarkably affected. Facultative denitrifying bacteria preferentially utilizes oxygen as the electron acceptor, causing the accumulation of NO3−-N in the anoxic tank.13 Interestingly, TN concentration decreased in subsequent aerobic tank. This could be attributed to the stabilized SND processes within the redox-stratified membrane-aerated biofilm. Unique biofilm layered structure and abundant microbial community on MABR would enhance nitrogen removal. In addition, aerobic denitrifying bacteria such as Thauera and Paracoccus (Fig. 7B) enriched on MABR could use macromolecular organic compounds as carbon source to convert nitrate to nitrogen under aerobic conditions.32 On the other hand, as the R increased, the water flow velocity in the aerobic tank was accelerated, which increases the mass transfer rate of the pollutant to the biofilm on the MABR, thereby increasing the removal rate of the contaminant. Indeed, Tian et al.33 reported high velocity facilitating carbon and nitrogen mass transfer in MABR process.
From Fig. 2D, the NO3−-N influent concentration fluctuated between 1.6 and 2.1 mg L−1, subsequently, NO3−-N concentration increased significantly in the aerobic tank possibly due to the nitrification. The nitrate effluent concentration in the anoxic tank was increased by increasing R from 100% to 400%. Besides, NO2−-N concentration in influent and effluent was negligible (data unshown), suggesting that a complete nitrification–denitrification process occurred in the system.
Conversely, the system had a relatively high economic cost when the operation had a high recycling ratio.9,24 Therefore, considering the contaminant removal efficiency and economic costs, the optimal R of the A2/O-MABR system was set as 200% to conduct the following investigations.
3.2 Effect of r on the COD and nitrogen removal
As shown in Fig. 3A, COD removal efficiency varied between 87.8% and 92.2% under various r values. COD effluent concentration decreased from 35.7 to 23.4 mg L−1 as r increased from 60% to 90%, but increased to 28.5 mg L−1 as r further increased to 105%. While NH4+-N removal efficiency was always maintained as high as 99% when r ranged from 60% to 105% (Fig. 3B). NH4+-N effluent concentration was almost 0 mg L−1 as r increased from 60% to 105%, indicating that the A2/O-MABR system experienced excellent nitrification. As shown in Fig. 3C, TN removal efficiency firstly increased from 64.4% to 73.3% and then decreased to 68.1%. TN effluent concentration decreased from 18.7 to 13.4 mg L−1 as r increased up to 90%. When r further increased to 105%, TN effluent concentration increased to 17.8 mg L−1. Moreover, TN concentration decreased in the aerobic tank as r increased from 60% to 105%. As r increased from 60% to 105%, NO2−-N effluent concentration was approximately 0 mg L−1 (data unshown), while NO3−-N effluent concentrations were 16.7, 12.2, 11.6, and 15.8 mg L−1 (Fig. 3D), respectively, indicating that NO3−-N was the main compound of TN in the effluent. As shown in Fig. 3E and F, when r increased from 60% to 105%, the MLSS concentration in the aerobic tank improved from 1430 to 2660 mg L−1, and the SVI value increased from 55 mL g−1 to 120 mL g−1.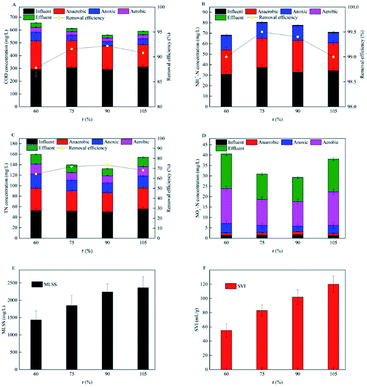 | ||
| Fig. 3 Evolution of COD, nitrogen, MLSS and SVI in A2/O-MABR system at various r. (A) COD; (B) NH4+-N; (C) TN; (D) NO3−-N. (E) MLSS; (F) SVI. | ||
COD removal efficiency increased when r increased from 60% to 90% and decreased when r at 105%. This was because the concentration of suspended sludge in the system increased with the increased of r, and a higher concentration of sludge increased the concentration of heterotrophic bacteria, which is beneficial to the removal of COD. However, when r increased to 105%, the higher sludge concentration in the system increased the oxygen mass transfer rate in the aerobic tank, resulting in slight sludge expansion, which reduced the bacterial respiration rate and reduced the COD removal efficiency. Similarly, TN removal efficiency firstly increased from 64.4% to 73.3% and then decreased to 68.1%. The nitrate in the sedimentation tank flows into the system with the return sludge, and it was removed by denitrification, which enhanced the removal of TN. However, the denitrification rate might reach the limit at r = 105%. Besides, when r was 105%, the DO content flowing into the system was larger with the return sludge, which inhibited the denitrification process.
The system SRT maintained to be 15 days, the sludge concentration in the system increased as r increased from 60% to 90%, and the effluent concentrations of the COD and nitrogen were significantly reduced. However, when r was further increased to 105%, the sludge bulking and inferior sludge settling were both observed in the system, and the removal performances of the COD and nitrogen were both slightly deteriorated. The average MLSS concentration of the A2/O-MABR system was 1800 mg L−1 (Fig. 3E), which is much lower than that in the WWTP system (ca. 4000 mg L−1). This was because the SRT of the A2/O-MABR system was lower than that of the A2/O system. On the other hand, when r further increased to 105%, the actual HRT in the anoxic tank was very short, and the denitrification reaction in the anoxic tank was not completed, which caused some NO3−-N and organic matter not to participate in the denitrification reaction, thereby increasing the effluent COD and TN content. In addition, the r was too large, which caused some sludge to settle in the corners of each reaction tank, reducing the removal effect of pollutants.
Considering the MLSS concentration and the systematic performances of the COD and nitrogen removal, the optimal r in the A2/O-MABR system was set as 75% for conducting the subsequent experiments.
3.3 Effect of DO in the aerobic tank on the COD and nitrogen removal
As indicated in Fig. 4, COD removal efficiency improved from 80% to 90.2%, while COD effluent concentration decreased from 47 to 26.3 mg L−1 when DO concentration of the aerobic bank increased from 0.5 to 2.5 mg L−1. However, COD removal efficiency decreased to 87.8%, and COD effluent concentration improved to 27.8 mg L−1 as DO concentration further increased to 3.5 mg L−1. This was mainly due to the increased content of refractory organics in the COD component of the influent. NH4+-N removal efficiency improved from 91.4% to 99.1%, and the effluent concentration of NH4+-N decreased to 0.3 mg L−1 as DO concentration increased to 3.5 mg L−1. A similar trend was exhibited by the TN removal efficiency, which initially improved from 60.2% to 70%, subsequently decreased to 65.9%. The TN concentration in the effluent gradually decreased from 18.8 to 13.7 mg L−1 and then increased to 15.4 mg L−1.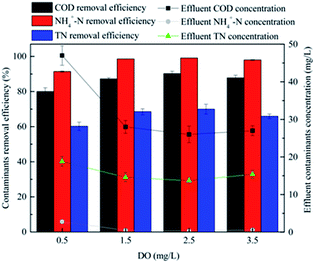 | ||
| Fig. 4 Effluent concentration and removal efficiency of COD and nitrogen in A2/O-MABR system at various DO. | ||
The growth activities of nitrifying bacteria and aerobic heterotrophic bacteria were inhibited under low DO concentrations, which reduced COD and nitrogen removal efficiency.34 However, when DO concentration further increased to 3.5 mg L−1, denitrification in anoxic tank was suppressed along with the nitrate recycle, which decreased the COD and nitrogen removal efficiency. Indeed, Machat et al.35 reported that the optimum TN removal efficiency was achieved with DO content maintained between 1.0 and 2.0 mg L−1.
Indeed, it is critical to optimize the aeration process and subsequently minimize the operating costs of wastewater treatment. When DO was 1.5 mg L−1 and 2.5 mg L−1 respectively, the removal efficiency of TN was similar (Fig. 4). However, DO was directly related to energy consumption.9 When DO was 2.5 mg L−1, the energy consumption of system aeration was relatively large. Therefore, in combination with the removal performance of the COD and nitrogen, the optimal DO concentration in the aerobic tank was determined as 1.5 mg L−1.
3.4 Continuous operation of A2/O-MABR system under optimal parameters
The A2/O-MABR system was continuously operated for 120 days under optimal operation parameters to investigate the system stability and removal performance. The influent flowrate remained at 1.5 m3 h−1 during the continuous operation. From Fig. 5, during days 1–20, average removal efficiencies of COD, NH4+-N, and TN were 90.0%, 99.3%, and 68.2%, respectively, while average effluent concentrations were 18.7, 0.24, and 14.0 mg L−1, respectively. During days 21–60, the water quality of the influent fluctuated greatly, and the relatively low influent concentration was majorly caused by the rainy season. Average removal efficiencies of COD, NH4+-N, and TN were 86.8%, 98.3%, and 61.6%, respectively, while the average effluent concentrations were 16.3, 0.26, and 12.1 mg L−1, respectively. During days 61–120, average removal efficiencies of COD, NH4+-N, and TN were 89.8%, 98.9%, and 72.6%, respectively, while the average effluent concentrations were 24.7, 0.3, and 13.3 mg L−1, respectively. Notably, the effluent concentration remained stable under the sharply increased influent concentration during days 90–105, indicating that the system had a strong resistance against the load shocks. Overall, the average removal efficiencies of COD, NH4+-N, and TN were 89.0 ± 3.2%, 98.8 ± 1.3%, and 68.5 ± 4.2%, respectively, while the average effluent concentrations of COD, NH4+-N, and TN were 22.6 ± 7.3, 0.32 ± 0.2, and 13.3 ± 1.2 mg L−1, respectively, this meets the discharge standard for Class A (GB18918-2002).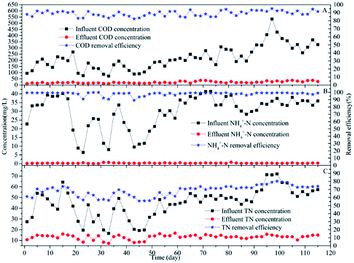 | ||
| Fig. 5 Concentration of influent and effluent and removal efficiency in A2/O-MABR system at optimal operation parameters: (A) COD; (B) NH4+-N; (C) TN. | ||
In the stage of low influent concentration (1–50 d), the removal capacity of TN in the A2/O-MABR system was 36.6 g m−3 d−1, and the corresponding COD consumption was 201.14 g m−3 d−1. While in the stage of high influent concentration (51–90 d), the removal capacity of TN in the A2/O-MABR system was 60.94 g m−3 d−1, and the corresponding COD consumption was 398.3 g m−3 d−1. During the experiment, the quality of the influent water fluctuated greatly, while the quality of the effluent water of COD, NH4+-N and TN were below 50 mg L−1, 0.5 mg L−1 and 15 mg L−1 respectively, suggesting the A2/O-MABR system had a strong resistance to load shock. Firmicutes may be a bacteria that has the ability to resist load shock.36 The content of Firmicutes in the biofilm was higher than that of suspended sludge (Fig. 7A). Indeed, Jiang et al.37 reported that the counts of total bacteria were higher in biofilm than conventional activated sludge system. The results shown that the A2/O-MABR system could maintain stable operation in terms of the COD and nitrogen removal.
3.5 OUR of AOB, NOB, and HOB in the A2/O-MABR and A2/O system
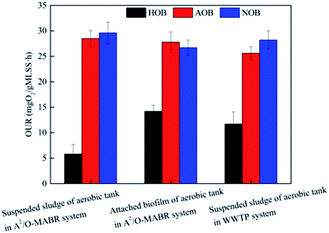
The overall metabolic activity of the microbial community was equivalent to the OUR.27 To clarify the relationship between the microbial activity and contaminants removal performance, the OURs of AOB, NOB, and HOB in the A2/O-MABR system (suspended sludge and attached biofilm in the aerobic tank) and the A2/O system (suspended sludge in the aerobic tank) were measured according eqn (1), and the results are depicted in Fig. 6. In the suspended sludge of aerobic tank of A2/O-MABR system, OURs of AOB and NOB are 28.5 and 29.6 mgO2 per gMLSS per h, while the OUR of HOB is only 5.8 mgO2 per gMLSS per h, which is significantly lower than that of the autotrophic nitrifying bacteria. This was attributed to the sufficient consumption of the COD in the anoxic tank as the electron donor for denitrification and the HOB in the aerobic tank was repressed due to the lack of carbon resources. In the A2/O-MABR biofilm, the OURs of AOB and NOB were 27.8 and 26.7 mgO2 per gMLSS per h, respectively. Conversely, the OUR of HOB was 14.2 mgO2 per gMLSS per h, which is significantly higher than that of the HOB in the suspended sludge system, which is related to the redox-stratified configuration of the membrane-aerated biofilm. The oxygen half-saturation constant of nitrifying bacteria is higher than that of the heterotrophic bacteria, thus, the nitrifying bacteria mainly grew around the membrane surface and the outer side of the suspended sludge, where the oxygen concentration was higher.15 In the A2/O system, the OURs of AOB and NOB were 25.6 and 28.2 mgO2 per gMLSS per h, respectively, which were lower than those in the A2/O-MABR suspended sludge system. The OUR of HOB was 11.7 mgO2 per gMLSS per h, which is slightly higher than that in the A2/O-MABR suspended sludge system. In the A2/O systems, the carbon source was supplemented to the anoxic tank to enhance the nitrogen removal via denitrification, followed by the incomplete consumption, which increased the influent loading of the aerobic tank and facilitated the proliferation of aerobic heterotrophic bacteria. Overall, we concluded that the A2/O-MABR system exhibited relatively high OURs of the nitrifying and heterotrophic bacteria, leading to the remarkable COD and nitrogen removal performance.3.6 Species composition and functional bacteria analysis
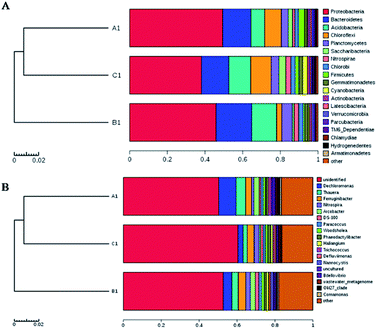
To study the relationship between the microbial community and contaminant removal in the A2/O-MABR and A2/O systems, the main microbial communities of the phylum and genus were further analyzed. As shown in Fig. 7A, Proteobacteria (A1, B1, C1: 49.41%, 45.93%, 38.15%), Bacteroidetes (14.96%, 18.84%, 14.46%), Acidobacteria (7.32%, 13.28%, 11.67%), and Planctomycetes (3.65%, 5.59%, 4.08%) were the prominent phyla in all the samples. Chloroflexi (8.86%, 2.74, 10.86%), Saccharibacteria (2.24%, 0.89%, 3.76%), Nitrospirae (1.3%, 2.45%, 2.68%), and Firmicutes (3.25%, 0.86%, 1.94%) varied greatly among the three samples. Proteobacteria, Bacteroidetes, and Chlorobi (1.82%, 2.31%, 2.28%) are denitrifying bacterial flora,38,39 and their contents in the A2/O-MABR system were higher than those in the A2/O system, suggesting that the biofilm strengthened the removal of the TN. Firmicutes had the function of sustaining the stability of the system,36 and its content in A2/O-MABR system was significantly higher than that in A2/O system.At the genus level (Fig. 7B), Dechloromonas (9.08%, 4.48%, 2.6%), Thauera (5.11%, 3.47%, 2.23%), Ferruginibacter (3.06%, 3.9%, 3.64%), and Nitrospira (1.3%, 2.45%, 2.68%) were prominent in all the samples. It had been reported that Thauera is a typical denitrifying bacteria under anoxic and aerobic conditions,40 and its content within the biofilm was 5.11%, which is higher than those in the other two suspended sludge systems. This result revealed that the biofilm in MABR was beneficial to the enrichment of Thauera. Nitrospira was a typical nitrifying bacteria,41 and its content was the highest in the suspended sludge system of the A2/O-MABR aerobic tank. Moreover, Paracoccus (1.22%, 1.39%, 1.16%) has been reported to be aerobic denitrifying bacteria that convert nitrate to nitrogen under aerobic conditions and consumes a significant portion of organic matter.1 Their content in the A2/O system was slight higher than that in the A2/O-MABR system, which may be due to the relatively high DO concentration and organic matter content in the A2/O system aerobic tank. The microbial community analysis indicated that Thauera and Paracoccus on MABR biofilm were the putative nitrogen removal functional microorganisms.
3.7 A2/O-MABR vs. A2/O
The comparison between the A2/O-MABR system and the A2/O system is shown in Table 3. There was approximately equal HRT between A2/O-MABR system and A2/O system. The operating parameters of the A2/O-MABR system, such as R, r, and DO, were lower than those of the A2/O system. These operating parameters were related to energy consumption.23 Thauera and Paracoccus were the putative nitrogen removal functional microorganisms, their content in A2/O-MABR system were higher than in A2/O system. These aerobic denitrifying bacteria enriched on the MABR biofilm consumed part of the nitrate produced by nitrification, and the removal rate of TN in the aerobic tank was about 26.5%, which reduced the amount of nitrate returning to the anaerobic tank (r) and anoxic tank (R). Moreover, due to the higher oxygen mass transfer rate of the MABR membrane, the aeration of the diffuser at the bottom of the aerobic tank was reduced, so that the system could maintain a stable removal rate under lower DO. The TN removal rate in the A2/O-MABR system was slightly lower than that in the A2/O system, because the carbon source was added to the A2/O system. Taking advantage of the MABR biofilm's rich denitrification bacteria community enhanced the removal of total nitrogen without added carbon source. On the other hand, the MLSS content in the A2/O-MABR system was significantly lower than that in the A2/O system, while the SRT in the A2/O-MABR system was higher than that in the A2/O system. MLSS and SRT are parameters related to sludge production,23 which indicated that the sludge production of the A2/O-MABR system was lower than that of the A2/O system. Studies indicated that the treatment and disposal of sludge accounting for more than 60% of energy consumption in WWTPs.42 The cost of energy of the A2/O-MABR system was also lower than that of the WWTP (0.3–0.8 kW h−1 m−3). The energy consumption of the A2/O-MABR system was 0.28 kW h−1 m−3 (the energy consumption consisted of aeration system and recirculation pump) based on the volume of the treated water. Assuming the aeration system and recirculation pump for the operations represent 60% and 20% of the total operation cost, respectively, then approximately 30% and 11.7% of the operation cost, respectively (a total of 41.7%), can be saved in the A2/O-MABR system compared to the A2/O system. Indeed, Aybar et al.43 indicated that the energy consumption of the hybrid MABR system was reduced by 86%. Therefore, under the condition of achieving the same COD and nitrogen removal efficiency, the A2/O-MABR system had more advantages in terms of energy consumption and sludge production compared to the A2/O system.| A2/O-MABR | A2/O | |
|---|---|---|
| Operation parameters | ||
| R (%) | 200 | 300 |
| r (%) | 75 | 100 |
| DO (mg L−1) | 1.5 | 2–4 |
| MLSS (mg L−1) | 1800 | 4000 |
| HRT (h) | 17.8 | 17.2 |
| Carbon source | — | Sodium acetate |
| Nitrogen removal bacteria content (Thauera, Paracoccus) | High | Low |
![[thin space (1/6-em)]](https://www.rsc.org/images/entities/char_2009.gif) |
||
| Contaminant removal efficiency | ||
| COD | 89.0 ± 3.2 | 86.7 ± 4.6 |
| NH4+-N | 98.8 ± 1.3 | 96.5 ± 2.8 |
| TN | 68.5 ± 4.2 | 72.8 ± 6.3 |
3.8 Mechanism for enhanced nitrogen removal in A2/O-MABR system
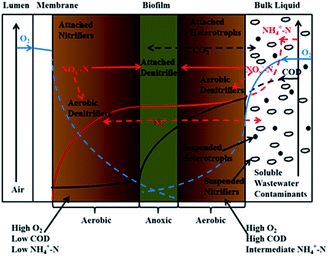
According to above experimental results, the substrate gradients in the aerobic tank of A2/O-MABR system are depicted in Fig. 8. The mechanism for enhanced nitrogen removal in biofilm could be proposed. Due to the slower growth rates and higher half-saturation constants for oxygen in comparison to those of heterotrophic bacteria, nitrifiers are enriched near the membrane surface. Additionally, there was a large number of nitrifying bacteria in the suspended mixed liquor due to the porous aeration and low COD in the bulk liquid. Overall, the nitrification capacity of the system was increased, and the ammonia conversion was complete. Heterotrophic bacteria might be located mainly at the biofilm–bulk liquid interface due to the insufficient organic substances and low DO content. Consequently, within the membrane-aerated biofilm, oxygen was consumed by microorganisms during the diffusion process and the anoxic environment was formed in the middle part of the biofilm to enhance the denitrification process. On the other hand, other nitrogen-removing bacteria in the A2/O-MABR system, such as aerobic denitrifying bacteria and anammox, also promoted the removal of TN in the system. Overall, functional flora in the biofilm could be effectively enriched, resulting in enhanced nitrogen removal and strong resistance against the load shocks.4. Conclusions
A pilot-scale A2/O-MABR system was employed to enhance the COD and nitrogen removal. Under the optimal parameters (R = 200%, r = 75%, and DO = 1.5 mg L−1), the average removal efficiencies of COD, NH4+-N, and TN were 89.0 ± 3.2%, 98.8 ± 1.3%, and 68.5 ± 4.2%, respectively, and the average effluent concentrations of COD, NH4+-N, and TN met the discharge standard for Class A (GB18918-2002). Compared with A2/O system, the A2/O-MABR system had a higher nitrifying bacteria OUR, lower sludge concentration, and lower energy consumption. Moreover, the microbial community analysis results indicated the enrichment of functional bacteria in the biofilm formed within the MABR section. This experiment indicated that the A2/O-MABR system was an effective technology for up-grading of WWTP.Conflicts of interest
There are no conflicts to declare.Acknowledgements
This study was supported by the National Natural Science Foundation of China (grant number 21878218) and Tianjin Science and Technology Major Project and Engineering (grant number 18ZXSZSF00030).Notes and references
- C. Wang, Y. Liu, W. Lv, S. Xia, J. Han, Z. Wang, X. Yu and L. Cai, Sci. Total Environ., 2019, 660, 817–825 CrossRef CAS PubMed.
- Y. Yang, J. Chen, T. Tong, B. Li, T. He, Y. Liu and S. Xie, Sci. Total Environ., 2019, 662, 863–872 CrossRef CAS PubMed.
- Z. Z. Wang, K. Zhang, C. W. Wang, L. N. Yan, W. Zhang, F. B. Tang and S. M. Li, Desalin. Water Treat., 2017, 88, 67–74 CrossRef CAS.
- E. Ashrafi, A. M. Zeinabad, S. M. Borghei, E. Torresi and J. M. Sierrae, J. Environ. Chem. Eng., 2019, 7, 10 Search PubMed.
- S. E. Raj, J. R. Banu, S. Kaliappan, I.-T. Yeom and S. Adish Kumar, Bioresour. Technol., 2013, 140, 376–384 CrossRef CAS PubMed.
- Y. Peng and S. Ge, Bioresour. Technol., 2011, 102, 6405–6413 CrossRef CAS PubMed.
- X. L. Shi, X. B. Hu, Z. Wang, L. L. Ding and H. Q. Ren, Water Sci. Technol., 2010, 61, 3017–3025 CrossRef CAS PubMed.
- L. Zhang, M. Zhang, J. Guo, J. Zheng, Z. Chen and H. Zhang, Chemosphere, 2019, 235, 805–813 CrossRef CAS PubMed.
- C. Ye, Z. Zhou, M. Li, Q. Liu, T. Xu and J. Li, J. Environ. Manage., 2018, 218, 509–515 CrossRef CAS PubMed.
- Y. X. Liu, J. P. Wu and J. L. Gao, Ind. Water Wastewater, 2011, 42, 30–33 CAS.
- Y. Chen, J. Lu, Z. Zhao, H. Chen, Y. Peng and L. Xiao, Water Sci. Technol., 2019, 79, 607–618 CrossRef CAS PubMed.
- M. Zhang, C. Wang, Y. Peng, S. Wang, F. Jia and W. Zeng, Chem. Eng. J., 2016, 283, 47–57 CrossRef CAS.
- Y. Chen, B. Li, L. Ye and Y. Peng, Biochem. Eng. J., 2015, 93, 235–242 CrossRef CAS.
- A. di Biase, M. S. Kowalski, T. R. Devlin and J. A. Oleszkiewicz, J. Environ. Manage., 2019, 247, 849–866 CrossRef CAS PubMed.
- K. J. Martin and R. Nerenberg, Bioresour. Technol., 2012, 122, 83–94 CrossRef CAS PubMed.
- M. Castrillo, R. Díez-Montero, A. L. Esteban-García and I. Tejero, Water Res., 2019, 152, 1–11 CrossRef CAS PubMed.
- J. Lin, P. Zhang, J. Yin, X. Zhao and J. Li, Int. Biodeterior. Biodegrad., 2015, 102, 49–55 CrossRef CAS.
- P. Perez-Calleja, M. Aybar, C. Picioreanu, A. L. Esteban-Garcia, K. J. Martin and R. Nerenberg, Water Res., 2017, 121, 349–360 CrossRef CAS PubMed.
- M. Li, P. Li, C. Du, L. Sun and B. Li, Ind. Eng. Chem. Res., 2016, 55, 8373–8382 CrossRef CAS.
- M. Lan, M. Li, J. Liu, X. Quan, Y. Li and B. Li, Bioresour. Technol., 2018, 270, 120–128 CrossRef CAS PubMed.
- A. Terada, K. Hibiya, J. Nagai, S. Tsuneda and A. Hirata, J. Biosci. Bioeng., 2003, 95, 170–178 CrossRef CAS.
- H. Tian, H. Zhang, P. Li, L. Sun, F. Hou and B. Li, RSC Adv., 2015, 5, 69829–69838 RSC.
- L. S. Downing and R. Nerenberg, Water Res., 2008, 42, 3697–3708 CrossRef CAS.
- Y. Chen, C. Peng, J. Wang, L. Ye, L. Zhang and Y. Peng, Bioresour. Technol., 2011, 102, 5722–5727 CrossRef CAS PubMed.
- Y. Li, S. Zhou, Y. Qiu and S. Wu, Environ. Sci. Technol., 2010, 33, 142–145 CAS.
- W. Zhang, F. Hou, Y. Peng, Q. Liu and S. Wang, Chem. Eng. J., 2014, 245, 342–347 CrossRef CAS.
- APHA, Standard Methods for the Examination for Water and Wastewater, American Public Health Association, Washington DC, USA, 21st edn, 2005 Search PubMed.
- R. Witzig, W. Manz, S. Rosenberger, U. Kruger, M. Kraume and U. Szewzyk, Water Res., 2002, 36, 394–402 CrossRef CAS PubMed.
- Y. Shen, D. Yang, Y. Wu, H. Zhang and X. Zhang, Sci. Rep., 2019, 9, 1153 CrossRef.
- P. S. Barker and P. L. Dold, Water Res., 1996, 30, 769–780 CrossRef CAS.
- T. Peng, C. Feng, W. Hu, N. Chen, Q. He, S. Dong, Y. Xu, Y. Gao and M. Li, Biochem. Eng. J., 2018, 134, 12–21 CrossRef CAS.
- Y. Mao, X. Zhang, X. Xia, H. Zhong and L. Zhao, J. Ind. Microbiol. Biotechnol., 2010, 37, 927–934 CrossRef CAS PubMed.
- H. L. Tian, Y. C. Yan, Y. W. Chen, X. L. Wu and B. A. Li, J. Microbiol. Biotechnol., 2016, 26, 373–384 CrossRef CAS PubMed.
- W. Dong, G. Gan, H. Wang and Z. Zhang, J. Harbin Inst. Technol., 2011, 43, 50–55 CAS.
- H. Machat, C. Boudokhane, N. Roche and H. Dhaouadi, Biochem. Eng. J., 2019, 151, 107313 CrossRef CAS.
- W. Guo, H. H. Ngo, F. Dharmawan and C. G. Palmer, Bioresour. Technol., 2010, 101, 1435–1439 CrossRef CAS PubMed.
- Y. Jiang, A. Khan, H. Huang, Y. Tian, X. Yu, Q. Xu, L. Mou, J. Lv, P. Zhang, P. Liu, L. Deng and X. Li, Sci. Total Environ., 2019, 646, 606–617 CrossRef CAS PubMed.
- H. Lu, K. Chandran and D. Stensel, Water Res., 2014, 64, 237–254 CrossRef CAS PubMed.
- R. Liu, Q. Wang, M. Li, J. Liu, W. Zhang, M. Lan, C. Du, Z. Sun, D. Zhao and B. Li, RSC Adv., 2020, 10, 10178–10187 RSC.
- S. Jia, H. Han, H. Zhuang and B. Hou, Bioresour. Technol., 2016, 200, 103–110 CrossRef CAS PubMed.
- Y. Jiang, L. S. Poh, C.-P. Lim and W. J. Ng, Sci. Total Environ., 2019, 660, 11–17 CrossRef CAS PubMed.
- S. Saby, M. Djafer and G. H. Chen, Water Res., 2002, 36, 656–666 CrossRef CAS PubMed.
- M. Aybar, G. Pizarro, J. P. Boltz, L. Downing and R. Nerenberg, Water Sci. Technol., 2014, 69, 1735–1741 CrossRef CAS PubMed.
| This journal is © The Royal Society of Chemistry 2020 |

