 Open Access Article
Parent and nano-encapsulated ytterbium(III) complex toward binding with biological macromolecules, in vitro cytotoxicity, cleavage and antimicrobial activity studies†
Zahra Aramesh-Boroujeni *ab,
Shohreh Jahani
 c,
Mozhgan Khorasani-Motlaghd,
Kagan Kerman
 e and
Meissam Noroozifar*e
aDepartment of Clinical Laboratory, AlZahra Hospital, Isfahan University of Medical Sciences, Isfahan, Iran. E-mail: zaramesh.boroujeni@gmail.com
bYoung Researchers and Elite Club, Najafabad Branch, Islamic Azad University, Najafabad, Isfahan, Iran
cNano Bioeletrochemistry Research Center, Bam University of Medical Sciences, Bam, Iran
dDepartment of Chemistry, University of Sistan and Baluchestan, Zahedan 98135-674, Iran
eDepartment of Physical and Environmental Sciences, University of Toronto Scarborough, 1265 Military Trail, Toronto, Ontario M1C 1A4, Canada. E-mail: m.noroozifar@utoronto.ca
First published on 17th June 2020
Abstract
To determine the chemotherapeutic and pharmacokinetic aspects of an ytterbium complex containing 2,9-dimethyl-1,10-phenanthroline (Me2Phen), in vitro binding studies were carried out with FS-DNA/BSA by employing multiple biophysical methods and a molecular modeling study. There are different techniques including absorption spectroscopy, fluorescence spectroscopy, circular dichroism studies, viscosity experiments (only in the case of DNA), and competitive experiments used to determine the interaction mode between DNA/BSA and the ytterbium-complex. The results showed that the Yb-complex exhibited a high propensity for the interaction of BSA and DNA via hydrophobic interactions and van der Waals forces. Further, a competitive examination and docking study showed that the interaction site of the ytterbium complex on BSA is site III. The results of docking calculations for DNA/BSA were in good agreement with experimental findings. The complex displays efficient DNA cleavage in the presence of hydrogen peroxide. Moreover, antimicrobial studies of different bacteria and fungi indicated its promising antibacterial activity. In vitro cytotoxicity studies of the Yb-complex, starch nano-encapsulated, and lipid nano-encapsulated were carried out in MCF-7 and A-549 cell lines, which revealed significantly good activity. The results of anticancer activity studies showed that the cytotoxic activity of the Yb-complex was increased when encapsulated with nanocarriers. Based on biological applications of the Yb-complex, it can be concluded that this complex and its nanocarriers can act as novel anticancer and antimicrobial candidates.
1. Introduction
Studies on the synthesis and antitumor properties, along with their reactivity towards protein and DNA, of small molecules are of recent importance in linking information about tools for molecular biology, metabolism and transporting procedure, and drug design. Therefore, several scientists today focus on the development of novel metal-based antitumor drugs with noncovalent binding modes that target DNA.1,2 DNA is the target molecule for many medications, particularly anticancer drugs. The binding of metal complexes with DNA is the topic of interest in various study fields, for example, medicinal chemistry, cancer therapy, life science, biochemistry, etc.3–6 The metal compounds used as antitumor factors can bind to carrier proteins in the blood. Albumins are the essential extracellular and the most abundant protein constituent of the vascular system. Both human serum albumin (HSA) with 585 amino acid residues, which has one Trp (Trp-214), and bovine serum albumin (BSA) with 583 amino acid residues, which has two Trp (Trp-134 and Trp-213), are types of globular and non-glycosylated protein. Their three-dimensional structure is like the shape of the heart and consists of three homologous domains and each domain comprises two subdomains (A and B).7,8In this context, binding toward serum proteins that may perform a transport function for metal complexes appears to be the most important issue because such interactions determine also the overall drug distribution and excretion and differences in efficacy, activity, and toxicity.8–11
The coordination chemistry of lanthanides (Ln) has disclosed considerable development in several decades because of its various applications.12 The Ln3+ ions perform as hard Lewis acids. Hence, their junctions with hard molecules with oxygen donor atoms will be robust. The lanthanide compounds design is concentrated on potential applications in parts like separation, nonlinear optics, catalysis, magnetism, luminescent probes, and extraction, or is indicating in therapeutic potential as antibacterial, antifungal, anticancer, or antioxidant agents. Due to their lifetimes and long-wavelength fluorescence, lanthanide compounds have the potential for application as probes and sensors in the medical and biological studies.13–17
One of the best ways to improve the antitumor activity and reduce the side effects of metal complexes is their encapsulation into starch, lipid and liposome microspheres. Nanocapsules offer a broad range of interesting features over their micro-sized counterparts as they hold more surface area, have enhanced solubility, significantly higher biocompatibility, biodegradability, stability during storage, and controlled release.18,19
In continuation of our previous paper,20–25 we decided to expose the luminescence of the Yb(III) containing Me2Phen ligand, [Yb(Me2Phen)2Cl3(OH2)] and to introduce it as a novel probe to BSA (Bovine Serum Albumin) and FS-DNA (Fish-Salmon DNA). Thus, the binding of the ytterbium complex with BSA and FS-DNA was examined by emission spectroscopy, UV-vis titration, viscosity measurement, CD spectroscopy, and docking method. Also, the ability of this complex to cleave DNA by gel electrophoresis was reported. Moreover, nanocarriers of this complex produced, and the anticancer, antifungal, and antibacterial properties of this complex studied.
2. Experimental
2.1. Materials and apparatus
FS-DNA, BSA, and EtBr were obtained from Sigma-Aldrich. Tris(hydroxymethyl)-aminomethane (Tris–HCl) and other chemicals were purchased from Merck. All chemicals and solvents were used as received without further purification. The ytterbium-complex was prepared according to previously reported in our earlier work.21Electronic absorption measurements were carried out using the Analytik Jena SPEC ORD S100 spectrometer at room temperature. Fluorescence experiments were performed on a PERKIN ELMER, LS-3 equipped with thermostat cell compartment which kept temperature constant within ±0.1 °C. Fluorescence titration carried out at different temperatures (290, 295, 298, 301, and 303 K). The widths of both the excitation and emission slits were set at 5.0 nm. Circular dichroism (CD) studies were done by an Aviv Circular Dichroism Spectrometer (model 215) at 298 K, and the viscosity experiment was performed by a viscometer (SCHOT AVS 450) at room temperature. Inductively coupled plasma (ICP) spectrometer was employed to determine the amount existing of ytterbium in the lipid nanoencapsulation (LNEP) and the starch nanoencapsulation (SNEP).
2.2. FS-DNA and BSA binding experiments
All the solutions were made in Tris–HCl buffer (including 50 mM sodium chloride and 5 mM Tris–HCl) at pH = 7.2. The concentrations of FS-DNA, BSA and EtBr solutions were obtained by UV-vis spectrometry (ε260 = 6600 M−1 cm−1, ε280 = 44![[thin space (1/6-em)]](https://www.rsc.org/images/entities/char_2009.gif) 300 M−1 cm−1 and ε480 = 5450 M−1 cm−1 for FS-DNA, BSA and EtBr, respectively2,23). Also, DNA purity was tested by the observance of the ratio of absorption at 260 and 280 nm. The solution of FS-DNA provided A260/A280 > 1.80, presenting that the deoxyribonucleic acid was satisfactorily free from protein pollution.26 All the solutions were kept at four degrees centigrade and consumed after no more than four days. The stability of the ytterbium(III) complex was tested in aqueous solution through the UV-vis spectra of the Yb-compound several times.
300 M−1 cm−1 and ε480 = 5450 M−1 cm−1 for FS-DNA, BSA and EtBr, respectively2,23). Also, DNA purity was tested by the observance of the ratio of absorption at 260 and 280 nm. The solution of FS-DNA provided A260/A280 > 1.80, presenting that the deoxyribonucleic acid was satisfactorily free from protein pollution.26 All the solutions were kept at four degrees centigrade and consumed after no more than four days. The stability of the ytterbium(III) complex was tested in aqueous solution through the UV-vis spectra of the Yb-compound several times.
The Yb-complex has the fluorescence in 300–450 nm at λex = 270 nm (the excitation wavelength), but quantum efficiencies of complex were much lower than protein. However, the intensity fluorescence of the Yb-complex is much lesser than the protein solution in the concentration range of this work. Thereby, emission spectra measurements were modified by considering of these values that is negligible. The inner filter effect (IFE) was considered in the emission titration data. Usually, the emission intensity with IFE can be modified using eqn (1):1,8,27
 | (1) |
2.3. Molecular docking
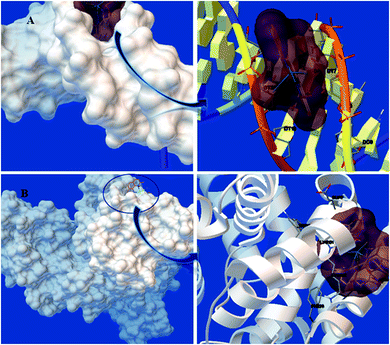
From the Brookhaven protein data bank, the crystal structures of DNA duplex (entry codes 1BNA and with sequence d(CGCGAATTCGCG)2 dodecamer) and BSA (entry codes 3v03) were downloaded. Forgiving the most stable geometric of the ytterbium complex, the structure optimizing calculation was performed by Gaussian 09 at the 6–31 G** level by using the B3LYP hybrid density functional theory (DFT).28 Autodock4.2.6 was applied by a semi-flexible docking technique. In this study, all the Yb-complex bonds were set free while BSA and DNA kept rigid. Also, the different regions of BSA selected for the docking (three BSA active sites). The gridpoint spacing of 0.375 Å and the grid map with 70 Å × 70 Å × 70 Å points were created. The docking included the maximum 25![[thin space (1/6-em)]](https://www.rsc.org/images/entities/char_2009.gif) 000
000![[thin space (1/6-em)]](https://www.rsc.org/images/entities/char_2009.gif) 000 energy calculations, and 200 separate docking runs were performed utilizing the Lamarckian genetic algorithm local search technique.29
000 energy calculations, and 200 separate docking runs were performed utilizing the Lamarckian genetic algorithm local search technique.29
2.4. DNA cleavage experiments
The ytterbium complex ability for DNA cleavage can be examined by gel electrophoresis. In the presence and absence of hydrogen peroxide (2.0 × 10⁻⁴ M) as the oxidant, FS-DNA (1.4 mM) was added to Yb-complex solutions with the various amounts (1.2, 2.5, 3.7, and 5 mM) and then solution mixed. The solutions were incubated for 0.5 h at 25 °C. The solutions were quenched by addition of a loading buffer (30% glycerol (3 μL) + 0.25% xylene cyanol + 25% bromophenol blue). Then, electrophoresis was completed by at 50 V for 60 min in TAE buffer at pH = 7.2 (40 mM acetic acid, 1 mM EDTA, and 40 mM Tris-base) on an agarose gel. The agarose gel was stained for 20 min by keeping it in the EtBr solution (1 μg cm−3). Then, it was de-stained for 20 min by immersing in sterile distilled water. The bands were imagined by watching the gel by UV illumination and photographed.2.5. Evaluation of cytotoxicity (MTT assay)
The LNEP and SNEP of the Yb complex were synthesized according to the literature.19 The MTT examination studied the anticancer properties of the ytterbium complex, LNEP, and SNEP on A-549 and MCF-7 cell lines. The cell lines of A-549 and MCF-7 were incubated for one day at 37 °C in a humidified 5% CO2, in the existence of the various amount of the Yb complex, SNEP, and LNEP. After this step, the solution of MTT (10 μL, 12 mM) was added, and then the plates were incubated for four hours. The culture media was rejected. After the addition of DMSO (50 μL), the wells were washed with phosphate-buffered saline and incubated for ten minutes. IC50 is the 50% inhibition concentration which calculated at 545 nm by ELISA reader through the following eqn (2):4| % cell cytotoxicity = [1 − (drug absorption/control absorption)] × 100 | (2) |
For evaluating the influence of SNEP and LNEP on the anticancer properties, the cellular penetration examination was performed. The A-549 and MCF-7 cell lines with the cell culture (100 μL) medium including 0.15 μg Yb complex (130 μM), 1.29 μg SNEP or 1.15 μg LNEP (equivalent to 0.15 μg Yb complex) were incubated for one day in 5% CO2 incubator. Afterward eliminating the supernatant, this mixes (the cells having Yb-complex) were treated with CHCl3 and HNO3. All studies were done three times.
2.6. Antibacterial test
The zone of inhibition testing, the plate-counting technique, the minimum inhibitory concentration (MIC), and the inoculation time examined the antibacterial activity of Yb-complex on five Gram-negative bacteria (Acinetobacter baumannii (A. baumannii), Klebsiella pneumoniae (K. pneumoniae, ATCC 10031), Salmonella typhi (S. typhi, ATCC 1609), Pseudomonas aeruginosa (P. aeruginosa, ATCC 27853), Escherichia coli (E. coli, ATCC 25922)) and four Gram-positive bacteria (Enterococcus faecalis (E. faecalis, ATCC 29212), Methicillin-resistant Staphylococcus aureus (MRSA), Enterococcus faecium (E. faecium), Vancomycin-resistant Enterococcus (VRE)) and one fungus Candida albicans (C. albicans).In the inhibition zone diameter method, a stock inoculum with 700 CFU mL−1 for dyes on the agar plate of Muller Hinton (MH) was applied. Afterward, discs of filter paper saturated with the antimicrobial matter (Yb-complex, 5 mg mL−1) were transported on the plate. For taking the zone of inhibition, the incubation was carried out for one day at room temperature. The broth dilution technique did the plate-counting methods and MIC. Tubes, including MH broth, 5.0 mL, with ten-fold dilutions of antimicrobial agents (0.005–50 mg L−1), were inseminated with 700 CFU mL−1 of fungi and bacteria. Also, tubes were incubated for one day at 37 degrees centigrade; then, without shaking for visible turbidity, incubation tubes were studied. The minimum inhibitory concentration was found as the bottom dilution of this compound that made no noticeable turbidity.
After MIC have been detected, 1.0 × 10² L of inoculum from the content of the tube, without visible turbidity was subculture onto the agar plate and also incubated for one day. Then, the number of grown colonies on the subculture was contrasted to the number of CFU mL−1 in the initial inoculum. The minimum bactericidal concentration (MBC) was referred to as the lowermost dilution of ytterbium compound allowed less than 0.1% of the initial inoculum to live. These studies were performed three times.
3. Results and discussion
3.1. The f–f transition of ytterbium complex
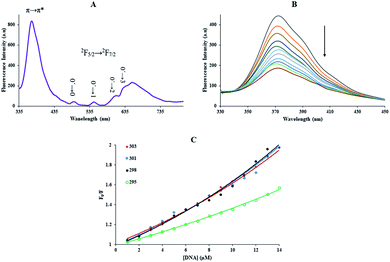
The Yb-complex revealed broadband at 372 nm ascribed to fluorescence Me2Phen ligand and luminescence characteristic of Yb3+ with apparent bands in the region of 400–700 nm (Fig. 1(A)). As we can see in the figure, the f–f transitions for the Yb-complex presented four luminescence peaks at 633, 609, 545, and 495 nm, corresponding to 0′ → 3, 0′ → 2, 0′ → 1, and 0′ → 0 (2F5/2 → 2F7/2) transition of Yb3+ ion, respectively.30The luminescence spectrum of the trivalent ytterbium cation definite that the Me2Phen was an excellent chelating chromophore and could be applied to absorb and transfer energy to Yb3+ atom. Instead, the presentation of the ligand-centered luminescence peak at 372 nm indicated that the effective energy transfer from Me2Phen to the Yb3+ center did not happen and energy transfer from Yb3+ cation overcame.31
3.2. FS-DNA binding examinations
The emission quenching technique further investigated the binding of the Yb-complex and DNA. The emission quenching happens by various mechanisms, which are generally classified as dynamic and static. Static quenching exhibits to formation complex of quencher–fluorophore (FS-DNA–Yb-complex). Still, dynamic quenching mentions to a procedure in which the quencher (FS-DNA) and the excited fluorophore (Yb-complex) requires contact.
With growing temperature, it is possible the results of the reduction in the stability of the complex, and so quenching constants values (KSV) were decreased. But, dynamic quenching depends upon diffusion, and since higher temperatures result in more significant diffusion coefficients, KSV values were exaggerated by raising the temperature.33,34 The only dynamic or static quenching procedure can cause a linear plot F0/F vs. [Q] (eqn (3)), and based on the classical theory of emission quenching; a nonlinear plot can be the combination of quenching type.32
 | (3) |
 | (4) |
Obviously, the dependence of F0/F on [Q] is linear for dynamic quenching and static quenching. However, for the combined dynamic and static quenching, the characteristic feature of the dependence of F0/F on [Q] is an upward curvature, concave towards the Y-axis. And the dependence of F0/F on [Q] is described by the following modified Stern–Volmer equation:36
 | (5) |
| T (K) | kq × 10−12 (M−1 s−1) | KSV × 10−4 (M−1) | Kb × 10−5 (M−1) | n | ΔS° (J mol−1 K−1) | ΔH° (kJ mol−1) | ΔG° (kJ mol−1) | |
|---|---|---|---|---|---|---|---|---|
| UV | Fluorescence | |||||||
| 290 | 3.18 ± 0.04 | 3.18 ± 0.04 | 0.64 ± 0.02 | 1.00 | −26.70 ± 0.04 | |||
| 295 | 3.27 ± 0.04 | 3.27 ± 0.04 | 1.62 ± 0.03 | 1.13 | −29.42 ± 0.03 | |||
| 298 | 5.58 ± 0.03 | 5.58 ± 0.03 | 1.49 ± 0.02 | 2.95 ± 0.05 | 1.13 | 528.80 ± 0.06 | 126.59 ± 0.04 | −31.20 ± 0.03 |
| 301 | 5.66 ± 0.04 | 5.66 ± 0.04 | 4.07 ± 0.04 | 1.16 | −32.32 ± 0.06 | |||
| 303 | 6.25 ± 0.05 | 6.25 ± 0.05 | 6.45 ± 0.05 | 1.19 | −33.70 ± 0.05 | |||
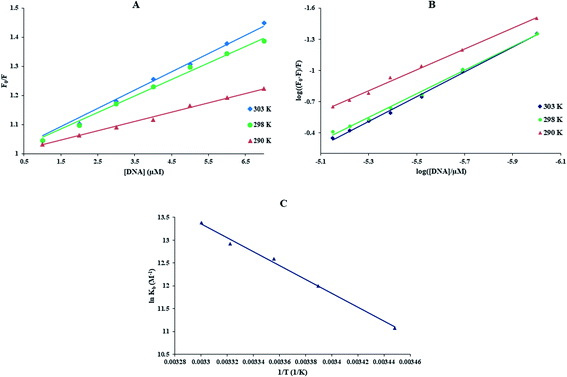
Kb and the number of binding sites (n) for interaction DNA with the Yb-complex were analysed by eqn (6) using the data obtained from fluorescence titration:6
 | (6) |
![[thin space (1/6-em)]](https://www.rsc.org/images/entities/char_2009.gif) Kb against 1/T (Fig. 2(C)).33
Kb against 1/T (Fig. 2(C)).33
 | (7) |
| ΔG° = ΔH° − TΔS° | (8) |
The thermodynamic parameters of the Yb-complex were listed in Table 1. The model of binding between macromolecular and the complex can be concluded using by the thermodynamic parameters: (1) ΔH° < 0 and ΔS° < 0, hydrogen bonds and van der Waals interaction; (2) ΔH° close to 0 and ΔS° > 0, electrostatic interactions; (3) ΔH° > 0 and ΔS° > 0, hydrophobic forces.33,34 As Table 1 showed that the positive values of ΔS° and ΔH° revealed that hydrophobic forces play main roles in the interaction of FS-DNA to the Yb-complex. Also, the negative ΔG° sign exposed to the DNA-binding procedure was spontaneous.
The rhodamine B binds to DNA by the groove binding, and it is used to research competitive replacement by groove binders. The fluorescence spectra rhodamine B-FS-DNA solution (3.0 μM and 70 μM, respectively) in the presence and absence of Yb-complex (0–145.7 μM) were investigated (Fig. 3(B)). In addition to the Yb-complex to the rhodamine B-FS-DNA, a remarkable reduction in the emission intensity of the rhodamine B-DNA was detected. This result showed that the ytterbium complex was able to replace rhodamine B. The results indicated that the Yb-complex bonds with FS-DNA with the groove binding rather than an intercalation binding.
But, non-intercalative binding provides a little protection for the fluorophore as the fluorophore is revealed to the surroundings, and I− can immediately quench its emission even in the FS-DNA attendance.40 Using eqn (3) availability of Yb-complex to I− in the presence and absence of DNA was investigated (Fig. 4(A)), and the values of KSV were determined. As seen in insert of Fig. 4(A), I− quenched the Yb complex emission in the presence (KSV = 23.32 M−1) and the absence of FS-DNA (37.26 M−1). These data propose that FS-DNA interacts with the Yb complex through the groove interaction.
The influence of the Yb-complex on the FS-DNA conformation as showed Fig. 4(B). As can be seen that with adding of the ytterbium complex to DNA solution, the decrease of both the positive and negative band intensity (shifting to zero levels) without the shift in λmax was indicated. This result revealed that the right-handed B form of FS-DNA is stabilized.33 Therefore, these results are supported by a non-intercalative mode and suggest the groove mode.
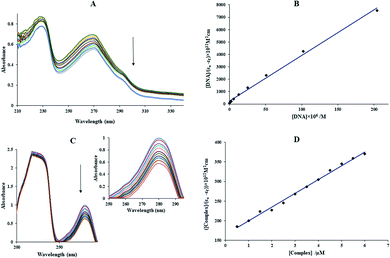
| [Q]/(εa − εf) = [Q]/(εb − εf) + 1/Kb(εb − εf) | (9) |
In the above equation, the extinction coefficient εf, εb, and εa correspond to the extinction coefficient for the Yb-complex in a free state, the fully bound form, and Aobsd/[complex], respectively and [Q] is the FS-DNA concentration. Kb was 1.49 × 10⁵ M−1 (Fig. 5(B)), which was lower than that of the classic intercalation EtBr (1.4 × 10⁶ M−1).43 This result can be revealed that the interaction kind between FS-DNA and the ytterbium complex (non-intercalation) was differenced from EtBr.
3.3. Protein-binding
| T (K) | kq × 10−12 (M−1 s−1) | KSV × 10−5 (M−1) | Kb × 10−5 (M−1) | n | ΔS° (J mol−1 K−1) | ΔH° (kJ mol−1) | ΔG° (kJ mol−1) | |
|---|---|---|---|---|---|---|---|---|
| UV | Fluorescence | |||||||
| 290 | 1.51 ± 0.04 | 1.51 ± 0.04 | 13.1 ± 0.06 | 1.17 | −33.97 ± 0.06 | |||
| 295 | 1.41 ± 0.03 | 1.41 ± 0.03 | 7.41 ± 0.05 | 1.13 | −33.15 ± 0.02 | |||
| 298 | 1.05 ± 0.05 | 1.05 ± 0.05 | 2.13 ± 0.03 | 4.89 ± 0.05 | 1.12 | −214.93 ± 0.03 | −96.43 ± 0.05 | −32.46 ± 0.05 |
| 301 | 1.02 ± 0.04 | 1.02 ± 0.04 | 3.38 ± 0.03 | 1.09 | −31.86 ± 0.04 | |||
| 303 | 0.96 ± 0.02 | 0.96 ± 0.02 | 2.29 ± 0.06 | 1.07 | −31.09 ± 0.03 | |||
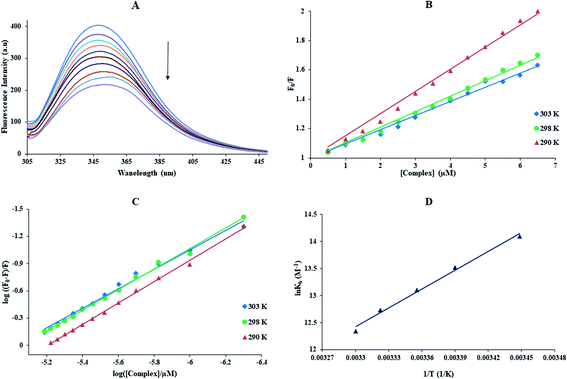
The plot of ln![[thin space (1/6-em)]](https://www.rsc.org/images/entities/char_2009.gif) Kb against 1/T allows to gaining of the thermodynamics parameters of Yb(III)-BSA complex by the eqn (7) and (8) (Fig. 6(D)). The ΔS°, ΔG°, and ΔH° for the binding of BSA with ytterbium complex listed in Table 2. The negative signs of ΔS° and ΔH° exhibited that hydrogen bonds and van der Waals interactions play primary roles in the interaction of protein to ytterbium complex; the negative signs of ΔG° showed the BSA binding procedure was spontaneous.
Kb against 1/T allows to gaining of the thermodynamics parameters of Yb(III)-BSA complex by the eqn (7) and (8) (Fig. 6(D)). The ΔS°, ΔG°, and ΔH° for the binding of BSA with ytterbium complex listed in Table 2. The negative signs of ΔS° and ΔH° exhibited that hydrogen bonds and van der Waals interactions play primary roles in the interaction of protein to ytterbium complex; the negative signs of ΔG° showed the BSA binding procedure was spontaneous.
 | (10) |
 | (11) |
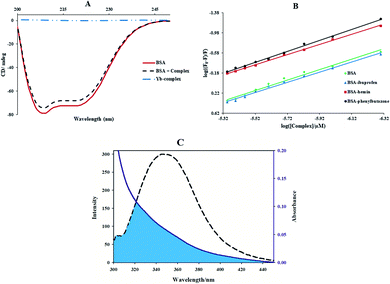
![[thin space (1/6-em)]](https://www.rsc.org/images/entities/char_2009.gif) 000 is the MRE208 a pure α-helical value and 4000 is the MRE208 of the random and β-form coil conformation cross. This data exposes that the content of α-helical for the ytterbium complex-protein is 48.7%, which has slightly reduced compared with the free protein (52.8%). The results reveal that BSA binds with Yb complex cause in small changes in the BSA conformation.
000 is the MRE208 a pure α-helical value and 4000 is the MRE208 of the random and β-form coil conformation cross. This data exposes that the content of α-helical for the ytterbium complex-protein is 48.7%, which has slightly reduced compared with the free protein (52.8%). The results reveal that BSA binds with Yb complex cause in small changes in the BSA conformation.
 | (12) |
| R06 = 8.79 × 10⁻²⁵ K2n−4∅J | (13) |
 | (14) |
| E | J (cm3 L mol−1) × 10−13 | R0 (nm) | r (nm) |
|---|---|---|---|
| 0.26 | 5.37 | 2.30 | 2.69 |
3.4. Docking process
| Macromolecule | Binding energy (kcal mol−1) | Ki (μM) | |
|---|---|---|---|
| DNA | −8.28 | 0.83 | |
| BSA | Site I | −6.80 | 9.57 |
| Site II | −7.51 | 3.29 | |
| Site III | −7.85 | 1.72 | |
3.5. DNA cleavage experiment
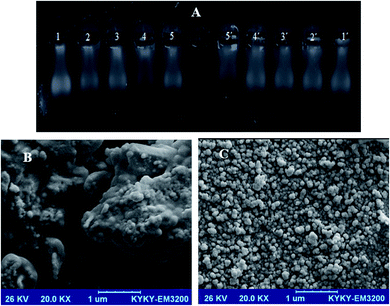
Gel electrophoresis is a valued method used for purification, qualification, and separation of DNA pieces. This technique is easy to perform, simple, and able to resolve fragments of DNA that cannot be separated by other means.48,52 The location of DNA on the agarose gel can be traced by smearing with a lower amount of EtBr. DNA cleavage experiment using FS-DNA (1.4 × 10⁻³ M) was carried out by the Yb-complex in the presence (lanes 1′–5′) and absence (lanes 1–5) of oxidant, H2O2 (20 mM, Fig. 9(A)). In lanes 1 and 1′ (control) without the Yb-complex, not any FS-DNA cleavage was detected. Lanes 2–5 and 2′–5′ indicated DNA treated with enhancing the concentration of this compound (1.2, 2.5, 3.7, and 5.0 mM). It can be seen from Fig. 9(A) that the ytterbium complex at various amounts can cleave FS-DNA. But with enhancing the concentration of the Yb-complex, due to increased cleavage of FS-DNA. Moreover, all of DNA–Yb-complex solutions show slightly decreased mobility concerning control. The DNA migration decreased with growing Yb-complex concentration (lanes 2–5 and 2′–5′). Also, the DNA cleavage efficacy is higher in the existence of the hydrogen peroxide. The photograph indicates the bands with different bandwidth (smear pattern). However, with the increasing in the Yb-complex amount, the increasing of smearing was detected for groups.203.6. Anticancer activity
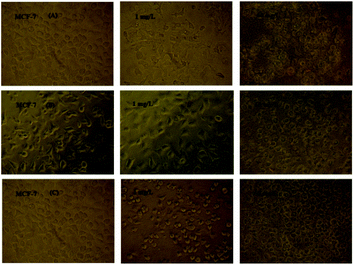 | ||
| Fig. 10 Microscopic photographs of the MCF-7 cancer cells in the presence and absence of various amounts of the (A) ytterbium complex, (B) SNPE, and (C) LNPE. | ||
 | ||
| Fig. 11 Plans of cytotoxicity percentage against the ytterbium complex, SNPE, and LNPE concentrations against the A-549 and MCF-7 cell lines. Data are expressed as mean ± SD of three experiments. | ||
| Cell lines | IC50 (μg mL−1) | ||
|---|---|---|---|
| Yb-complex | LNEP | SENP | |
| A-549 | 10.2 | 3.29 | 6.80 |
| MCF-7 | 5.75 | 1.62 | 3.36 |
3.7. Antibacterial and antifungal assay
Recently, it has essential for novel antibacterial and antifungal agents.15 Different techniques tested the antimicrobial activity of the ytterbium complex against bacteria and fungi. The values of the zone of inhibition, inoculation time, MBC, and MIC were listed in Table 6.| Bacteria type | Bacteria or fungi | Zone of inhibition (mm) | MIC (μg mL−1) | MBC (mg mL−1) | Inoculation time (h) |
|---|---|---|---|---|---|
| Fungi | C. albicans | 55 | 62 | 1.0 | 24 |
| Gram-negative | S. typhi | 32 | 62 | 2.0 | 48 |
| P. aeruginosa | 21 | 125 | 4.0 | 48 | |
| A. baumannii | 45 | 31 | 2.0 | 48 | |
| K. pneumoniae | 33 | 62 | 0.5 | 24 | |
| E. coli | 38 | 31 | 2.0 | 24 | |
| Gram-positive | MRSA | 34 | 125 | 4.0 | 48 |
| VRE | 9 | 31 | 2.0 | 48 | |
| E. faecalis | 8 | 125 | 4.0 | 48 | |
| E. faecium | 21 | 125 | 4.0 | 48 |
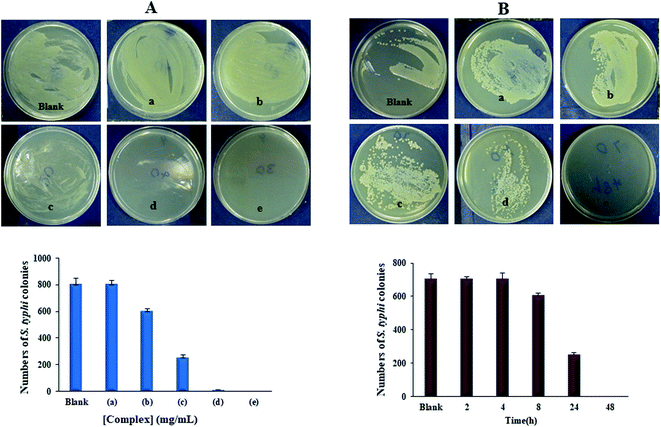
The Yb-complex was significantly displaying properties against different bacteria and fungi, especially C. albicans, A. baumannii, E. coli, and MRSA. An effect of the Yb(III) complex concentration with 700 CFU of S. typhi illustrations in Fig. 12(A). The substantial decrease in the extent of bacterial colonies was observed in 2.0 mg of Yb-complex, showing antimicrobial properties by growing the Yb-complex concentrations. MH standard with 5 mg mL−1 of Yb-complex and 700 CFU of S. typhi supplemented for various time distances. Fig. 12(B) and Table 6 indicated that the S. typhi colonies were killed entirely after 48 hours of inoculation, and the calculation of bacteria decrease was nearly 100% after 4–48 hours of injection. The data revealed that this complex has produced the marked enhancement in the potency as antifungal and antibacterial agents. Such increased activity of Yb(III) complex can be explained on the basis of chelation theory. Chelation considerably decreases the polarity of the metal ion, which further leads to the enhancement of the lipophilicity of the complex. Since the microorganism cell is surrounded by a lipid membrane which favors the passage of only the lipid soluble materials, increased lipophilicities allows the penetration of complex into lipid membranes and blocking of the metal binding sites in the enzymes of the microorganisms. Also, the antibacterial mechanism was hypothesized that ytterbium(III) complex has an effect on the pathogenic bacteria cell proliferation.15,53,54
4. Conclusion
In this research, the biology application of the ytterbium-complex was investigated. The FS-DNA and BSA interaction properties of the Yb complex were comprehensively investigated by various techniques, containing UV-vis spectroscopy, emission spectra, competitive experiments, CD spectroscopy, and molecular docking calculations. The results showed the excellent binding affinity of the Yb-complex to FS-DNA and BSA; besides the emission quenching of FS-DNA and BSA resulted from the combined static-dynamic and static process, respectively. Moreover, groove binding (hydrophobic interaction and van der Waals force for DNA and BSA, respectively) played major roles in stabilizing the Yb-complex with DNA/BSA. From molecular docking and competitive binding studies, it exhibited that site 3 of BSA is the binding site of interaction Yb-complex to BSA. The agreement of molecular docking and experimental results can be given as powerful support for the validity of docking studies. Moreover, the Yb complex successfully cleaved DNA in the absence and presence of hydrogen peroxide and has high antimicrobial activity on several bacterial and fungi. In addition, the drug carrier forms of the Yb complex (SNEP and LNEP) were prepared. These complexes exhibited significant antitumor properties against cell lines of A-549 and MCF-7. Briefly, it can be seen that ytterbium complex bonds in the groove of FS-DNA as well as can be transported professionally through BSA in the blood. Also, this complex has been obtained to revelation antitumor, antibacterial, and antifungal activities. Therefore, the foundation knowledge from this work would be helpful for the improvement of novel therapeutic reagents for diseases.Conflicts of interest
The authors declare that they have no known competing financial interests or personal relationships that could have appeared to influence the work reported in this paper.Acknowledgements
The financial supports of Research Councils of University of Sistan and Baluchestan are gratefully acknowledged. K. K. acknowledges financial support from the Canada Research Chairs Tier-2 award for “Bioelectrochemistry of Proteins” (Project no. 950-231116), Ontario Ministry of Research and Innovation (Project no. 35272), Discovery Grant (Project no. 3655) from Natural Sciences and Engineering Research Council of Canada (NSERC), and Canada Foundation for Innovation (Project no. 35272).References
- D. Anu, P. Naveen, B. VijayaPandiyan, C. S. Frampton and M. Kaveri, An unexpected mixed valence tetranuclear copper(I/II) complex: Synthesis, structural characterization, DNA/protein binding, antioxidant and anticancer properties, Polyhedron, 2019, 167, 137–150 CrossRef CAS.
- M. Anjomshoa, S. J. Fatemi, M. Torkzadeh-Mahani and H. Hadadzadeh, DNA- and BSA-binding studies and anticancer activity against human breast cancer cells (MCF-7) of the zinc(II) complex coordinated by 5,6-diphenyl-3-(2-pyridyl)-1,2,4-triazine, Spectrochim. Acta, Part A, 2014, 127, 511–520, DOI:10.1016/j.saa.2014.02.048.
- T.-T. Zhao, X. Lu, X.-H. Yang, L.-M. Wang, X. Li, Z.-C. Wang, H.-B. Gong and H.-L. Zhu, Synthesis, biological evaluation, and molecular docking studies of 2,6-dinitro-4-(trifluoromethyl) phenoxysalicylaldoxime derivatives as novel antitubulin agents, Bioorg. Med. Chem., 2012, 20(10), 3233–3241 CrossRef CAS PubMed.
- M. Mohamadi, A. Hassankhani, S. Y. Ebrahimipour and M. Torkzadeh-Mahani, In vitro and in silico studies of the interaction of three tetrazoloquinazoline derivatives with DNA and BSA and their cytotoxicity activities against MCF-7, HT-29 and DPSC cell lines, Int. J. Biol. Macromol., 2017, 94, 85–95, DOI:10.1016/j.ijbiomac.2016.09.113.
- M. Sedighipoor, A. H. Kianfar, G. Mohammadnezhad, H. Görls, W. Plass, A. A. Momtazi-Borojeni and E. Abdollahi, Synthesis, crystal structure of novel unsymmetrical heterocyclic Schiff base Ni(II)/V(IV) complexes: Investigation of DNA binding, protein binding and in vitro cytotoxic activity, Inorg. Chim. Acta, 2019, 488, 182–194 CrossRef CAS.
- T. Kondori, O. Shahraki, N. Akbarzadeh-T and Z. Aramesh-Boroujeni, Two Novel Bipyridine-based Cobalt(II) Complexes: Synthesis, Characterization, Molecular Docking, DNA-Binding and Biological Evaluation, J. Biomol. Struct. Dyn., 2020, 1–27, DOI:10.1080/07391102.2020.1713893.
- B.-L. Wang, D.-Q. Pan, K.-L. Zhou, Y.-Y. Lou and J.-H. Shi, Multi-spectroscopic approaches and molecular simulation research of the intermolecular interaction between the angiotensin-converting enzyme inhibitor (ACE inhibitor) benazepril and bovine serum albumin (BSA), Spectrochim. Acta, Part A, 2019, 212, 15–24 CrossRef CAS PubMed.
- J.-h. Shi, D.-q. Pan, M. Jiang, T.-T. Liu and Q. Wang, In vitro study on binding interaction of quinapril with bovine serum albumin (BSA) using multi-spectroscopic and molecular docking methods, J. Biomol. Struct. Dyn., 2017, 35(10), 2211–2223 CrossRef CAS PubMed.
- J.-H. Shi, Y.-Y. Lou, K.-L. Zhou and D.-Q. Pan, Elucidation of intermolecular interaction of bovine serum albumin with Fenhexamid: a biophysical prospect, J. Photochem. Photobiol., B, 2018, 180, 125–133 CrossRef CAS PubMed.
- A. R. Timerbaev, C. G. Hartinger, S. S. Aleksenko and B. K. Keppler, Interactions of antitumor metallodrugs with serum proteins: advances in characterization using modern analytical methodology, Chem. Rev., 2006, 106(6), 2224–2248 CrossRef CAS PubMed.
- X.-Q. Song, Z.-G. Wang, Y. Wang, Y.-Y. Huang, Y.-X. Sun, Y. Ouyang, C.-Z. Xie and J.-Y. Xu, Syntheses, characterization, DNA/HSA binding ability and antitumor activities of a family of isostructural binuclear lanthanide complexes containing hydrazine Schiff base, J. Biomol. Struct. Dyn., 2020, 38(3), 733–743, DOI:10.1080/07391102.2019.1587511.
- S. Niroomand, M. Khorasani-Motlagh, M. Noroozifar, S. Jahani and A. Moodi, Photochemical and DFT studies on DNA-binding ability and antibacterial activity of lanthanum(III)-phenanthroline complex, J. Mol. Struct., 2017, 1130, 940–950 CrossRef CAS.
- A.-C. Munteanu, M. Badea, R. Olar, L. Silvestro, C. Dulea, C.-D. Negut and V. Uivarosi, Synthesis and structural investigation of new bio-relevant complexes of lanthanides with 5-hydroxyflavone: DNA binding and protein interaction studies, Molecules, 2016, 21(12), 1737 CrossRef PubMed.
- S. Jahani, M. Noroozifar, M. Khorasani-Motlagh, M. Torkzadeh-Mahani and M. Adeli-Sardou, In vitro cytotoxicity studies of parent and nanoencapsulated holmium-2,9-dimethyl-1,10-phenanthroline complex toward fish-salmon DNA-binding properties and antibacterial activity, J. Biomol. Struct. Dyn., 2019, 37(17), 4437–4449, DOI:10.1080/07391102.2018.1557077.
- B. H. Hussein, H. A. Azab, M. F. El-Azab and A. I. El-Falouji, A novel anti-tumor agent, Ln(III) 2-thioacetate benzothiazole induces anti-angiogenic effect and cell death in cancer cell lines, Eur. J. Med. Chem., 2012, 51, 99–109 CrossRef CAS PubMed.
- J.-H. Wei, Z.-F. Chen, J.-L. Qin, Y.-C. Liu, Z.-Q. Li, T.-M. Khan, M. Wang, Y.-H. Jiang, W.-Y. Shen and H. Liang, Water-soluble oxoglaucine-Y(III), Dy(III) complexes: in vitro and in vivo anticancer activities by triggering DNA damage, leading to S phase arrest and apoptosis, Dalton Trans., 2015, 44(25), 11408–11419 RSC.
- K. Andiappan, A. Sanmugam, E. Deivanayagam, K. Karuppasamy, H.-S. Kim and D. Vikraman, In vitro cytotoxicity activity of novel Schiff base ligand–lanthanide complexes, Sci. Rep., 2018, 8(1), 3054 CrossRef PubMed.
- S. Akhavan, E. Assadpour, I. Katouzian and S. M. Jafari, Lipid nano scale cargos for the protection and delivery of food bioactive ingredients and nutraceuticals, Trends Food Sci. Technol., 2018, 74, 132–146 CrossRef CAS.
- S. Dianat, A. Bordbar, S. Tangestaninejad, B. Yadollahi, S. Zarkesh-Esfahani and P. Habibi, In vitro antitumor activity of parent and nano-encapsulated mono cobalt-substituted Keggin polyoxotungstate and its ctDNA binding properties, Chem.-Biol. Interact., 2014, 215, 25–32 CrossRef CAS PubMed.
- Z. Aramesh-Boroujeni, M. Khorasani-Motlagh and M. Noroozifar, Multispectroscopic DNA-binding studies of a terbium(III) complex containing 2,2′-bipyridine ligand, J. Biomol. Struct. Dyn., 2016, 34(2), 414–426 CrossRef CAS PubMed.
- Z. Aramesh-Boroujeni, A.-K. Bordbar, M. Khorasani-Motlagh, N. Fani, E. Sattarinezhad and M. Noroozifar, Computational and experimental study on the interaction of three novel rare earth complexes containing 2,9-dimethyl-1,10-phenanthroline with human serum albumin, J. Iran. Chem. Soc., 2018, 15(7), 1581–1591, DOI:10.1007/s13738-018-1356-5.
- Z. Aramesh-Boroujeni, A.-K. Bordbar, M. Khorasani-Motlagh, E. Sattarinezhad, N. Fani and M. Noroozifar, Synthesis, characterization, and binding assessment with human serum albumin of three bipyridine lanthanide(III) complexes, J. Biomol. Struct. Dyn., 2019, 37(6), 1438–1450, DOI:10.1080/07391102.2018.1464959.
- Z. Aramesh-Boroujeni, S. Jahani, M. Khorasani-Motlagh, K. Kerman, N. Aramesh, S. Asadpour and M. Noroozifar, Experimental and theoretical investigations of Dy(III) complex with 2,2′-bipyridine ligand: DNA and BSA interactions and antimicrobial activity study, J. Biomol. Struct. Dyn., 2019, 1–18, DOI:10.1080/07391102.2019.1689170.
- Z. Aramesh-Boroujeni, S. Jahani, M. Khorasani-Motlagh, K. Kerman and M. Noroozifar, Evaluation of DNA, BSA binding, DNA cleavage and antimicrobial activity of ytterbium(III) complex containing 2,2'-bipyridine ligand, J. Biomol. Struct. Dyn., 2020, 38(6), 1711–1725, DOI:10.1080/07391102.2019.1617788.
- Z. Aramesh-Boroujeni, S. Jahani, M. Khorasani-Motlagh, K. Kerman and M. Noroozifar, Evaluation of parent and nano-encapsulated terbium(III) complex toward its photoluminescence properties, FS-DNA, BSA binding affinity, and biological applications, J. Trace Elem. Med. Biol., 2020, 61, 126564, DOI:10.1016/j.jtemb.2020.126564.
- H.-J. Yu, S.-M. Huang, L.-Y. Li, H.-N. Jia, H. Chao, Z.-W. Mao, J.-Z. Liu and L.-N. Ji, Synthesis, DNA-binding and photocleavage studies of ruthenium complexes [Ru(bpy)2(mitatp)]2+ and [Ru(bpy)2(nitatp)]2+, J. Inorg. Biochem., 2009, 103(6), 881–890, DOI:10.1016/j.jinorgbio.2009.03.005.
- J.-H. Shi, Q. Wang, D.-Q. Pan, T.-T. Liu and M. Jiang, Characterization of interactions of simvastatin, pravastatin, fluvastatin, and pitavastatin with bovine serum albumin: multiple spectroscopic and molecular docking, J. Biomol. Struct. Dyn., 2017, 35(7), 1529–1546 CrossRef CAS PubMed.
- F. Neese, The ORCA program system, Wiley Interdiscip. Rev.: Comput. Mol. Sci., 2012, 2(1), 73–78 CAS.
- G. M. Morris, D. S. Goodsell, R. S. Halliday, R. Huey, W. E. Hart, R. K. Belew and A. J. Olson, Automated docking using a Lamarckian genetic algorithm and an empirical binding free energy function, J. Comput. Chem., 1998, 19(14), 1639–1662 CrossRef CAS.
- Y. Yu, Y. Huang, L. Zhang, Z. Lin and G. Wang, Growth and Spectral Assessment of Yb3+-Doped KBaGd (MoO4)3 Crystal: A Candidate for Ultrashort Pulse and Tunable Lasers, PLoS ONE, 2013, 8, e54450 CrossRef CAS PubMed.
- X. M. Ferré, Crystal growth, optical characterisation and laser operation of Yb3+ in monoclinic double tungstates, Rovira i Virgili University, 2004 Search PubMed.
- D. He, L. Wang, L. Wang, X. Li and Y. Xu, Spectroscopic studies on the interactions between novel bisnaphthalimide derivatives and calf thymus DNA, J. Photochem. Photobiol., B, 2017, 166, 333–340, DOI:10.1016/j.jphotobiol.2016.12.003.
- N. Shahabadi, M. Hakimi, T. Morovati, M. Falsafi and S. M. Fili, Experimental and molecular modeling studies on the DNA-binding of diazacyclam-based acrocyclic copper complex, J. Photochem. Photobiol., B, 2017, 167, 7–14 CrossRef CAS PubMed.
- E. Moradinia, M. Mansournia, Z. Aramesh-Boroujeni and A. K. Bordbar, New transition metal complexes of 9,10-phenanthrenequinone p-toluyl hydrazone Schiff base: Synthesis, spectroscopy, DNA and HSA interactions, antimicrobial, DFT and docking studies, Appl. Organomet. Chem., 2019, 33(5), e4893, DOI:10.1002/aoc.4893.
- J. R. Lakowicz and G. Weber, Quenching of fluorescence by oxygen. Probe for structural fluctuations in macromolecules, Biochemistry, 1973, 12(21), 4161–4170 CrossRef CAS PubMed.
- Q. Wang, C.-r. Huang, M. Jiang, Y.-y. Zhu, J. Wang, J. Chen and J.-h. Shi, Binding interaction of atorvastatin with bovine serum albumin: Spectroscopic methods and molecular docking, Spectrochim. Acta, Part A, 2016, 156, 155–163 CrossRef CAS PubMed.
- J.-H. Shi, Y.-Y. Lou, K.-L. Zhou and D.-Q. Pan, Exploration of intermolecular interaction of calf thymus DNA with sulfosulfuron using multi-spectroscopic and molecular docking techniques, Spectrochim. Acta, Part A, 2018, 204, 209–216 CrossRef CAS PubMed.
- X.-M. Dong, Y.-Y. Lou, K.-L. Zhou and J.-H. Shi, Exploration of association of telmisartan with calf thymus DNA using a series of spectroscopic methodologies and theoretical calculation, J. Mol. Liq., 2018, 266, 1–9 CrossRef CAS.
- F. Jalali and P. S. Dorraji, Interaction of anthelmintic drug (thiabendazole) with DNA: Spectroscopic and molecular modeling studies, Arabian J. Chem., 2017, 10, S3947–S3954, DOI:10.1016/j.arabjc.2014.06.001.
- A. Mukherjee, S. Mondal and B. Singh, Spectroscopic, electrochemical and molecular docking study of the binding interaction of a small molecule 5H-naptho[2,1-f][1,2]oxathieaphine 2,2-dioxide with calf thymus DNA, Int. J. Biol. Macromol., 2017, 101, 527–535 CrossRef CAS PubMed.
- S. Yadav, I. Yousuf, M. Usman, M. Ahmad, F. Arjmand and S. Tabassum, Synthesis and spectroscopic characterization of diorganotin(IV) complexes of N′-(4-hydroxypent-3-en-2-ylidene) isonicotinohydrazide: chemotherapeutic potential validation by in vitro interaction studies with DNA/HSA, DFT, molecular docking and cytotoxic activity, RSC Adv., 2015, 5(63), 50673–50690 RSC.
- A. Haque, I. Khan, S. I. Hassan and M. S. Khan, Interaction studies of cholinium-based ionic liquids with calf thymus DNA: spectrophotometric and computational methods, J. Mol. Liq., 2017, 237, 201–207 CrossRef CAS.
- U. Chaveerach, A. Meenongwa, Y. Trongpanich, C. Soikum and P. Chaveerach, DNA binding and cleavage behaviors of copper(II) complexes with amidino-O-methylurea and N-methylphenyl-amidino-O-methylurea, and their antibacterial activities, Polyhedron, 2010, 29(2), 731–738, DOI:10.1016/j.poly.2009.10.031.
- X.-W. Li, X.-H. Zhao, Y.-T. Li and Z.-Y. Wu, Synthesis and crystal structure of bicopper(II) complexes: The influence of bridging ligands on DNA/BSA binding behaviors and in vitro antitumor activity, Inorg. Chim. Acta, 2019, 488, 219–228 CrossRef CAS.
- G.-F. Shen, T.-T. Liu, Q. Wang, M. Jiang and J.-H. Shi, Spectroscopic and molecular docking studies of binding interaction of gefitinib, lapatinib and sunitinib with bovine serum albumin (BSA), J. Photochem. Photobiol., B, 2015, 153, 380–390 CrossRef CAS PubMed.
- J. B. Xiao, J. W. Chen, H. Cao, F. L. Ren, C. S. Yang, Y. Chen and M. Xu, Study of the interaction between baicalin and bovine serum albumin by multi-spectroscopic method, J. Photochem. Photobiol., A, 2007, 191(2–3), 222–227 CrossRef CAS.
- X.-B. Fu, Z.-H. Lin, H.-F. Liu and X.-Y. Le, A new ternary copper(II) complex derived from 2-(2′-pyridyl) benzimidazole and glycylglycine: Synthesis, characterization, DNA binding and cleavage, antioxidation and HSA interaction, Spectrochim. Acta, Part A, 2014, 122, 22–33 CrossRef CAS PubMed.
- U. Katrahalli, B. C. Yallur, D. H. Manjunatha and P. M. Krishna, BSA interaction and DNA cleavage studies of anti-bacterial benzothiazol-2-yl-malonaldehyde, J. Mol. Struct., 2019, 1196, 96–104 CrossRef CAS.
- Y.-Y. Lou, K.-L. Zhou, D.-Q. Pan, J.-L. Shen and J.-H. Shi, Spectroscopic and molecular docking approaches for investigating conformation and binding characteristics of clonazepam with bovine serum albumin (BSA), J. Photochem. Photobiol., B, 2017, 167, 158–167 CrossRef CAS PubMed.
- L. Zarei, Z. Asadi, M. Dusek and V. Eigner, Homodinuclear Ni(II) and Cu(II) Schiff base complexes derived from O-vanillin with a pyrazole bridge: Preparation, crystal structures, DNA and protein (BSA) binding, DNA cleavage, molecular docking and cytotoxicity study, J. Photochem. Photobiol., A, 2019, 374, 145–160 CrossRef CAS.
- A. T. Buddanavar and S. T. Nandibewoor, Multi-spectroscopic characterization of bovine serum albumin upon interaction with atomoxetine, J. Pharm. Anal, 2017, 7(3), 148–155 CrossRef PubMed.
- S. Budagumpi, N. V. Kulkarni, G. S. Kurdekar, M. Sathisha and V. K. Revankar, Synthesis and spectroscopy of CoII, NiII, CuII and ZnII complexes derived from 3,5-disubstituted-1H-pyrazole derivative: a special emphasis on DNA binding and cleavage studies, Eur. J. Med. Chem., 2010, 45(2), 455–462 CrossRef CAS PubMed.
- K. B. Gudasi, V. C. Havanur, S. A. Patil and B. R. Patil, Antimicrobial study of newly synthesized lanthanide(III) complexes of 2-[2-hydroxy-3-methoxyphenyl]-3-[2-hydroxy-3-methoxybenzylamino]-1,2-dihydroquinazolin-4 (3H)-one) complexes of 2-[2-hydroxy-3-methoxyphenyl]-3-[2-hydroxy-3-methoxybenzylamino]-1,2-dihydroquinazolin-4 (3H)-one, Met.-Based Drugs, 2007, 2007, 037348–037355 Search PubMed.
- D. Yinhua, M. M. Foroughi, Z. Aramesh-Boroujeni, S. Jahani, M. Peydayesh, F. Borhani, M. Khatami, M. Rohani, M. Dušek and V. Eigner, Synthesis, characterization, DNA/BSA/HSA interactions, molecular modeling, antibacterial and in vitro cytotoxic activities of a novel parent and niosome nano-encapsulated Ho(III) complex, RSC Adv., 2020 10.1039/d0ra03436c.
Footnote |
| † Electronic supplementary information (ESI) available. See DOI: 10.1039/d0ra03895d |
| This journal is © The Royal Society of Chemistry 2020 |

