 Open Access Article
Development of sulfide, nitrogen co-doping hollow carbon with wideband electromagnetic absorption capability
Wenli Bao†
 ab,
Cong Chen†ac and
Zhenjun Si*a
aSchool of Materials Science and Engineering, Changchun University of Science and Technology, No. 7989, Weixing Road, Changchun, 130022, PR China. E-mail: zdbwl@163.com
bCriminal Investigation Department, Jilin Police College, Changchun 130117, PR China
cSchool of Physics and Electronic Information Engineering, Qinghai Nationalities University, Xining 810007, PR China
First published on 12th June 2020
Abstract
Exploration of an economic, easy-producing method to develop high-performance electromagnetic absorber has been a global research interest, owing to the increasingly electromagnetic pollution and interference. In this work, sulfide, nitrogen co-doping carbon (NS–HCS) has been successfully prepared by an in situ copolymer and subsequent calcination reaction. The morphologies and phase compositions of these as-prepared samples are analyzed via the transmission electron microscopy (TEM), element mappings, X-ray diffraction (XRD) and X-ray photoelectron spectrum (XPS). The result confirms the hollow shaped structure of amorphous carbon is constructed with various types of N, S based covalent bonds. The dotted N and S elements are contribution for the conductive loss and dipole polarization relaxation behavior. The minimum reflection loss value of −34 dB, and effective bandwidth reaches 6.8 GHz with only 1.6 mm. The as-prepared wideband electromagnetic absorber will pave a simple and effective method to obtain lightweight, broadband and thin thickness electromagnetic absorption materials.
1. Introduction
Recently, the extensive application of wireless technology has become a serious social problem, because the yielded electromagnetic radiation is not only possessing a damage to human being's health, but also interfere the operating of neighboring electronics.1–3 Therefore, there are on-going interests on exploration of electromagnetic absorbing materials, that aims to reduce the electromagnetic pollution by either magnetic or dielectric loss ability.4 To satisfy the commercial application, an excellent material is requested to be lightweight, high absorption capacity, thin and broad absorption bandwidth and so on.5,6 Early researches were mainly focused on the magnetic and dielectric hybridized absorbers, such as Fe3C/Fe3O4, Co2Fe2O4/graphene, Fe/C etc.7–9 To further strengthen the EM wave absorption ability, continues efforts have been made on the nanostructure, which are also affect the EM absorption performance. However, these reported materials are difficult to satisfy the lightweight feature, which reflected in the big density and higher content of filler.10 To be specific magnetic/dielectric hybridized absorbers often contains magnetic metal, so that gaining a high density. For certain commercial application, these developed magnetic/dielectric hybridized absorbers should mix with paraffin wax or epoxy resin in a certain weight.11 Nevertheless, to result in a good EM absorption performance, the weight of magnetic/dielectric hybridized absorber is usually greater than 50 wt%, which will enhance the weight of formed coating layer.12 In addition, the synthesis of magnetic/dielectric hybridized absorbers involve more than steps.13 Owing to these drawbacks, it extremely restricts the commercial value of magnetic/dielectric hybridize absorbers.To get an ideal absorber, more and more interests have been focused on the carbon material. In particularly for the amorphous carbon, it showing moderately permittivity value, controlled dielectric loss ability, easy-production, can be used as a desirable candidate as the electromagnetic absorber.14–16 Recent progress reveals that producing the hollow nanostructure of carbon not only attributes to the higher EM wave absorption, but also benefits for its low density.17 Based on the case of Yang group, carbon material designed into hollow one with 230 nm in diameter, the optimized absorption intensity (reflection loss, RL) was nearly −12.5 dB, which was three times stronger than solid one.18 Qiang et.al. reported a yolk–shell shaped C@C microsphere, with an optimized RL value of ∼−39.4 dB.19 Although showing the improved EM performance, the frequency width with RL < −10 dB is not desirable (<1.0 GHz). It is due to the fact that hollow structure would reduce the dielectric loss value (ε′′).20
To increase the ε′′ value, the method of element doping strategy has been confirmed as the most efficiently and easy way to broaden the absorption. Chen et.al. synthesized of sulfide-doped graphene, with an effectively absorption region of 2.0 GHz.21 Cao et.al. explained that the dotted S element graphene has boosted dipole relaxation behavior, thus makes contribution for the EM absorption ability.22 It is unfortunate that the frequency band for occurring dipole relaxation behavior is always narrow, thus the improvement in ε′′ is limited.23 As for another part of dielectric loss, the conductive loss value still possesses decreases tendency.
To further enlarger the ε′′ value, in this article, the S and N dual dotted hollow carbon were successfully made by a facile method, involving the in situ polymerization and carbonized method. The role of dotted N and S plays a key role on the conductive loss and dipole relaxation process, which reflected in the increased ε′′ value. The optimized sample exhibits a strong EM absorption captivity. We believe that the as-prepared N, S co-dotted hollow carbon sphere can be an ideal candidate as the lightweight, wideband microwave absorber.
2. Experimental
2.1 Synthesis of N, S-co-dotted hollow carbon sphere (SNHC)
The hollow structure with S, N dotted carbon was prepared by a template and solve thermal method, the 200 nm-SiO2, sulfide and ammonium carbonate ((NH4)2CO3) as the templates, sulfide and nitrogen raw. In a typically synthesis of SNHC sample, 2.9 mL of tetraethyl orthosilicate (TEOS) was added into the solution containing 10 mL of H2O, 30 mL ethanol and 1.5 mL of ammonia aqueous solution (NH3·H2O). After stirring 10 min, 0.25 g resorcinol, 0.23 ml of formaldehyde, 0.1 g (NH4)2CO3 and 20 mg sulfide were co-added into the above solution and stirring for another 5 min. Afterward, the solution was transferred into a Teflon-lined stainless steel autoclave and heated at 120 °C for 4 h. After naturally cooling to room temperature, the resultant precipitation was washed with ethanol for 3–5 times. The as-prepared precipitation was carbonized at 800 °C, under an N2 atmosphere or 2 h with a heating rate of 5.0 °C min−1. Lastly, S, N dotted hollow carbon was obtained. For comparison, the S, N dotted solid carbon, N dotted hollow carbon and S dotted hollow carbon have been made, and denoted as SNSC, SHC and NHC, respectively.2.2 Characterization
The hollow shaped structure and element mappings of these carbon materials are characterized by transmission electron microscopy (TEM; F200F, FEI-Tecnai, USA). The covalent bonds and crystal structures of carbon were recorded via an X-ray photoelectron spectroscopy (XPS, PHI 5000 VersaProbe systems), X-ray diffractometer (Bruker D8 ADVANCE X-ray diffractometer) and Raman spectrum (Jobin Yvon HR 800 confocal Rama system). EM characteristics were measured on basis of a coaxial-line theory. In details, the composites used for the EM absorption measurement were prepared by mixing the dotted carbon with paraffin wax in a weight ratio of 10 wt%. Afterwards, a cylindrical shaped sample (Φin = 3.04 mm, Φout = 7.0 mm) was produced by hot-pressing the mixture into a specific mold. Subsequent, electromagnetic parameters were tested by the two-port vector network analyzer (VAN, Agilent E5071C). Lastly, the reflection loss value (RL) was calculated, according to following formulas:24,25
Zin = Zo(μr/εr)1/2tan![[thin space (1/6-em)]](https://www.rsc.org/images/entities/char_2009.gif) h[j(2πfd(μrεr)1/2/c)] h[j(2πfd(μrεr)1/2/c)]
| (1) |
RL (dB) = 20![[thin space (1/6-em)]](https://www.rsc.org/images/entities/char_2009.gif) log log![[thin space (1/6-em)]](https://www.rsc.org/images/entities/char_2009.gif) |(Zin − Zo)/(Zin + Zo)| |(Zin − Zo)/(Zin + Zo)|
| (2) |
3. Results and discussion
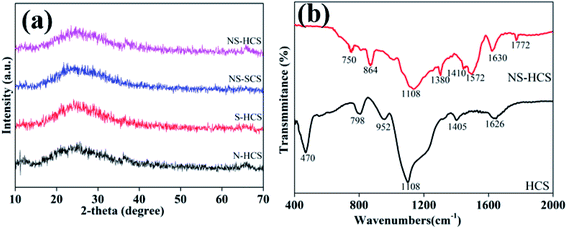
Fig. 1a shows the XRD patterns of these carbon materials. Clearly, two characteristic peaks of carbon material at 22.4 and 46° can be observed for N–HCS, S–NCS, NS–SCS and NS–HCS samples. Besides, the diffraction intensity is relatively width, which is attributed to the non-crystalline state. Aiming to gain a deep understanding of the changes of covalent bonds, the FT-IR spectra of pure hollow carbon sphere (denoted as HCS) and NS–HCS are compared in Fig. 1b. As for HCS, typical stretching vibration peaks at 470, 798, 952, 1108, 1405 and 1626 cm−1 are corresponded to –C![[double bond, length as m-dash]](https://www.rsc.org/images/entities/char_e001.gif) O, C–C, –C = -C, –COH, –C–H, –COOH bonds,26 respectively. After dotted by N and S atoms, the C–S, C–SO4, C–N, C
O, C–C, –C = -C, –COH, –C–H, –COOH bonds,26 respectively. After dotted by N and S atoms, the C–S, C–SO4, C–N, C![[double bond, length as m-dash]](https://www.rsc.org/images/entities/char_e001.gif) N and C–N
N and C–N![[double bond, length as m-dash]](https://www.rsc.org/images/entities/char_e001.gif) S are existed at the 864, 1380, 1410, 1572, 1772 cm−1.27 Due to these S and N-containing covalent bonds, it indicates the N and S have been successfully dotted on the hollow carbon sphere. X-ray photoelectron energy spectra (XPS) was used to detect the NS–HCS sample. In Fig. 2a, evident characteristic signal peaks of N, O, S and C can be obtained from the survey spectra. Meanwhile, the dotted amounts of N and S are 5.6 and 7.9 wt%, respectively. As shown in Fig. 2b, the deconvoluted N1s spectrum have three typical peaks, the first two peaks mainly located at 397.2 and 398 eV, assigning to the pyrrolic and graphitic types of N. Another peak at 398.9 eV is corresponding to pyridine N. The S 2p could be divided into three peaks at 162.2, 163.9, 168.1 eV, which are ascribed to valance bonds of C–S–O, C–SOx and C–S–C, respectively (Fig. 2c).28 As plotted in Fig. 2d, the fitted C 1s peaks are corresponding to sp2 C, C–N, C–O and C–S bonds. Commonly, the exhibited C–S or C–N bonds have a greatly influences on the dielectric behavior, which was due to the existed dipole relaxation behavior.29
S are existed at the 864, 1380, 1410, 1572, 1772 cm−1.27 Due to these S and N-containing covalent bonds, it indicates the N and S have been successfully dotted on the hollow carbon sphere. X-ray photoelectron energy spectra (XPS) was used to detect the NS–HCS sample. In Fig. 2a, evident characteristic signal peaks of N, O, S and C can be obtained from the survey spectra. Meanwhile, the dotted amounts of N and S are 5.6 and 7.9 wt%, respectively. As shown in Fig. 2b, the deconvoluted N1s spectrum have three typical peaks, the first two peaks mainly located at 397.2 and 398 eV, assigning to the pyrrolic and graphitic types of N. Another peak at 398.9 eV is corresponding to pyridine N. The S 2p could be divided into three peaks at 162.2, 163.9, 168.1 eV, which are ascribed to valance bonds of C–S–O, C–SOx and C–S–C, respectively (Fig. 2c).28 As plotted in Fig. 2d, the fitted C 1s peaks are corresponding to sp2 C, C–N, C–O and C–S bonds. Commonly, the exhibited C–S or C–N bonds have a greatly influences on the dielectric behavior, which was due to the existed dipole relaxation behavior.29
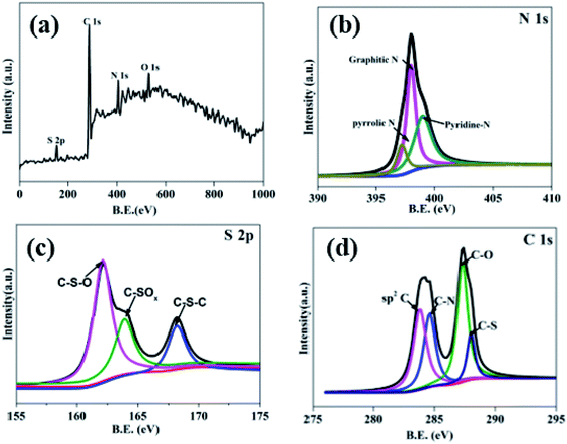 | ||
| Fig. 2 (a) XPS spectra survey spectrum of the as-prepared NS–HCS sample and high resolution spectra of (b) N 1s, (c) S 2p and (d) C 1s. | ||
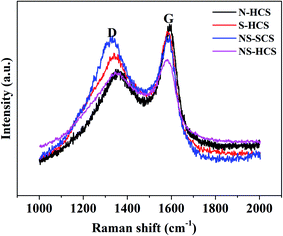
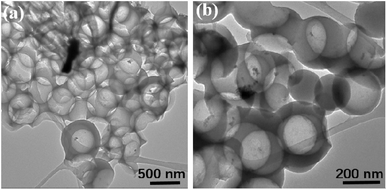
Apart from the changes of chemical bond, the influence of dotted element on the graphitization level will also plays a key role on in the dielectric behavior, where a higher graphitization can boost the conductivity loss of carbon components and further lead to an enhancement in the total dielectric value. To reveal the varied graphitization degree, Raman spectra of N–HCS, S–HCS, NS–SCS and NS–HCS are provided in Fig. 3. It is clear that all of these samples display two distinguishable peaks. The two peaks about 1350 and 1590 cm−1 can be assigned to the D-band from amorphous carbon and the G-band from graphited carbon.30–33 Commonly, the ratio of D and G band is stand for the graphitization level. Herein, the D/G ratios of N–HCS, S–HCS, NS–SCS and NS–HCS are estimated to 0.89, 0.9, 0.99 and 0.96, respectively. Hence, it can be deduced that N and S co-dotted carbon have a higher graphitization level. As compared to the solid one, the hollow structure with identical dotted element would lead to the low D/G ratio. According to the dielectric theory, a higher graphitization level can make contribution for the conductive loss. The structural information of the NS–HCS are characterized by TEM image. As seen in Fig. 4a and b, the as-obtained NS–HCS possess a hollow spherical structure with ∼210 nm in diameter and 23 nm in shell thickness.
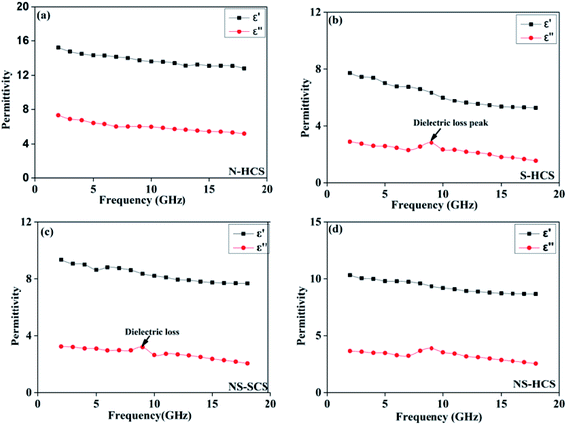
The permittivity of these dotted carbon composites is measured by the coaxial-line method. The frequency dependent of real part (ε′) and imaginary part (ε′′) of permittivity are plotted in Fig. 5. Usually, the term ε′ is highly associated with the energy storage, and ε′′ presents the dielectric dissipation ability, which was attributed to two factors, namely conductivity and polarization relaxation loss.34–37 As shown in Fig. 5a, ε′ value of N–HCS possess a declining tendency from 15.3–12.3 in the whole 2–18.0 GHz region. As compared to N–HCS, ε′ of S dotted HCS sample was smaller, but decreasing from 7.8 to 5.3 with increasing frequency, as depicted in Fig. 5b. The ε′ of NS–SCS is in the range of 9.3–7.7 over 2–18 GHz with slight fluctuation, which was greater than the S–HCS, as seen in Fig. 5c. As for NS–HCS, it's ε′ value slowly decrease from 10.3 to 8.8 (Fig. 5d). It implies that the types of dotted elements greatly affect the ε′ value. More importantly, the hollow shaped structure also attributes to a higher ε′ value. Concerning ε′′ value, N–HCS sample sharply decrease from 7.4 at 2.0 GHz to 6.0 at 8.1 GHz, and then slightly decrease. In whole ε′′ curve, it has not any dielectric loss peak, suggesting that conductive loss plays a dominant role on the dielectric loss. When rising the frequency, it is interesting that the ε′′ value of S–HCS appears a peak at 8.8 GHz, which would be caused by the dipole relaxation loss behaviors. However, ε′′ value of S-dotted HSC is significantly smaller than that of N–HCS. It implies that the HCS dotted by N elements has a larger conductive loss ability, but weaken in the dipole polarization. Similarly, ε′′ of NS–HCS and NS–SCS have one dielectric loss peak at 8.7 and 8.9 GHz, respectively. The ε′′ value of NS–HCS is 4.0–2.7, which is larger than that of NS–HCS (3.3–2.1). To further confirm the dipole polarization, the Debye relaxation theory has been applied here to discuss polarization mechanism, which can be expressed by the following equation:38–40
 | (3) |
 | (4) |
 | (5) |
Based on the eqn (4) and (5), the ε′–ε′′ presented as follows:
| (ε′ − ε∞)2 + (ε′′)2 = (εs − ε∞)2 | (6) |
If the plot of ε′–ε′′ exhibits a semicircle, it is related to one Debye polarization relaxation process which make a contribution for ε′′. In common, each semicircle corresponds to one Debye relaxation process. Fig. 6 gives the ε′–ε′′ curve of these carbon absorber. We can observe that N-dotted HCS has no conspicuous semicircle in the curve, but one for S–HCS, NS–SCS and NS–HCS. Based on the Debye-theory, some conclusions cab be come up as follows:
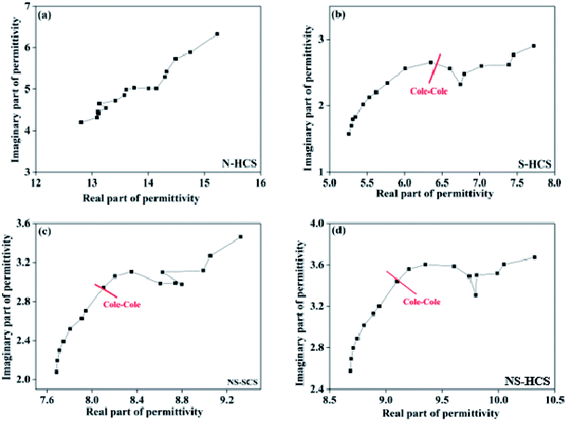 | ||
| Fig. 6 The corresponding plots of ε′′ versus ε′ for these carbon materials: (a) N–HCS, (b) S–HCS, (c) NS–SCS, (d) NS–HCS. | ||
(1) The dotted S element has a contribution for the dipole polarization relaxation, which would lead to a big ε′′ value at high frequency region.
(2) The dotted N element makes a contribution for the conductive loss, and in a result of enhancement of ε′′ value.
(3) As compared to solid one, hollow carbon one has a greater ε′ and ε′′ value.
The enhanced conductively loss would be caused by the enhancing conductivity after adopting N doping strategy. In details, the C replaced by N element possess an improvement of carrier density, it is because that N element has five valence electrons, which is larger than carbon atom (4). Hence, N dotted C actually increase the conductivity, hence reflecting in the higher conductive loss, based on the recent advance. Different from the S element, the radius of N is much closer to C, thus enables to form the graphited N, which inserted into the graphitized area of C and formed three symmetrical C–N covalence bonds. Due to the symmetry, it is not benefits to the dipole polarization. While for S doping, the formed C–S or C–SO4 dipolar bonds are asymmetric and can act as the dipole center. When giving electromagnetic field, these dipoles are help for the dipole polarization. Considering the structure, the hollow one gaining a higher ε′′ value, which may due to the enhanced graphitized degree. It is because that carbon sphere designed into hollow structure, can remarkably increase the specific area. During conducting carbonization reaction, it is easier to gain a high graphitized degree. To evaluate the microwave absorption performance, reflection loss value and response bandwidth are two important points for a desirable absorber, and the effective absorption bandwidth (termed as fc) will be more important once the RL value lower than −10 dB, because the absorption efficiency is considered to be an acceptable range of 90%.41–43 In addition, the thickness of absorption thickness is suggested to smaller than 2.0 mm, aiming to satisfy commercial application. On the basis of the tested of permittivity value, the reflection loss (RL) of these carbons can be tested based on the transmission line theory.44 Fig. 7a shows the calculated reflection curves of N–HCS with a thickness < 2.0 mm in the frequency region of 2–18 GHz. It is noted that the frequency of the RL peak gradually can be driven towards lower frequency region with the increase of thickness. Such a physical mechanism can be fully understood by the quarter-wavelength theory:45–47
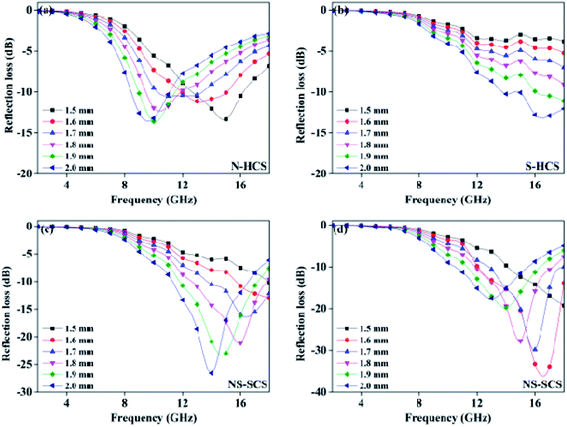
| fR = nc/4d(εrμr)1/2 (n = 1, 3, 5, 7) | (7) |
| Filler | Matrix | Filler loading ratio (wt%) | RLmin (dB) | fc (GHz) | Range (GHz) | Ref. |
|---|---|---|---|---|---|---|
| 3DOC | Wax | 5 | −45.8 (1.7 mm) | 4.8 (1.7 mm) | 12.8–17.6 | 48 |
| MCHS | Wax | 20 | −50.9 (3.2 mm) | 5.4 (3.2 mm) | 9.1–14.5 | 49 |
| C/MQDs | Wax | 30 | −26.2 (1.5 mm) | 5.8 (1.5 mm) | 9.0–14.8 | 50 |
| S Dotted C | Wax | 10 | −37.3 (2.0 mm) | 6.2 (2.5 mm) | 11.8–18.0 | 51 |
| PCHMs | Wax | 20 | −28.0 (2.6 mm) | 3 (2.0 mm) | 9–12.0 | 52 |
| RBC | Wax | 10 | −59.7 (2.5 mm) | 3.4 (2.0 mm) | 9.1–12.5 | 53 |
| PCHMs-10 | Wax | 10 | −51.8 (1.8 mm) | 6.0 (1.8 mm) | 12.0–18.0 | 54 |
| NS–HCS | Wax | 10 | −34 (1.6 mm) | 6.8 mm (1.6 mm) | 11.2–18.0 GHz | This work |
4. Conclusions
In summary, hollow shaped carbon dotted by N, and S elements have been synthesized by a facile in situ polarization method. The results reveal that the carbon sphere designed into hollow shaped structure achieves a higher graphitized level, which was greatly beneficial to the dielectric loss ability. To further stronger the dielectric loss ability, the N, and S element has been adopted on the hollow carbon structure which attributes to the conductive and dipole polarization loss. As a result, the integrated dielectric loss increases significantly, and hence enhancing the electromagnetic absorption performance. Based on the transmission-line measure theory, the optimized RL loss value could up to −34 dB with a fc of 6.8 GHz under a 1.6 mm. Utilization of element doping on hollow structure has bene confirmed as simple, economic way to development of lightweight, high performance electromagnetic absorption materials.Conflicts of interest
There are no conflicts to declare.Acknowledgements
The authors are grateful for the financial aids from the Science and Technology Foundation of Educational office of Jilin Province (Grant No. JJKHZ-2016-361), Natural Science Foundation of Qinghai Nationalities University (No. 2019XJZ07), and the Natural Science Foundation from Jilin Scientific and Technological Development Program (Grant No. 20170101190JC)References
- l. Abdalla, J. Y. Yu, Z. L. Li and B. Ding, Composites, Part B, 2018, 155, 397–404 CrossRef.
- H. L. Lv, Z. H. Yang, S. J. H. Ong, C. Wei, H. B. Liao, S. B. Xi, Y. H. Du, G. B. Ji and Z. C. J. Xu, Adv. Funct. Mater., 2019, 29, 1900163 CrossRef.
- A. L. Feng, T. Q. Hou, Z. R. Jia and G. L. Wu, RSC Adv., 2020, 18, 10510–10518 RSC.
- A. Elhassan, I. Abdalla, J. Y. Yu, Z. L. Li and B. Ding, Chem. Eng. J., 2020, 392, 123646 CrossRef CAS.
- I. Abdalla, A. Salim, M. M. Zhu, J. Y. Yu, Z. L. Li and B. Ding, ACS Appl. Mater. Interfaces, 2018, 10, 44561–44569 CrossRef CAS PubMed.
- H. L. Lv, H. Q. Zhang, J. Zhao, G. B. Ji and Y. W. Du, Nano Res., 2016, 9, 1813–1822 CrossRef CAS.
- Z. C. Lou, C. L. Yuan, Y. Zhang, Y. J. Li, J. B. Cai, L. T. Yang, W. K. Wang, H. Han and J. Zou, J. Alloys Compd., 2019, 775, 800–809 CrossRef CAS.
- L. Liu, N. He, T. Wu, P. B. Hu and G. X. Tong, Chem. Eng. J., 2019, 355, 103–108 CrossRef CAS.
- L. Huang, J. J. Li, Z. J. Wang, Y. B. Li, X. D. He and Y. Yuan, Carbon, 2019, 143, 507–516 CrossRef CAS.
- X. X. Wang, T. Ma, J. C. Shu and M. S. Cao, Chem. Eng. J., 2018, 332, 32–330 Search PubMed.
- D. Ding, Y. Wang, X. D. Li, R. Qiang, P. Xu, W. L. Chu, X. J. Han and Y. C. Du, Carbon, 2017, 111, 722–732 CrossRef CAS.
- Y. Guo, Y. Cheng, L. Y. Wang, B. Zhang, Y. Zhao and Z. Xu, J. Mater. Chem. C, 2017, 5, 491–512 RSC.
- N. Li, G. W. Huang, Y. Q. Li, H. M. Xiao, Q. P. Feng, N. Hu and S. Y. Fu, ACS Appl. Mater. Interfaces, 2017, 9, 2973–2983 CrossRef CAS PubMed.
- C. Q. Song, Y. W. Yin, M. K. Han, X. L. Li, Z. X. Hou, L. T. Zhang and L. F. Cheng, Carbon, 2017, 116, 50–58 CrossRef CAS.
- Y. Zhang, T. F. Zhang, H. C. Chang, P. S. Xiao, H. H. Chen, Z. Y. Huang and Y. S. Chen, Adv. Mater., 2015, 27, 2049 CrossRef CAS PubMed.
- X. Bai, Y. H. Zhai and Y. Zhang, J. Phys. Chem. C, 2011, 115, 11673–11677 CrossRef CAS.
- J. Qiu and T. T. Qiu, Carbon, 2015, 81, 20–28 CrossRef CAS.
- L. J. Yang, H. L. Lv, M. Li, Y. Zhang, J. C. Liu and Z. H. Yang, Chem. Eng. J., 2020, 392, 123666 CrossRef CAS.
- R. Qiang, Y. C. Du, Y. Wang, N. Wang, C. H. Tian, J. Ma, P. Xu and X. J. Han, Carbon, 2016, 98, 599–606 CrossRef CAS.
- L. L. Yan, M. Zhang, S. C. Zhao, T. J. Sun, B. Zhang, M. S. Cao and Y. Qin, Chem. Eng. J., 2020, 382, 122860 CrossRef.
- C. Chen, S. Z. Bao, B. S. Zhang, Y. Y. Zhou and S. M. Li, J. Alloys Compd., 2019, 770, 90–97 CrossRef CAS.
- B. Wen, M. S. Cao, M. M. Lu, W. Q. Cao, H. L. Shi, J. Liu, X. X. Wang, H. B. Jin, X. Y. Fang, W. Z. Wang and J. Yuan, Adv. Mater., 2014, 26, 3484 CrossRef CAS PubMed.
- J. W. Wang, B. B. Wang, A. L. Feng, Z. Jia and G. Wu, J. Alloys Compd., 2020, 83, 155092 CrossRef.
- N. Yang, J. Zeng, J. Xue, L. K. Zeng and Y. Zhao, J. Alloys Compd., 2018, 735, 2212–2218 CrossRef CAS.
- H. L. Lv, Z. H. Yang, P. L. Y. Wang, G. B. Ji, J. Z. Song, L. R. Zheng, H. B. Zeng and Z. C. J. Xu, Adv. Mater., 2018, 30, 1706343 CrossRef PubMed.
- L. X. Luo, C. Fu, F. Yang, F. Jiang, Y. Guo, F. Zhu, L. Yang and S. Shen, ACS Catal., 2020, 10, 1171–1184 CrossRef CAS.
- J. Zou, H. Shen, Z. Li, S. Zhang, Y. Zhao, X. Bi, Y. Wang, H. Cui and S. Zhuo, Electrochim. Acta, 2016, 209, 557–564 CrossRef.
- S. F. Huang, Z. P. Li, B. Wang, J. J. Zhang, Z. Q. Peng, R. J. Qi, J. Wang and Y. Zhao, Adv. Funct. Mater., 2018, 28, 1706294 CrossRef.
- X. Ma, X. Song, Z. Yu, S. Li and J. S. Gao, Carbon, 2019, 149, 646–654 CrossRef CAS.
- H. Lv, G. Ji, X. H. Liang, H. Q. Zhang and Y. W. Du, J. Mater. Chem. C, 2015, 3, 5056–5064 RSC.
- G. Wu, Y. H. Cheng, Z. Yang, Z. Jia, H. J. Wu, L. Yang, H. L. Li and P. Z. Guo, Chem. Eng. J., 2018, 333, 519–528 CrossRef CAS.
- Y. H. Guo, G. Wu, G. Ji, Y. Zhao and Z. Xu, ACS Appl. Mater. Interfaces, 2017, 9, 5660–5668 CrossRef PubMed.
- X. Zhang, F. Yan, S. Zhang, H. R. Yuan, C. L. Zhu, X. T. Zhang and Y. J. Chen, ACS Appl. Mater. Interfaces, 2018, 10, 24920–24929 CrossRef CAS PubMed.
- H. H. Liu, Y. J. Li, M. W. Yuan, G. B. Sun, H. F. Li, S. M. Ma, Q. L. Liao and Y. Zhang, ACS Appl. Mater. Interfaces, 2018, 10, 22591–22601 CrossRef CAS PubMed.
- H. Lv, X. H. Liang, G. B. Ji, H. Q. Zhang and Y. W. Du, ACS Appl. Mater. Interfaces, 2015, 7, 9776 CrossRef CAS PubMed.
- G. L. Wu, H. X. Zhang, X. X. Luo and L. Yang, J. Colloid. Inter. Sci., 2019, 536, 548–555 CrossRef CAS PubMed.
- X. Liang, G. Ji, H. Zhang and Y. Du, ACS Appl. Mater. Interfaces, 2015, 18, 9776–9783 Search PubMed.
- Z. C. Lou, R. Li, P. Wang, Y. Zhang, B. Chen, C. X. Huang, C. C. Wang, H. Han and Y. J. Li, Chem. Eng. J., 2020, 391, 123571 CrossRef CAS.
- G. Wu, Z. Jia, X. Zhou and G. Z. Nie, Composites, Part A, 2020, 128, 105687 CrossRef.
- H. L. Lv, Z. H. Yang, H. B. Xu, L. Y. Wang and R. B. Wu, Adv. Funct. Mater., 2020, 30, 1907251 CrossRef CAS.
- Y. Li, Z. R. Jia, L. J. Wang, X. Q. Guo, B. Zhao and R. Zhang, Composites, Part B, 2020, 196, 108122 CrossRef.
- H. X. Zhang, Z. R. Jia, Z. Zhou, C. H. Zhang, K. K. Wang and N. Liu, Compos. Commun., 2020, 19, 42–45 CrossRef.
- X. Liang, Y. Cheng, H. Zhang, D. Tang, B. Zhang and Y. Du, ACS Appl. Mater. Interfaces, 2015, 7, 4744–4750 CrossRef PubMed.
- I. Abdalla, J. L. Shen, J. Y. Yu, Z. L. Li and B. Ding, Sci. Rep., 2018, 8, 12402 CrossRef PubMed.
- X. F. Zhou, Z. R. Jia, A. L. Feng, S. L. Qu, X. Wang, X. H. Liu, B. B. Wang and G. Wu, J. Colloid Interface Sci., 2020, 575, 130–139 CrossRef CAS PubMed.
- Y. H. Guo, Y. Zhao and Z. Xu, ACS Appl. Mater. Interfaces, 2017, 9, 5660–5668 CrossRef PubMed.
- B. Zhao, J. S. Deng, C. X. Zhao, C. D. Wang, Y. G. Chen and M. Hamidinejad, J. Mater. Chem. C, 2020, 8, 58–70 RSC.
- Y. L. Yu, M. Wang, Y. Q. Bai, B. Zhang, L. L. An, J. Y. Zhang and B. Zhong, Chem. Eng. J., 2019, 375, 121914 CrossRef CAS.
- Y. Cheng, Z. Y. Li, Y. Li, S. S. Dai, G. B. Ji, H. Q. Zhao, J. M. Cao and Y. W. Du, Carbon, 2018, 127, 643–652 CrossRef CAS.
- G. L. Wu, Y. H. Cheng, Z. H. Yang, Z. R. Jia, H. J. Wu, L. J. Yang, H. L. Li and P. Z. Guo, Chem. Eng. J., 2018, 333, 519–528 CrossRef CAS.
- Y. Guo, Z. Yang, T. Guo, H. Wu, G. Liu, L. Wang and R. Wu, ACS Sustainable Chem. Eng., 2018, 6, 1539–1544 CrossRef.
- H. X. Zhang, B. B. Wang, A. L. Feng, N. Zhang, Z. R. Jia, Z. Y. Huang, X. H. Liu and G. L. Wu, Composites, Part B, 2010, 167, 690–699 CrossRef.
- H. L. Xu, X. W. Yin, M. H. Li, F. Ye, M. K. Han, Z. X. Hou, X. L. Li, L. T. Zhang and L. F. Cheng, Carbon, 2018, 132, 343–351 CrossRef CAS.
- H. X. Zhang, Z. R. Jia, A. L. Feng, Z. H. Zhou, C. H. Zhang, K. K. Wang, N. Liu and G. L Wu, Compos. Commun., 2020, 19, 42–50 CrossRef.
Footnote |
| † W.L. Bao and C. Chen contributed equally to this work. |
| This journal is © The Royal Society of Chemistry 2020 |

