 Open Access Article
Increasing the thermal conductivity of styrene butadiene rubber: insights from molecular dynamics simulation
Xiuying Zhaoabc,
Bozhi Fuabc,
Wenfeng Zhangabc,
Haoxiang Liabc,
Yonglai Luabc,
Yangyang Gao *abc and
Liqun Zhang
 *abc
*abc
aKey Laboratory of Beijing City on Preparation and Processing of Novel Polymer Materials, Beijing University of Chemical Technology, 10029, China. E-mail: gaoyy@mail.buct.edu.cn; zhanglq@mail.buct.edu.cn
bState Key Laboratory of Organic-Inorganic Composites, Beijing University of Chemical Technology, 100029, People's Republic of China
cKey Laboratory of Carbon Fiber and Functional Polymers, Ministry of Education, Beijing University of Chemical Technology, Beijing 100029, China
First published on 19th June 2020
Abstract
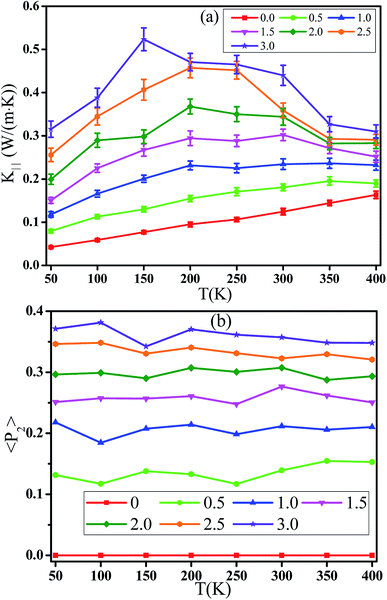
It is very important to improve the thermal conductivity of styrene butadiene rubber (SBR) which can widen its application. By employing reverse nonequilibrium molecular dynamics simulations in a full atomistic resolution, the effect of the composition ratio of styrene, temperature, and tensile strain on the thermal conductivity of SBR has been investigated in this work. The results indicate that the thermal conductivity of SBR gradually decreases with increasing composition ratio of styrene. This closely depends on the number of degrees of freedom and the diffusion coefficient of backbone atoms. Under the tensile field, the orientation of backbone bonds improves the thermal conductivity parallel to the tensile direction, but reduces the thermal conductivity perpendicular to it. Meanwhile, the thermal conductivity parallel to the tensile direction is enhanced with the strain rate while it is reduced with the composition ratio of styrene. Interestingly, there exists a linear relationship between the logarithm of anisotropy of the thermal conductivity and the orientation degree of bonds. Finally, the parallel thermal conductivity of the strained SBR first rises and then declines with temperature. This transition reflects a crossover from disorder to anharmonicity dominated phonon transport. Moreover, the transition temperature is gradually reduced with increasing strain which is attributed to the polymer orientation. In summary, this work provides some fundamental insights into the thermal transport processes in SBR with different composition ratios of styrene and temperature, especially under tensile strain.
1. Introduction
Fundamentally understanding thermal transport in polymers is essential for tuning thermal conductivity and accelerating their various applications such as thermal management and energy conversion.1,2 In general, polymer materials have a very low thermal conductivity of 0.1–0.5 W m−1 K−1 at room temperature due to phonon scattering from numerous defects.3 Even though engineering the thermal conductivity of polymer materials is of great technical importance, it remains a big challenge until now.It is reported that the weak couplings between the polymer chains and their random orientation are two main reasons accounting for their low thermal conductivity.4 Thus, various methods have been proposed and tried to enhance the thermal transfer in polymer materials. One method is to add the highly thermal conductive fillers into the polymers to improve their thermal conductivity.5,6 However, this enhancement for the thermal transport is always inhibited because of the interfacial thermal resistance and the bad dispersion of fillers. The structure of polymer chains could also play an important role in the thermal conductivity. Generally, the stiff polymers with double –C![[double bond, length as m-dash]](https://www.rsc.org/images/entities/char_e001.gif) C– bonds and the conjugated π-bond on the backbone result in a higher thermal conductivity due to their high bonding energy.7,8 Meanwhile, the thermal transport through covalent bonds is found to dominate the thermal conductivity than other contributions from the non-bonding interactions and the translation of molecules.9 In addition, the thermal conductivity of polymer is found to decrease when side-chains are introduced which results from the phonon localization and phonon scatterings.10,11 Interestingly, side-chains could also enhance the thermal conductivity of conjugated polymers due to the increase of their structural order.12,13 Furthermore, enhancing inter-chain coupling strength could potentially produce a higher thermal conductivity of polymers. The thermal conductivity of polymer salts (poly(vinylsulfonic acid Ca salt)) is reported to be 0.67 W m−1 K−1 due to the relative strong electrostatic forces between the ions in different polymer chains.14 Hydrogen bond is a strong electrostatic interaction between the proton and the lone electron pair(s) in O, N and F atom.15–17 The improvement of thermal conductivity is mainly attributed to the hydrogen bond which can help to form continuous thermal networks to provide more heat-transfer pathways. Similarly, crosslinks can form efficient thermal conduction pathways and networks by connecting polymer chains with covalent bonds which improves the thermal conductivity.18,19 Moreover, the dependence of thermal conductivity of polyethylene (PE) on the temperature has been investigated which exhibits a consistent trend with the radius of gyration of chains.20 Meanwhile, random orientation of the polymer chains can shorten the mean-free path of the phonons, which are the major energy carriers in polymers. Thus, another effective method to improve the thermal conductivity is to stretch the polymers which can enhance the order of chain orientation. For example, the thermal conductivity of the ultrahigh molecular weight PE can exceed 40 W m−1 K−1 when the drawing ratio is beyond 300.21 Shen et al.22 obtained a higher drawing ratio (400) and produced a PE nanofiber with a higher thermal conductivity of 104 W m−1 K−1. In addition, the thermal conductivity of the electrospinning polystyrene (PS) nanofibers is found to be between 6.6 and 14.4 W m−1 K−1 which is much larger than that (∼0.15 W m−1 K−1) of bulk PS due to their preferential alignment.23 The enhancement of thermal conductivity of polymers has also been observed by molecular dynamics simulation which is related to the polymer alignment.24,25
C– bonds and the conjugated π-bond on the backbone result in a higher thermal conductivity due to their high bonding energy.7,8 Meanwhile, the thermal transport through covalent bonds is found to dominate the thermal conductivity than other contributions from the non-bonding interactions and the translation of molecules.9 In addition, the thermal conductivity of polymer is found to decrease when side-chains are introduced which results from the phonon localization and phonon scatterings.10,11 Interestingly, side-chains could also enhance the thermal conductivity of conjugated polymers due to the increase of their structural order.12,13 Furthermore, enhancing inter-chain coupling strength could potentially produce a higher thermal conductivity of polymers. The thermal conductivity of polymer salts (poly(vinylsulfonic acid Ca salt)) is reported to be 0.67 W m−1 K−1 due to the relative strong electrostatic forces between the ions in different polymer chains.14 Hydrogen bond is a strong electrostatic interaction between the proton and the lone electron pair(s) in O, N and F atom.15–17 The improvement of thermal conductivity is mainly attributed to the hydrogen bond which can help to form continuous thermal networks to provide more heat-transfer pathways. Similarly, crosslinks can form efficient thermal conduction pathways and networks by connecting polymer chains with covalent bonds which improves the thermal conductivity.18,19 Moreover, the dependence of thermal conductivity of polyethylene (PE) on the temperature has been investigated which exhibits a consistent trend with the radius of gyration of chains.20 Meanwhile, random orientation of the polymer chains can shorten the mean-free path of the phonons, which are the major energy carriers in polymers. Thus, another effective method to improve the thermal conductivity is to stretch the polymers which can enhance the order of chain orientation. For example, the thermal conductivity of the ultrahigh molecular weight PE can exceed 40 W m−1 K−1 when the drawing ratio is beyond 300.21 Shen et al.22 obtained a higher drawing ratio (400) and produced a PE nanofiber with a higher thermal conductivity of 104 W m−1 K−1. In addition, the thermal conductivity of the electrospinning polystyrene (PS) nanofibers is found to be between 6.6 and 14.4 W m−1 K−1 which is much larger than that (∼0.15 W m−1 K−1) of bulk PS due to their preferential alignment.23 The enhancement of thermal conductivity of polymers has also been observed by molecular dynamics simulation which is related to the polymer alignment.24,25
Based on the above works, although a large amount of research works has been devoted to enhance the thermal conductivity of polymers, a fundamental understanding of the inner mechanism has not been clearly identified yet. Especially, there is few works on the styrene butadiene rubber (SBR) which is an important component of tire tread in academic and industrial studies.26,27 Thus, in this work, we employed the molecular dynamics simulations to study the effect of the composition ratio of styrene, temperature and tensile strain on the thermal conductivity of SBR which has not been investigated to our knowledge. By calculating the thermal conductivity, degrees of freedom of backbone atoms, and the orientation degree of backbone bonds, their inner relationship are revealed. Meanwhile, the effect of tensile strains on the transition temperature of the maximum thermal conductivity is discussed. The results can help to provide some fundamental insights into the thermal transport processes in the SBR.
2. Model and simulation methods
In this work, the adopted butadiene styrene rubber (SBR) is the random copolymers of the butadiene and the styrene. It is noted that the density of SBR basically doses not change when the number of their repeat units exceeds 50. Thus, a single chain contains 50 repeat units in the SBR model. The total number of chains is 30 which are identical for each system. There are four kinds of repeat units in one SBR chain which are the styrene, cis-1,4 butadiene, trans-1,4 butadiene and 1,2 butadiene respectively. Their composition ratio is listed in Table 1 for different systems. It is noted that the tacticity of styrene regions within the chains is atactic in our simulation. The condensed-phase optimized molecular potentials (COMPASS) are used to model the SBR which can accurately simulate the structural, vibrational, and thermo-physical properties of polymers.28,29 Similar to our previous work,30,31 all the SBR chains are put into a large simulation box to generate the initial configuration. Then, the isothermal–isobaric (NPT) ensemble is adopted to compress the system for 20 ns to reach the equilibrium density. The temperature and pressure are fixed at T = 300 K and P = 101.3 kPa respectively by using the Nose–Hoover temperature thermostat and pressure barostat respectively. Periodic boundary conditions are employed in all three directions of the simulation box. The timestep for the leapfrog integration scheme is set to be 1.0 fs. Nonbonded interactions are calculated using a Verlet neighbor list, which is updated every 15 timesteps. Subsequently the obtained systems are further equilibrated at constant volume and temperature for 20 ns. The density is 0.89 g cm−3 and the glass transition temperature (the intersection point from the specific volume–temperature curve) is 238 K for the SBR which are in agreement with the measured data.32 After equilibration, the simulation systems are deformed by changing the box length in one direction at a constant rate α. Meanwhile, the box length is reduced in the other two directions to keep the box volume unchanged during the deformation process. Three different tensile rates are considered here, namely 0.5 nm ns−1, 5 nm ns−1, and 50 nm ns−1. A maximum strain of 300% is reached in this work. It is noted that there is no formation of voids or crazes for all systems. The average results are obtained by independently deforming each system along x, y and z directions, respectively.| Systems | Styrene (%) | cis-1,4 Butadiene (%) | trans-1,4 Butadiene (%) | 1,2 Butadiene (%) |
|---|---|---|---|---|
| 1 | 0 | 18 | 65 | 17 |
| 2 | 13 | 15.7 | 56.5 | 14.8 |
| 3 | 23 | 13.9 | 50 | 13.1 |
| 4 | 33 | 12.1 | 43.5 | 11.4 |
| 5 | 43 | 10.3 | 37 | 9.7 |
| 6 | 53 | 8.5 | 30.5 | 8.0 |
| 7 | 63 | 6.7 | 24 | 6.3 |
| 8 | 73 | 4.9 | 17.5 | 4.6 |
| 9 | 83 | 3.1 | 11 | 2.9 |
| 10 | 100 | 0 | 0 | 0 |
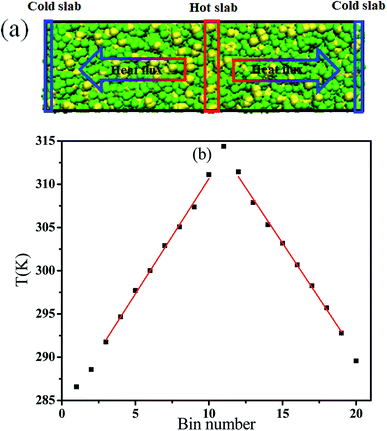
Then, we adopted reverse nonequilibrium molecular dynamics (RNEMD) to calculate the thermal conductivity of the SBR.33 In the RNEMD method, the velocity of the coldest atom in the first slab is exchanged with that of the hottest atom in the eleventh slab as a primary perturbation. During the simulation process, the total energy is conserved, because only velocities of atoms of identical mass are exchanged. In the calculation of the thermal conductivity, the simulation box is divided into 20 slabs in the heat flux direction. NVT conditions are adopted during the RNEMD process. The atom velocities are exchanged every 0.4 ps. We have confirmed that the calculated thermal conductivity has converged at this chosen exchange period. The trajectories are obtained for 5 ns, which are divided into ten independent blocks. Then we calculated the quantities separately in each block, determine average and standard deviation of the average, and use standard deviation as error bar. The thermal conductivity is calculated by using Fourier's law33 jz = KdT/dz. Here the jz is the heat flux which is obtained by the equation  , where m is the mass of the exchanged atoms, t is the simulation time, A is the cross-sectional area perpendicular to the heat flux, and vhot and vcold stand for the velocities of the hot and cold atoms of like mass m, respectively, whose velocities are exchanged. The factor 2 arises from the periodicity. dT/dz is the stable temperature gradient in the intervening region which is shown in Fig. 1 as an example. The temperature Tslab within each slab is evaluated as
  where the number of atoms in the slab is Nslab and kB is Boltzmann's constant. The angle brackets denote averaging over the atoms in the slab and over time. The sum is over all exchange events. It can refer to the previous work for a complete description of the RNEMD method.34 All simulations have been performed by using the large scale atomic/molecular massively parallel simulator (LAMMPS).35
3. Results and discussion
3.1 Composition ratio of styrene
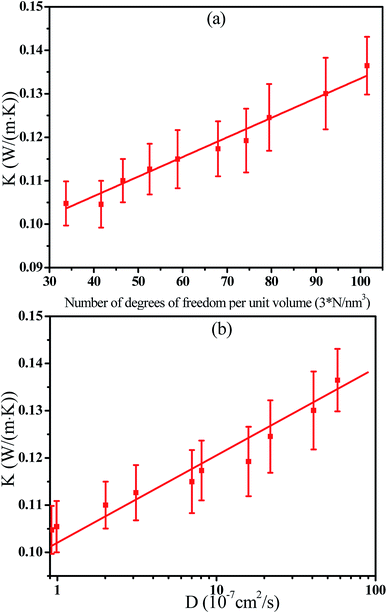
The composition ratio of styrene and butadiene in one chain can be tuned during the process of synthetizing the SBR according to their real application environment. Undoubtedly, it will affect the thermal conductivity of SBR. Thus, we first intended to investigate the effect of composition ratio of styrene on the thermal conductivity by fixing the repeat units. The composition ratio of styrene varies from 0% to 100% while the corresponding ratio of butadiene is from 100% to 0%. This is roughly within the experimental range.32 Detailed information on the studied systems is shown in Table 1. The change of the thermal conductivity K of SBR with the composition ratio of styrene is presented in Fig. 2. The results indicate that the K gradually decreases with increasing the composition ratio of styrene. It is noted that when the composition ratio of styrene is 0% or 100%, the polymers are polybutadiene (PB) or polystyrene (PS). The simulated thermal conductivities are 0.135 W m−1 K−1 and K = 0.105 W m−1 K−1 for PB and PS respectively while the experimental values are 0.175 W m−1 K−1 and 0.11 W m−1 K−1.32 It is reported that the cross-linking density can enhance the thermal conductivity of PE which can explain the smaller K of PB in the simulation.36 However, the very limited increase of thermal conductivity of PS with the cross-linking density is attributed to the highly heterogeneous PS structure including the phenyl side groups. Thus, the simulated and experimental K of PS are similar.36 To further understand the results, the density of SBR is calculated as a function of the composition ratio of styrene which is shown in Fig. 3. The density decreases with an improved composition ratio of styrene which is attributed to the large phenyl side groups. It is noted that the number of degrees of freedom of backbone atoms is one of decisive quantities for the thermal transport property. Here, it is defined as the 3 × N where N is the number of backbone atoms in the system. Thus, we have calculated the thermal conductivity of SBR as a function of the number of degrees of freedom of backbone atoms per volume in Fig. 4(a). There is a linear correlation between them which can rationalize the thermal conductivity. As the increase of the composition ratio of styrene, the number of the backbone atoms is reduced at the fixed repeat unit which reduces the thermal conductivity. Furthermore, the dependence of the thermal conductivity on the logarithm of the diffusion coefficient of backbone atoms is presented in Fig. 4(b). It also exhibits a linear relationship between them which indicates that the high mobility of atoms can enhance the thermal conductivity.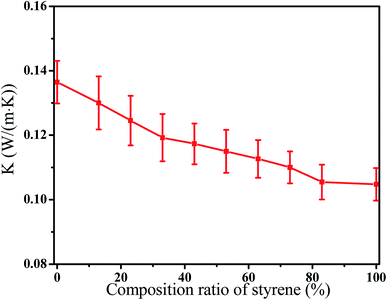 | ||
| Fig. 2 The thermal conductivityKof the butadiene styrene rubber as a function of the composition ratio of styrene. (T = 300 K, strain = 0.0.) | ||
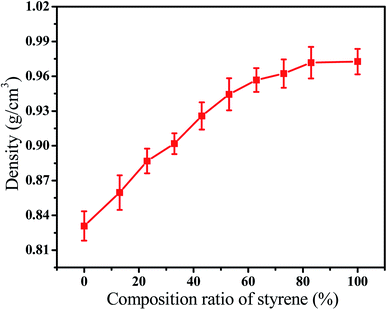 | ||
| Fig. 3 The density of the butadiene styrene rubber as a function of the composition ratio of styrene. (T = 300 K, strain = 0.0.) | ||
3.2 Tensile field
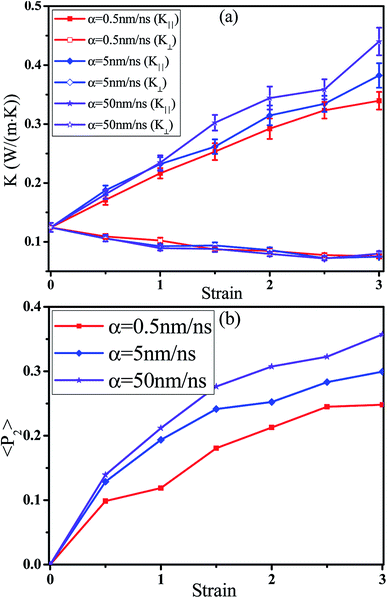
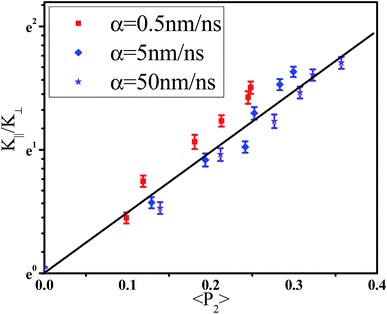
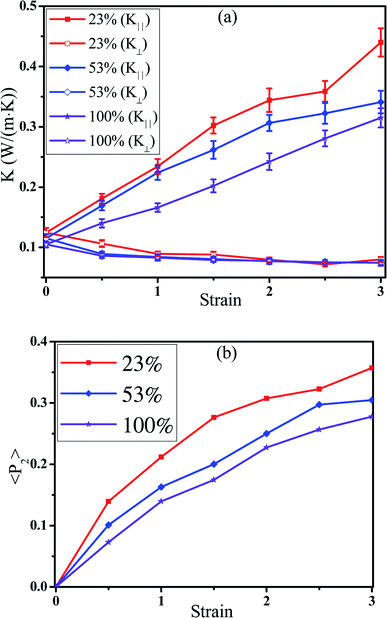
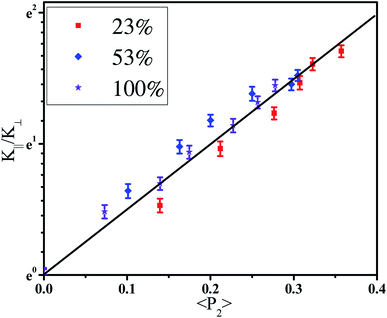
![[thin space (1/6-em)]](https://www.rsc.org/images/entities/char_2009.gif) θ〉 − 1)/2, where θ denotes the angle between the bond vector and the tensile direction. The parameter 〈P2〉 is 0.0 if the bonds are randomly oriented, 1.0 if the bonds are perfectly parallel to the tensile direction, and −0.5 if the bonds are perpendicular to it. Fig. 5(b) presents the orientation degree 〈P2〉 of backbone bonds with respect to the strain for different α. The 〈P2〉 is zero at strain = 0.0 which reflects the random orientation of bonds. Then, it shows a gradual increase with increasing the strain which reflects their orientation along the tensile direction. This is consistent with the thermal conductivity. To further understand their relationship, the dependence of the logarithm of K‖/K⊥ on the orientation degree 〈P2〉 of bonds is shown in Fig. 6. The results show a linear relationship between them (ln(K‖/K⊥) = 5.08〈P2〉), which indicates that the heat transfers mainly via the backbone bonds. In the previous work, Liu et al.24 found that the relationship between the parallel thermal conductivity of PE and the chain orientation follows an exponential equation. In addition, the anisotropy of the thermal conductivity K‖/K⊥ has a close relationship with the average direction cosine of the C–C backbone bonds for amorphous PS.38 Furthermore, K‖ increases by 37% while K⊥ decreases by 12% at strain = 0.3 and T = 300 K for amorphous polyamide,39 which means K‖/K⊥ ∼ 1.5. K‖ increases by 8% while K⊥ decreases by 11% at strain = 0.3 and T = 400 K for amorphous PS,40 which means K‖/K⊥ ∼ 1.2. K‖/K⊥ varies from 1.91 to 1.05 for polyamide nanoconfined between graphene surfaces with the increase of the inter-surface width from 1 to 6 nm.41 For our systems, K‖ increases by 26%, K⊥ decreases by 6.5%, and K‖/K⊥ is ∼1.35 at strain = 0.3 and T = 300 K. In total, our simulation results can be comparable to others.
θ〉 − 1)/2, where θ denotes the angle between the bond vector and the tensile direction. The parameter 〈P2〉 is 0.0 if the bonds are randomly oriented, 1.0 if the bonds are perfectly parallel to the tensile direction, and −0.5 if the bonds are perpendicular to it. Fig. 5(b) presents the orientation degree 〈P2〉 of backbone bonds with respect to the strain for different α. The 〈P2〉 is zero at strain = 0.0 which reflects the random orientation of bonds. Then, it shows a gradual increase with increasing the strain which reflects their orientation along the tensile direction. This is consistent with the thermal conductivity. To further understand their relationship, the dependence of the logarithm of K‖/K⊥ on the orientation degree 〈P2〉 of bonds is shown in Fig. 6. The results show a linear relationship between them (ln(K‖/K⊥) = 5.08〈P2〉), which indicates that the heat transfers mainly via the backbone bonds. In the previous work, Liu et al.24 found that the relationship between the parallel thermal conductivity of PE and the chain orientation follows an exponential equation. In addition, the anisotropy of the thermal conductivity K‖/K⊥ has a close relationship with the average direction cosine of the C–C backbone bonds for amorphous PS.38 Furthermore, K‖ increases by 37% while K⊥ decreases by 12% at strain = 0.3 and T = 300 K for amorphous polyamide,39 which means K‖/K⊥ ∼ 1.5. K‖ increases by 8% while K⊥ decreases by 11% at strain = 0.3 and T = 400 K for amorphous PS,40 which means K‖/K⊥ ∼ 1.2. K‖/K⊥ varies from 1.91 to 1.05 for polyamide nanoconfined between graphene surfaces with the increase of the inter-surface width from 1 to 6 nm.41 For our systems, K‖ increases by 26%, K⊥ decreases by 6.5%, and K‖/K⊥ is ∼1.35 at strain = 0.3 and T = 300 K. In total, our simulation results can be comparable to others.
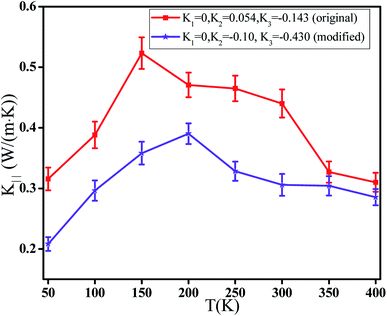
| Dihedral angle | Original parameters | Modified parameters | |||||
|---|---|---|---|---|---|---|---|
| K1 (kcal mol−1) | K2 (kcal mol−1) | K3 (kcal mol−1) | K1 (kcal mol−1) | K2 (kcal mol−1) | K3 (kcal mol−1) | ||
(1) C4–C4–C3![[double bond, length as m-dash]](https://www.rsc.org/images/entities/char_e001.gif) –C3 –C3![[double bond, length as m-dash]](https://www.rsc.org/images/entities/char_e001.gif) |
0.243 | 0 | 0.104 | −0.010 | −0.200 | −0.304 | |
(2) C3![[double bond, length as m-dash]](https://www.rsc.org/images/entities/char_e001.gif) –C4–C4–C3 –C4–C4–C3![[double bond, length as m-dash]](https://www.rsc.org/images/entities/char_e001.gif) |
0 | 0 | −0.153 | 0.1500 | 0 | −0.353 | |
(3) C3![[double bond, length as m-dash]](https://www.rsc.org/images/entities/char_e001.gif) –C4–C4–C43 –C4–C4–C43 |
0 | 0 | −0.153 | 0.1500 | 0 | −0.353 | |
(4) C4–C4–C43–C3![[double bond, length as m-dash]](https://www.rsc.org/images/entities/char_e001.gif) |
0.088 | 0 | −0.020 | 0.1000 | 0 | −0.198 | |
| (5) C4–C4–C43–C4 | 0 | 0.051 | −0.143 | 0 | −0.100 | −0.430 | |
(6) C43–C4–C3![[double bond, length as m-dash]](https://www.rsc.org/images/entities/char_e001.gif) –C3 –C3![[double bond, length as m-dash]](https://www.rsc.org/images/entities/char_e001.gif) |
0.243 | 0 | 0.104 | 0.2000 | 0 | −0.2 | |
(7) C3![[double bond, length as m-dash]](https://www.rsc.org/images/entities/char_e001.gif) –C4–C43–C4 –C4–C43–C4 |
0.088 | 0 | −0.020 | 0.1 | 0 | −0.198 | |
| (8) C43–C4–C43–C4 | 0 | 0.051 | −0.143 | 0 | 0.514 | −0.01 | |
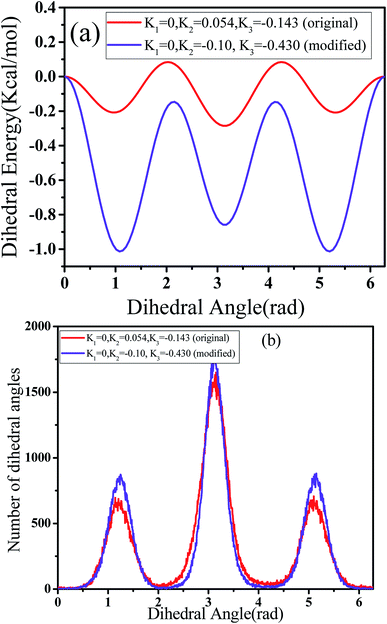 | ||
| Fig. 10 (a) Dihedral energy and (b) number of dihedral angles for the original and modified dihedral parameters at strain = 3.0. (T = 300 K, composition ratio of styrene = 23%, α = 50 nm ns−1.) | ||
4. Conclusions
In the present work, we adopted reverse non-equilibrium molecular dynamics simulations in a full atomistic resolution to investigate the effect of the composition ratio of styrene, temperature and tensile strain on the thermal conductivity of styrene butadiene rubber (SBR). First, the number of backbone atoms declines with increasing the composition ratio of styrene which reduces their number of degrees of freedom and diffusion coefficient. Thus, the thermal conductivity of SBR exhibits a continuous decrease. The deformation induced polymer orientation enhances the thermal conductivity parallel to the tensile direction, but reduces the thermal conductivity perpendicular to it. Meanwhile, the orientation degree of backbone bonds gradually rises with increasing the strain rate or reducing the composition ratio of styrene which enhances the parallel thermal conductivity. It is interesting to observe a linear relationship between the anisotropy of the thermal conductivity and the orientation degree of backbone bonds. Finally, the thermal conductivity of the strained SBR first increases and then decreases with increasing the temperature in the simulation. This can be explained by the transition from disorder to anharmonicity dominated phonon transport. Additionally, the high strain reduces the transition temperature which is attributed to the polymer orientation. Finally, it deserves to do the corresponding experimental investigations to prove it in the future. In summary, the obtained results are important to help to design the SBR for improving their thermal conductivity.Conflicts of interest
There are no conflicts to declare.Acknowledgements
The authors acknowledge financial support from the National Natural Science Foundation of China (21704003 and 51973012), and the National 973 Basic Research Program of China (2015CB654704). The authors acknowledge the National Supercomputer Centers in Guangzhou, Lvliang and Shenzhen.References
- M. A. Vadivelu, C. R. Kumar and G. M. Joshi, Compos. Interfaces, 2016, 23, 847–872 CrossRef CAS.
- C. Huang, X. Qian and R. Yang, Mater. Sci. Eng., R, 2018, 132, 1–22 CrossRef.
- Z. Han and A. Fina, Prog. Polym. Sci., 2011, 36, 914–944 CrossRef CAS.
- J. Hennig, J. Polym. Sci., Part C: Polym. Symp., 1967, 16, 2751–2761 CrossRef.
- R. Haggenmueller, C. Guthy, J. R. Lukes, J. E. Fischer and K. I. Winey, Macromolecules, 2007, 40, 2417–2421 CrossRef CAS.
- A. Yu, P. Ramesh, M. E. Itkis, E. Bekyarova and R. C. Haddon, J. Phys. Chem. C, 2007, 111, 7565–7569 CrossRef CAS.
- J. Liu and R. Yang, Phys. Rev. B, 2012, 86, 104307 CrossRef.
- Y. Xu, X. Wang, J. Zhou, B. Song, Z. Jiang, E. M. Y. Lee, S. Huberman, K. K. Gleason and G. Chen, Sci. Adv., 2018, 4, eaar3031 CrossRef PubMed.
- V. Rashidi, E. J. Coyle, K. Sebeck, J. Kieffer and K. P. Pipe, J. Phys. Chem. B, 2017, 121, 4600–4609 CrossRef CAS PubMed.
- H. Ma and Z. Tian, Appl. Phys. Lett., 2017, 110, 091903 CrossRef.
- D. Luo, C. Huang and Z. Huang, J. Heat Transfer, 2018, 140, 031302 CrossRef.
- Z. Guo, D. Lee, Y. Liu, F. Sun, A. Sliwinski, H. Gao, P. C. Burns, L. Huang and T. Luo, Phys. Chem. Chem. Phys., 2014, 16, 7764–7771 RSC.
- X. P. Chen, Q. H. Liang, J. K. Jiang, C. K. Y. Wong, S. Y. Y. Leung, H. Y. Ye, D. G. Yang and T. L. Ren, Sci. Rep., 2016, 6, 20621 CrossRef CAS PubMed.
- X. Xie, K. Yang, D. Li, T.-H. Tsai, J. Shin, P. V. Braun and D. G. Cahill, Phys. Rev. B, 2017, 95, 035406 CrossRef.
- X. Wei, T. Zhang and T. Luo, Phys. Chem. Chem. Phys., 2016, 18, 32146–32154 RSC.
- G. H. Kim, D. Lee, A. Shanker, L. Shao, M. S. Kwon, D. Gidley, J. Kim and K. P. Pipe, Nat. Mater., 2015, 14, 295–300 CrossRef CAS PubMed.
- L. Mu, J. He, Y. Li, T. Ji, N. Mehra, Y. Shi and J. Zhu, J. Phys. Chem. C, 2017, 121, 14204–14212 CrossRef CAS.
- B. Tonpheng, J. Yu and O. Andersson, Phys. Chem. Chem. Phys., 2011, 13, 15047–15054 RSC.
- X. Xiong, M. Yang, C. Liu, X. Li and D. Tang, J. Appl. Phys., 2017, 122, 035104 CrossRef.
- T. Zhang and T. Luo, J. Phys. Chem. B, 2016, 120, 803–812 CrossRef CAS PubMed.
- C. L. Choy, Y. W. Wong, G. W. Yang and T. Kanamoto, J. Polym. Sci., Part B: Polym. Phys., 1999, 37, 3359–3367 CrossRef CAS.
- S. Shen, A. Henry, J. Tong, R. Zheng and G. Chen, Nat. Nanotechnol., 2010, 5, 251–255 CrossRef CAS PubMed.
- C. Canetta, S. Guo and A. Narayanaswamy, Rev. Sci. Instrum., 2014, 85, 104901 CrossRef PubMed.
- J. Liu and R. Yang, Phys. Rev. B, 2010, 81, 174122 CrossRef.
- S. Pal, G. Balasubramanian and I. K. Puri, J. Chem. Phys., 2012, 136, 044901 CrossRef PubMed.
- S. Song and Y. Zhang, Carbon, 2017, 123, 158–167 CrossRef CAS.
- Z. Tang, L. Zhang, W. Feng, B. Guo, F. Liu and D. Jia, Macromolecules, 2014, 47, 8663–8673 CrossRef CAS.
- H. Sun, J. Phys. Chem. B, 1998, 102, 7338–7364 CrossRef CAS.
- M. J. McQuaid, H. Sun and D. Rigby, J. Comput. Chem., 2004, 25, 61–71 CrossRef CAS PubMed.
- Y. Gao and F. Müller-Plathe, J. Phys. Chem. C, 2018, 122, 1412–1421 CrossRef CAS.
- Y. Gao and F. Müller-Plathe, J. Phys. Chem. B, 2016, 120, 1336–1346 CrossRef CAS PubMed.
- J. E. Mark, Polymer Data Handbook, Oxford University Press, Oxford, 1999 Search PubMed.
- F. Müller-Plathe, J. Chem. Phys., 1997, 106, 6082–6085 CrossRef.
- M. Zhang, E. Lussetti, L. E. S. de Souza and F. Müller-Plathe, J. Phys. Chem. B, 2005, 109, 15060–15067 CrossRef CAS PubMed.
- S. Plimpton, J. Comput. Phys., 1995, 117, 1–19 CrossRef CAS.
- G. Kikugawa, T. G. Desai, P. Keblinski and T. Ohara, J. Appl. Phys., 2013, 114, 034302 CrossRef.
- J. G. Park, Q. Cheng, J. Lu, J. Bao, S. Li, Y. Tian, Z. Liang, C. Zhang and B. Wang, Carbon, 2012, 50, 2083–2090 CrossRef CAS.
- E. A. Algaer, M. Alaghemandi, M. C. Böhm and F. Müller-Plathe, J. Phys. Chem. B, 2009, 113, 14596–14603 CrossRef CAS PubMed.
- E. Lussetti, T. Terao and F. Müller-Plathe, J. Phys. Chem. B, 2007, 111, 11516–11523 CrossRef CAS PubMed.
- E. A. Algaer and F. Müller-Plathe, Soft Mater., 2012, 10, 42–80 CrossRef CAS.
- H. Eslami, L. Mohammadzadeh and N. Mehdipour, J. Chem. Phys., 2012, 136, 104901 CrossRef PubMed.
- G. P. Srivastava, The Physics of Phonons, Taylor and Francis Group, New York, 1990, p. 418 Search PubMed.
- K. Eiermann, J. Polym. Sci., Part C: Polym. Symp., 1964, 6, 157–165 CrossRef.
- J. Hennig, J. Polym. Sci., Part C: Polym. Symp., 1967, 16, 2751–2761 CrossRef.
- S. N. Kreitmeier, G. L. Liang, D. W. Noid and B. G. Sumpter, J. Therm. Anal., 1996, 46, 853–869 CrossRef CAS.
- W. N. dos Santos, J. A. de Sousa and R. Gregorio, Polym. Test., 2013, 32, 987–994 CrossRef CAS.
| This journal is © The Royal Society of Chemistry 2020 |

