DOI:
10.1039/D0RA04295A
(Paper)
RSC Adv., 2020,
10, 23097-23107
Molecular dynamics study of convective heat transfer mechanism in a nano heat exchanger
Received
14th May 2020
, Accepted 11th June 2020
First published on 17th June 2020
Abstract
With the rapid development of micro/nano electro-mechanical systems, the convective heat transfer at the micro/nanoscale has been widely studied for the thermal management of micro/nano devices. Here we investigate the convective heat transfer mechanism of a nano heat exchanger by the employment of molecular dynamics simulation with a modified thermal pump method. First, the temperature jump and velocity slip are observed at the wall–fluid interfaces of the nano heat exchanger. Moreover, the larger Kapitza resistance in the entrance region weakens the convective heat transfer. Second, the heat transfer performance of the nano heat exchanger can be improved by increasing the surface wettability of the solid walls owing to more fluid atoms being involved in heat transport at the walls when the wall–fluid interaction is enhanced. Meanwhile, the strong surface wettability results in the appearance of the quasi-solid fluid layers, which improves the heat transfer between walls and fluids. Finally, we point out that when the surface wettability of the nano heat exchanger is weak, the heat transfer of the hot fluid side is better than that of the cold fluid side, while the convective heat transfer performances of the cold and hot fluid sides are reversed when the surface wettability is strong. This is because of the feebler temperature jump of the hot fluid side when wall–fluid interaction is small and the greater velocity slip of the cold fluid side for walls with large wall–fluid interaction.
1. Introduction
Since the 1960s, Moore's law has endured for more than half a century, which states that the integration and performance of electronic components would double approximately every 18 months.1,2 The increasing integration means that the size of the electronic components is shrinking and this improved property causes a higher level of power density, which challenges the thermal management at the micro/nanoscale.3 The application of the micro/nano heat exchangers is considered as an effective method to solve the thermal issues of the micro/nano devices in order to ensure their performance and prolong their life span.4 Although the macroscopic mechanism of the convection heat transfer for heat exchangers has been investigated sufficiently due to their wide application, the analysis of micro/nano heat exchangers is scarce. Therefore, research on the flow and heat transfer characteristics at the micro/nanoscale emerge in an endless stream.5–10
At microscale level, the explorations of the convective heat transfer are conducted by experiments and simulations. In 1981, Tuckerman et al. firstly experimentally studied the convective heat transfer in microchannels and they verified that employing the cooling fluid flow in microchannels could effectively dissipate the heat.11 By driving the water to flow in the silicon microchannels with different aspect ratios, Wu et al. discovered the fluid temperature jump and velocity slip at the microchannel walls in their experiments.12 Besides, they concluded that the surface roughness and surface hydrophilic property determined the Nusselt number. Friedrich et al. fabricated the micro heat exchangers in many micron-sized plates experimentally.13 They pointed out that the volumetric heat transfer coefficient of the micro heat exchanger would even reach 45 MW K−1 m−3, which was much larger than that at macroscale. On the other hand, with the implementing of the computational fluid dynamics method, Bigham et al. focused on the fluid thermal and hydraulic development under the slip flow regime in the microchannel with the constant wall temperature.14 They exposed that the temperature jump and velocity slip made the fluid flow and heat transport different from those at macroscale. By using the numerical calculation, Hettiarachchi et al. solved the Navier–Stokes equations and energy equations with the temperature jump and velocity slip at the walls.15 They presented that the temperature jump seemed to be harmful to the heat transport while the velocity slip could enhance the convective heat transfer and the combined effect of them could result in an increase or a decrease in the Nusselt number. In addition, Mohammed et al. numerically investigated the heat transfer characteristics in the wavy microchannel with the wavy amplitudes ranging from 125 μm to 500 μm.16 They reported that the heat transfer performance of the wavy microchannel was better than the normal microchannel and the friction factor, as well as the wall shear stress, boosted proportionally with the increase of the wavy amplitude. Whereas, these studies are still based on the fluid continuum hypotheses and the traditional computational fluid dynamics method is too restricted to reveal the heat transfer mechanism at micro/nanoscale. Hence, the mathematical and physical description of the flow and heat transfer process needs to adopt the principles and equations which are based on the molecular dynamics (MD) theory.17
When the system size further deceases to the nanoscale, the experimental measurement is limited and the molecular dynamics simulation is an available research technique as long as the accurate atomic interaction parameters can be guaranteed.18–20 By performing MD simulation, Markvoort et al. firstly came up with a thermal pump method to simulate the convective heat transfer in nanochannels.21 Different from applying the external force to the whole fluid which would bring the impractical energy into the fluid domain, they only drove the fluid and controlled the fluid temperature in specific regions. Meanwhile, they pointed out that the convective heat transfer in the nanochannel could be amplified by strengthening the surface wettability. Furthermore, Ge et al. improved the above thermal pump method by locating the region for resetting the fluid temperature behind the region where the fluid was driven and the modified method could set the inlet fluid temperature more accurately.22 They also revealed that the convective heat transfer at nanoscale was weaker than that at macroscale, which was attributed to the temperature jump at the interface. Gu et al. used the non-equilibrium molecular dynamics simulation to investigate the influence of the axial heat conduction on the convective heat transfer at nanoscale.23 They figured out that the contribution of the axial heat conduction to the heat transport could be less than 2.0% when Peclet number is larger than 20. By utilizing the MD method to simulate the convective heat transfer of water flow in graphene nanochannels, Marable et al. indicated that the system scale influenced the convective heat transfer at nanoscale.24 With the implementing of the MD simulations, Chakraborty et al. concluded that the surface roughness could boost the convective performance because of the extensive heat transfer area.25 Furthermore, they demonstrated that the selected coating layers could promote the convective heat transfer due to the effect of “phonon bridge”. Motlagh et al. investigated the effect of different wall materials on the convective heat transfer using the MD method.26 They pointed that the Nusselt number was affected by the wall materials and its value for the copper nanochannel was larger than that for platinum channels. However, the above MD simulations only focus on the convective heat transfer with the constant wall temperature or fixed heat flux. As a result, the investigations of the nanoscopic mechanism about the convective heat transfer between the cold and hot fluids are vacant, which deserves the further study.
According to the above discussion, we propose a modified thermal pump method to investigate the mechanism of the convective heat transfer between the cold and hot fluids in the nano heat exchanger using molecular dynamics simulation in this work. First, we concentrate on the thermal and flow characteristics in nano heat exchanger with the tunable surface wettability, including the fluid temperature profile, fluid velocity profile, fluid density profile, temperature slip length and the local Nusselt number. Then, we assess the convective heat transfer performance caused by increasing the surface wettability of the heat exchanger walls. Last, the heat transfer capability of the cold fluid side is compared with that of the hot fluid side when the surface wettability of the heat exchanger walls is varying.
2. Simulation details
In this work, we focus on the convective heat transfer process in the nano heat exchanger where the cold and hot fluids are separated by the solid walls. Fig. 1 depicts the schematic of the simulation domain. Argon atoms act as the cold and hot fluids and platinum atoms make up the walls. All parallel platinum walls possess the face-centered cubic (FCC) lattice structure with the lattice constant a = 3.923 Å. The lattice constant a is taken as the unit size in order to describe the size conveniently and we use the nondimensional parameters X* and Y* (X* = x/a and Y* = y/a) to describe the position. Harmonic springs are applied to all platinum atoms to simulate the simple atomic harmonic vibration at the FCC lattice sites. According to the solid state physics theory and simple harmonic motion law, the spring constant of all harmonic springs is set as k = 179.5 N m−1.27,28 Cold and hot fluids flow in their own channels and the sizes of both two channels are 110a × 20a × 20a Å3. Based on the above channel volume, 48![[thin space (1/6-em)]](https://www.rsc.org/images/entities/char_2009.gif) 000 argon atoms are randomly distributed in each channel, which means the corresponding average fluid density is about 1.2 g cm−3. With the aim of better simulating the convective heat transfer at nanoscale, Markvoort et al. and Ge et al. put forward two simulation methods where the fluid is just driven in a forcing region and the fluid temperature is controlled only in a temperature reset region.21,22 The difference between their methods is that: the method used by Markvoort et al. puts the temperature reset region in front of the forcing region, while Ge et al. drive the fluid before resetting the inlet fluid temperature. Due to the different heat transfer conditions in our work (cold and hot fluids undergo the convective heat transfer at nanoscale) from the previous studies at nanoscale (the fluid is cooled or heated by walls with the constant temperature or fixed heat flux),21,22 the existing simulation settings are no longer suitable for our simulation owing to the following reasons: (1) adding force in a specific region leads to an abnormally high temperature field in this region which acts as an internal heat source and generates the axial heat conduction with the adjacent fluid region; (2) if the forcing region locates behind the temperature reset region, the inlet fluid temperature could deviate from the desired temperature because of the unrealistic axial conduction; (3) if the inlet temperature resetting is implemented after driving the fluid, the outlet fluid temperature is influenced by the image atoms in the forcing region due to the periodic boundary condition in the simulation. For the convective heat transfer with the condition that cold and hot fluids exchange the heat, the temperature difference of cold and hot fluids plays an important role in the convective heat transfer and needs to be more accurate. In order to better simulate the convective heat transfer process between the cold and hot fluids at nanoscale, an modified thermal pump method is proposed in this work, which is a combination of the previous work.21,22 We divide the fluid domain into four independent regions: an outlet temperature reset region, a forcing region, an inlet temperature reset region and a data collection region, which is shown in Fig. 1. The outlet temperature reset region locates in the range of −10a Å < x < −8a Å and the inlet temperature reset region locates in the range of −2a Å < x < 0 Å. Both of them use the Langevin thermostats to rescale the thermal velocities of the fluid atoms after removing the streaming velocity bias. The cold fluid temperature is kept at 200 K and the hot fluid temperature is kept at 400 K at their corresponding temperature reset regions. The forcing region locates in the range of −8a Å < x < −2a Å, where a constant body force fb,x = 2 × 10⁻¹¹ N is applied to the argon atoms to drive the cold and hot fluids. To ensure that the cold and hot fluids do not transport the heat in the temperature reset regions and forcing region, the solid atoms, locating in the range of −10a Å < x < 0 Å, are frozen. The data collection region locates in the range of 0 Å < x < 100a Å, where the convective heat transfer process is simulated and the simulation results are recorded.
000 argon atoms are randomly distributed in each channel, which means the corresponding average fluid density is about 1.2 g cm−3. With the aim of better simulating the convective heat transfer at nanoscale, Markvoort et al. and Ge et al. put forward two simulation methods where the fluid is just driven in a forcing region and the fluid temperature is controlled only in a temperature reset region.21,22 The difference between their methods is that: the method used by Markvoort et al. puts the temperature reset region in front of the forcing region, while Ge et al. drive the fluid before resetting the inlet fluid temperature. Due to the different heat transfer conditions in our work (cold and hot fluids undergo the convective heat transfer at nanoscale) from the previous studies at nanoscale (the fluid is cooled or heated by walls with the constant temperature or fixed heat flux),21,22 the existing simulation settings are no longer suitable for our simulation owing to the following reasons: (1) adding force in a specific region leads to an abnormally high temperature field in this region which acts as an internal heat source and generates the axial heat conduction with the adjacent fluid region; (2) if the forcing region locates behind the temperature reset region, the inlet fluid temperature could deviate from the desired temperature because of the unrealistic axial conduction; (3) if the inlet temperature resetting is implemented after driving the fluid, the outlet fluid temperature is influenced by the image atoms in the forcing region due to the periodic boundary condition in the simulation. For the convective heat transfer with the condition that cold and hot fluids exchange the heat, the temperature difference of cold and hot fluids plays an important role in the convective heat transfer and needs to be more accurate. In order to better simulate the convective heat transfer process between the cold and hot fluids at nanoscale, an modified thermal pump method is proposed in this work, which is a combination of the previous work.21,22 We divide the fluid domain into four independent regions: an outlet temperature reset region, a forcing region, an inlet temperature reset region and a data collection region, which is shown in Fig. 1. The outlet temperature reset region locates in the range of −10a Å < x < −8a Å and the inlet temperature reset region locates in the range of −2a Å < x < 0 Å. Both of them use the Langevin thermostats to rescale the thermal velocities of the fluid atoms after removing the streaming velocity bias. The cold fluid temperature is kept at 200 K and the hot fluid temperature is kept at 400 K at their corresponding temperature reset regions. The forcing region locates in the range of −8a Å < x < −2a Å, where a constant body force fb,x = 2 × 10⁻¹¹ N is applied to the argon atoms to drive the cold and hot fluids. To ensure that the cold and hot fluids do not transport the heat in the temperature reset regions and forcing region, the solid atoms, locating in the range of −10a Å < x < 0 Å, are frozen. The data collection region locates in the range of 0 Å < x < 100a Å, where the convective heat transfer process is simulated and the simulation results are recorded.
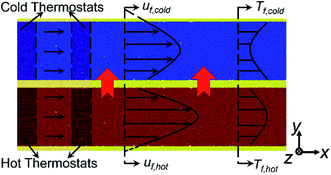 |
| | Fig. 1 The schematic of the simulation domain. | |
All simulations in this work are implemented through the Large-scale Atomic/Molecular Massively Parallel Simulator (LAMMPS) package. Similar to the previous MD simulations on the fluid flow at nanoscale,29–31 the 12–6 Lennard-Jones (LJ) potential is selected to describe the attraction and repulsion forces between atoms,32 which is modeled as follows:
| |
 | (1) |
where
ε is the energy parameter,
r is the interatomic distance and
σ is the length parameter. In this work,
σAr–Ar is set to be 3.405 Å and
εAr–Ar is equal to 0.0104 eV. In addition,
σPt–Pt = 2.475 Å and
εPt–Pt = 0.521 eV. Therefore,
σAr–Pt = 2.940 Å and
εAr–Pt is equal to 0.074 eV, which are obtained by the Lorentz–Berthelot mixing rule.
33 The direct interactions between cold and hot fluid atoms are ignored to match the actual situation perfectly. We use seven different scaling parameters
χ to tune the interfacial coupling strength between fluids and walls:
χ = 0.25, 0.50, 0.75, 1.00, 2.00, 3.00, 4.00. Hence, the actual energy parameters between the platinum atoms and argon atoms are the product of their intrinsic energy parameters and the scaling parameter. Periodic boundary conditions are applied to the
x,
y and
z directions for the following two reasons: (1) the size of the system is expanded at
x and
y directions without slowing down the calculation; (2) this operation more realistically simulates the convective heat transfer between the cold and hot fluids when they distribute alternately at
z direction. In addition, the Verlet algorithm is employed to integrate Newton's equations of motion within the simulation domain. With the aim of improving the computational efficiency, the cut-off radius
rcut is set to be 10 Å and the atomic interactions beyond the cut-off radius are not considered.
All simulations are conducted for a total duration of 9.0 ns and the time step is chosen as 1.0 fs. The simulation process is as follows: firstly, the whole system may spend 1 ns thermally relaxing at 300 K in the NVT ensemble (constant number of atoms, volume, and temperature) in order to reach the systematic stability. Subsequently, the system is switched to the NVE ensemble (constant number of atoms, volume, and energy), which lasts the next 8.0 ns. Under the NVE ensemble, the solid walls are not thermostated and their temperature should depend on the heat transfer between cold and hot fluids. Argon atoms are speeded up in the forcing region in order to drive the flow. Once fluid atoms enter the inlet temperature reset region, the cold fluid temperature is controlled at 200 K and the hot fluid temperature is controlled at 400 K. When cold and hot fluids leave the inlet temperature reset region, the convective heat transfer process between them happens in the data collection region. Owing to the periodic boundary condition in the flow direction, the unrealistic axial heat conduction may result in the abnormal outlet temperature. Thus, the outlet temperature reset region is added to correct the abnormality. In the whole 8.0 ns NVE process, we spend 4.0 ns to achieve a steady convective heat transfer condition and the remaining 4.0 ns are used to record the fluid characteristics in the data collection region. The cold and hot fluid channels are both divided into 110 columns in the x direction and 20 layers in the y direction to acquire data, so the size of each bin is a × a × 20a Å3.
3. Results and discussion
The variation of the local mean temperature (Tm) along the flow direction at χ = 1.00 is shown in Fig. 2, where Tm is mathematically defined as:| |
 | (2) |
where H is the channel height, c is the specific heat capacity, ρ(x,y) is the fluid density, uf(x,y) is the local fluid velocity and Tf(x,y) is the local fluid temperature. As shown in Fig. 2, the cold fluid temperature (Tm,cold) increases from 200 K and the hot fluid temperature (Tm,hot) decreases from 400 K firstly, which results from the convective heat transfer driven by their temperature difference. However, Tm,cold rises up and Tm,hot goes down anomalously at the second half of the nano heat exchanger domain. This abnormal phenomenon is caused by the unrealistic axial heat conduction. Hence, only the data from the first half of the data collection region are valid, which refers to the range of 0 Å < x < 50a Å. Ulteriorly, Fig. 3 describes the temperature field at the first half of the nano heat exchanger when χ = 1.00. As the temperature distribution shows, the temperature difference between the cold and hot fluids (ΔT) is considerable at the range of 0 Å < x < 25a Å (ΔT ranges from 199.87 K at x = 0 Å to 22.64 K at x = 25a Å), while that is inappreciable at the range of 25a Å < x < 50a Å (ΔT ranges from 22.64 K at x = 25a Å to 3.60 K at x = 50a Å). By comparing the variation of the cold and hot fluids temperature difference (ΔT) at the range of 0 Å < x < 50a Å, we figure out that ΔT has made more than 90 percent of the decline at the range of 0 Å < x < 50a Å. Since the temperature difference acts as the driving force of the heat exchange between the cold and hot fluids, the convective heat transfer taking place at the range of 0 Å < x < 25a Å is of more research value.
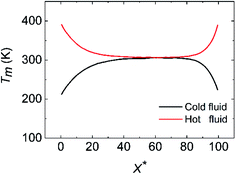 |
| | Fig. 2 The variation of the mean temperature (Tm) along the flow direction at χ = 1.00. | |
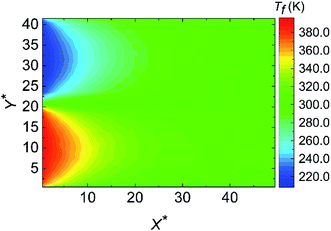 |
| | Fig. 3 The temperature distribution along the flow direction at χ = 1.00. | |
In addition, Fig. 4 exhibits the fluid temperature profiles at different cross sections along the flow direction at χ = 1.00. The temperature jump can be observed at the wall–fluid interfaces of both cold and hot fluid sides. As a whole, the fluid temperature profiles are concave for the cold fluid but convex for the hot fluid. Especially, the middle region of the temperature profile is flattened no matter whether the fluid is cold or hot at X* = 0.5, which indicates that the fluid thermal development is inadequate. The temperature profiles at other positions are parabolic where the cold and hot fluids are fully thermal developed. Such temperature profile variations are consistent with those at macroscale. It is worth mentioning that the temperature profiles for X* > 21.5 are almost overlapping, which also proves that the convective heat transfer at the range of 25a Å < x < 50a Å is weak. Except the fluid temperature, the fluid velocity is another important indicator for the convective heat transfer. Fig. 5 displays the fluid velocity profiles at different cross sections along the flow direction at χ = 1.00. As shown in the previous studies,34,35 the velocity slip is the phenomenon that the velocity of the near-wall fluid is not the same as that of the walls, which becomes an important difference between the micro/nanoscale and macroscale flows. Obviously, the velocity slip occurs at the walls of the cold and hot fluid sides. Similar to the fluid thermal development, the fluid hydraulic development determines the fluid velocity profiles. The velocity profile shows flattened at the entrance on account of the deficient hydraulic development while the velocity profile is parabolic for the fully hydraulic developed region. Fig. 5 also points out that the cold fluid always flows slower than the hot fluid at the same cross section since the lower fluid temperature induces the larger fluid viscosity. Moreover, the fluid hydraulic development is almost sufficient when X* > 7.5, which leads to the similar velocity profiles. Fig. 6 reveals the average fluid velocities for different surface wettabilities of the solid walls when the flow states of the cold and hot fluids are stable. In consistent with Fig. 5 and 6 also uncovers that the velocity of the cold fluid is smaller than that of the hot fluid because of the different fluid viscosities. The cold fluid velocity varies from 22.41 m s−1 to 15.66 m s−1 and the hot fluid velocity changes from 29.42 m s−1 to 19.52 m s−1 for different χ.
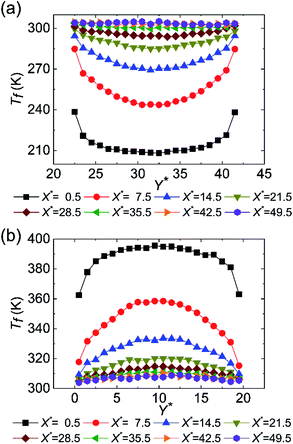 |
| | Fig. 4 The development of the fluid temperature profiles along the channel height at χ = 1.00 for (a) cold fluid and (b) hot fluid. | |
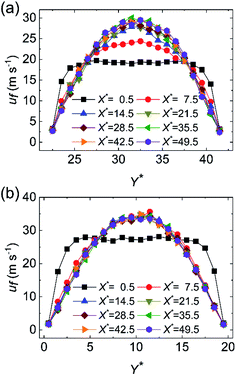 |
| | Fig. 5 The development of the fluid velocity profiles along the channel height at χ = 1.00 for (a) cold fluid and (b) hot fluid. | |
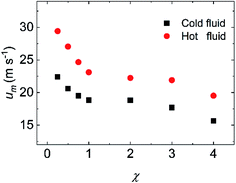 |
| | Fig. 6 The variation of the average fluid velocity at different surface wettabilities. | |
As discussed above, the temperature difference between the cold and hot fluids at the range of 25a Å < x < 50a Å is puny and the fluid hydraulic development is fully developed quickly for X* < 7.5, so we select the region locating from X* = 0 to X* = 25 to comprehensively analyze the convective heat transfer performance in the nano heat exchanger by tuning the interfacial coupling strength between the walls and the cold and hot fluids. The Nusselt number (Nu) is a dimensionless number to assess the intensity of convective heat transfer, which can be calculated as follows:
| |
 | (3) |
where
h is the convective heat transfer coefficient,
Dc is the characteristic size which is equal to 2
H and
λ is the thermal conductivity of the fluid. The convective heat transfer coefficient
h can be obtained based on the average temperature
Tm as:
| |
 | (4) |
where
Tw is the temperature of walls separating the cold and hot fluids, (∂
Tf(
x,
y)/∂
y)|
w/f is the fluid temperature gradient at the wall–fluid interface and vertical lines represent the absolute value symbol. It must be mentioned that a quartic polynomial function is adopted to extrapolate the fluid temperature to determine (∂
Tf(
x,
y)/∂
y)|
w/f.
22 By combining
eqn (3) and
(4), the local Nusselt number Nu(
x) is identified as:
| |
 | (5) |
Fig. 7 displays the variation of local Nu along the flow direction for different surface wettabilities of the solid walls. The local Nu increase along with the enhancement of the wall–fluid interaction for either the cold fluid or the hot fluid, which demonstrates that the increasing surface wettability can effectively strengthen the convective heat transfer. Obviously, the enhancement of the heat transfer is restricted when χ > 2.00. Furthermore, the local Nu, corresponding to seven different scale parameters χ, have the similar tendencies: the local Nusselt numbers are all small in the entrance region and then they ascent and eventually stabilize. In order to explain these series of temperature changes, we calculate the thermal slip length (lk) with eqn (6):
| |
 | (6) |
where
RKap is the Kapitza resistance and Δ
Tw/f is the difference between wall temperature and fluid temperature achieved by using a quartic polynomial function to fit the fluid temperature profiles at the wall–fluid interface.
22 As we can see from
Fig. 8,
lk diminishes along with the increase of
χ. Besides, for both cold and hot fluid sides,
lk are very large in the entrance region and then reduce to steady values in the following region for all cases with different
χ.
Eqn (6) uncovers that the thermal slip length
lk is proportional to the Kapitza resistance at the wall–fluid interfaces. Hence, the improvement of the heat transmission by increasing the surface wettability of the walls can be attributed to the reduction of thermal resistance. At the same time, the larger Kapitza resistance in the entrance region can account for the smaller Nusselt numbers.
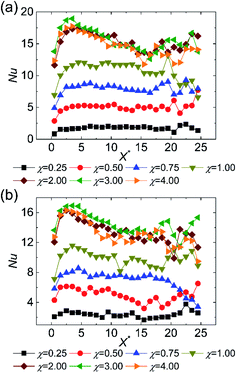 |
| | Fig. 7 The variation of the local Nusselt number along the flow direction at different surface wettabilities for (a) cold fluid and (b) hot fluid. | |
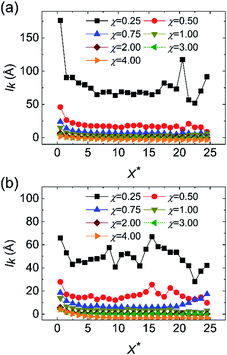 |
| | Fig. 8 The variation of the thermal slip length along the flow direction at different surface wettabilities for (a) cold fluid and (b) hot fluid. | |
The total heat transfer coefficient of the heat exchanger (K), the number of transfer unit (NTU) and the effectiveness of the heat exchanger (η) are also significant indicators to measure the performance of heat exchangers. K is calculated by eqn (7)–(9):
| |
 | (8) |
where
Φ is the total heat load,
A is the heat transfer area, Δ
tm is the logarithmic mean temperature difference (LMTD) and
qm is the mass flow rate. The subscripts 1 and 2 represent the cold and hot fluids and the superscripts ′ and ′′ refer to the inlet and outlet. For the concurrent parallel flow heat exchanger, LMTD is calculated by
eqn (9):
| |
 | (9) |
where

is the temperature difference between the cold and hot fluids at the inlet and

is that at the outlet. NTU and
η are defined as:
| |
 | (10) |
| |
 | (11) |
The variations of K and NTU at different surface wettabilities are displayed in Fig. 9. With the surface wettability enhancing, K increases firstly and then reach a relatively stable level when χ ≥ 2.00. NTU varies in a similar trend and its value enhances from 0.55 to 1.18. Effectiveness η indicates the ratio of the actual heat exchange performance of the heat exchanger to the optimal heat exchange performance. From Fig. 10, we can observe that η increases from 0.36 at χ = 0.25 to a steady value about 0.46 when the wall–fluid interaction is reinforced. In short, Fig. 7–10 demonstrate that the convective heat transfer in nano heat exchangers cannot improve unlimitedly with increasing the parameter χ and it becomes saturated for χ ≥ 2.00.
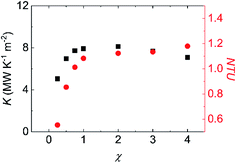 |
| | Fig. 9 The variation of the total heat transfer coefficient of heat exchanger and the number of transfer unit at different surface wettabilities. | |
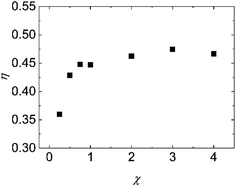 |
| | Fig. 10 The variation of the effectiveness of heat exchanger at different surface wettabilities. | |
To explain above phenomena, we calculate the average fluid density from X* = 0 to X* = 25. As displayed in Fig. 11, the fluid density near the walls fluctuates and there are at least four value peaks at each side of wall–fluid interfaces. The distance between two adjacent peaks is about the argon atom interaction distance (σAr–Ar). The highest peak of the fluid density refers to the mean location of the near-wall fluid atoms which are closest to the wall surfaces. In addition, we observe that the mean location of the near-wall fluid atoms moves towards the nano heat exchanger walls when χ increases.36 It is apparent that stronger wall–fluid interaction allows more fluid atoms to contact with the walls and thus more atoms participate in transporting the heat from the interface. Besides, the increase of the near-wall fluid density is limited when χ ≥ 2.00 for cold and hot fluids. These behaviors of the cold and hot fluids can explain why the enhanced wall–fluid interaction can improve the convective heat transfer and the improvement extent is finite. Furthermore, we monitor the trajectory of the near-wall fluid atoms at χ = 0.25 and χ = 2.00 during the whole 4 ns process of collecting data. As shown in Fig. 12(a), the fluid atoms closest to the nano heat exchanger walls move freely when χ = 0.25. However, the near-wall fluid atoms are trapped by the nano heat exchanger walls when χ = 2.00 and the quasi-solid fluid layers appear at the surface of the nano heat exchanger. To further uncover the heat transfer mechanism in the nano heat exchanger, we calculate the phonon density of states (DOS) of the wall, mainstream fluid and near-wall fluid at χ = 0.25 and χ = 2.00. Mainstream fluid atoms refer to those atoms that are 10 Å away from the nano heat exchanger walls and near-wall fluid atoms represent the atoms at the highest peak of fluid density. By taking the Fourier transform of the velocity autocorrelation function,37–39 DOS can be defined as:
| |
 | (12) |
where
v is the atomic velocity, and the angle brackets denote the ensemble averaging. The DOS of the nano heat exchanger wall, mainstream fluid and near-wall fluid for cold and hot fluids at
χ = 0.25 and
χ = 2.00 are displayed in
Fig. 13. As is shown in
Fig. 13(a) and (b), the DOS of the near-wall fluid is similar to that of the mainstream fluid at
χ = 0.25 for both cold and hot fluid sides, which indicates the near-wall argon atoms show the fluid property. The small overlapping area between the fluid and walls at
χ = 0.25 means the nasty phonon matching and weak convective heat transfer. However, at
χ = 2.00 depicted in
Fig. 13(c) and (d), the DOS of near-wall fluid have the large overlapping area with DOS of the wall and mainstream fluid, which denotes that the near-wall argon atoms behave like the solid coating layers and act as the “phonon bridge” to facilitate the heat transfer between the mainstream fluid and walls at
χ = 2.00.
40 In conclusion, the enhancement of the convective heat transfer in nano heat exchangers when surface wettability boosts could attribute to the following two reasons: (1) stronger wall–fluid interaction attracts more fluid atoms to contact with walls and transport heat; (2) when the wall–fluid interaction is strong, the quasi-solid fluid layers occur at the nano heat exchanger walls, which perform as the coating layers and lead to the “phonon bridge” effect during the heat transfer between the fluids and walls.
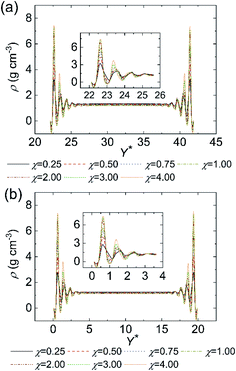 |
| | Fig. 11 The average density profiles along the channel height at different surface wettabilities for (a) cold fluid and (b) hot fluid. The insets are zoom-in images of density at the near-wall regions. | |
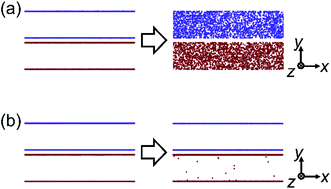 |
| | Fig. 12 The trajectory of the near-wall fluid atoms at (a) χ = 0.25 and (b) χ = 2.00. | |
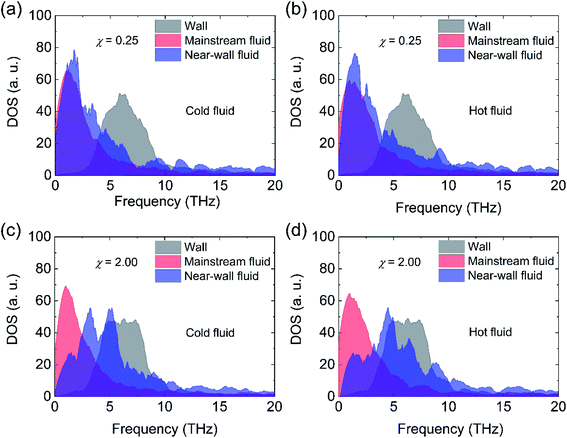 |
| | Fig. 13 The phonon density of states of the wall, mainstream fluid, and near-wall fluid (a) for cold fluid side at χ = 0.25, (b) for hot fluid side at χ = 0.25, (c) for cold fluid side at χ = 2.00 and (d) for hot fluid side at χ = 2.00. | |
Finally, we further compare the Nu values of the cold and hot fluid sides for different surface wettabilities at χ = 0.25, 0.50, 1.00 and 2.00 in Fig. 14. From Fig. 14(a), we can observe that the heat transfer performance of the hot fluid side is better than that of the cold fluid side at χ = 0.25. Along with the increase of χ, the heat transfer performances of the cold and hot fluid sides are reversed in Fig. 14(b)–(d). Generally, the temperature jump and velocity slip play the prominent roles in the convective heat transfer at nanoscale but they have the opposite effects. When the temperature jump exists at the wall–fluid interfaces, it generates a thermal resistance and is adverse to the convective heat transfer. On the contrary, the existence of the velocity slip is beneficial to the convective heat transfer.15,41,42 Here the thermal slip length and the velocity slip length (ls) are employed to evaluate the temperature jump and velocity slip. With the aim of understanding the transformation of Nu on the cold fluid side and hot fluid side when χ raises from 0.25 to 2.00, lk and ls at χ = 0.25, 0.50, 1.00 and 2.00 are exhibited in Fig. 15 and 16. Similar to the calculation of the temperature slip length, the velocity slip length is defined as:
| |
 | (13) |
where Δ
uw/f is the difference between the fluid velocity at the walls and the wall velocity (
uw = 0 m s
−1), (∂
uf(
x,
y)/∂
y)|
w/f is the fluid velocity gradient at the walls. Quadratic polynomial functions are used to extrapolate the velocity profile in order to calculate
ls.
22 The thermal slip length of the cool fluid side is larger than that of the hot fluid side at
χ = 0.25 (
Fig. 15(a)), which means that more pronounced temperature jump occurs on the cold fluid side and leads to the greater Kapitza resistance. The larger Kapitza resistance occurs on the hot fluid side since the fact that wall atoms on the hot fluid side own the higher temperature, which makes them have higher kinetic energy and vibrate more violently. On the other hand, the high temperature can motivate more phonons, which are conducive to the heat transfer.
37,43 Thus, the Nu value of the hot fluid side overweighs that of the cold fluid side at
χ = 0.25 as shown in
Fig. 14(a). With the increase of the wall–fluid interaction, the temperature slip length of the cold fluid side tends to be the same as that of the hot fluid side, which reflects that the temperature jump at both sides of the cold and hot fluids are almost identical. However, in
Fig. 16(a) and (b),
ls of the cold and hot fluid sides show little distinction when
χ is equal to 0.25 or 0.50. When
χ = 1.00 and 2.00 in
Fig. 16(c) and (d),
ls of the cold side is larger than that of the hot fluid. This phenomenon derives from the fact that the lower fluid temperature results in the higher fluid viscosity, which comes into being the more severe velocity slip on the cold fluid side. Therefore, due to the more ardent velocity slip on the cold fluid side, the convective heat transfer of the cold fluid side is superior to that of hot fluid side when wall–fluid interaction is strong. At
χ < 1, the Nu diversity between the cold and hot sides attributes to the different Kapitza resistance of the cold and hot fluid sides.
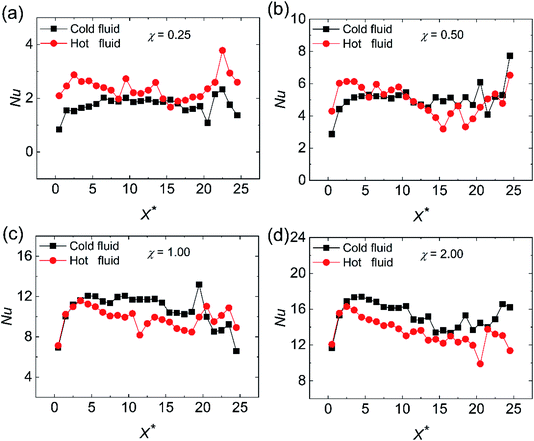 |
| | Fig. 14 The comparison of the local Nusselt number for the cold fluid side and hot fluid side at different surface wettabilities at (a) χ = 0.25, (b) χ = 0.50, (c) χ = 1.00 and (d) χ = 2.00. | |
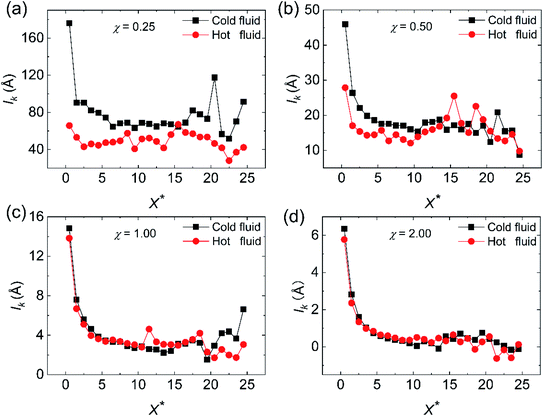 |
| | Fig. 15 The comparison of the thermal slip length for the cold fluid side and hot fluid side at different surface wettabilities for (a) χ = 0.25, (b) χ = 0.50, (c) χ = 1.00 and (d) χ = 2.00. | |
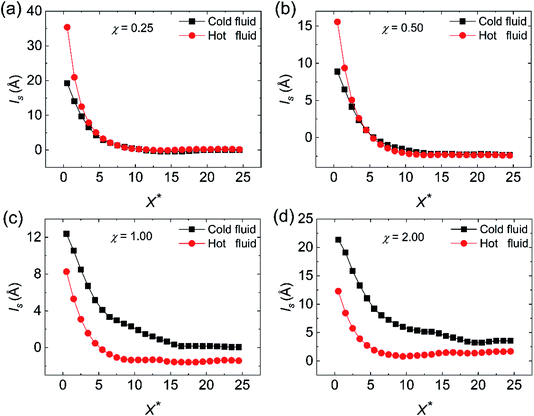 |
| | Fig. 16 The comparison of the velocity slip length for the cold fluid side and hot fluid side at different surface wettabilities for (a) χ = 0.25, (b) χ = 0.50, (c) χ = 1.00 and (d) χ = 2.00. | |
All in all, the heat exchanger at nanoscale exhibits numerous diversities in flow and heat transfer characteristics in comparison with that at macroscale. Since the spatial scale of the system at nanoscale becomes comparable to the phonon mean free path of the fluid atoms, the continuum hypothesis is invalid and the velocity and temperature slips at the wall–fluid interface occur in nano heat exchangers. As we all know, the convective heat transfer in the thermal and hydraulic developing region is better than that in the fully developed region in macroscopic heat exchanger on account of the more violent fluid disturbances in the inlet region. However, the heat transfer capability in the inlet region is weaker than that in the fully developed region at nanoscale because of the more ardent temperature jump in the inlet region of nano heat exchanger.
4. Conclusions
In this work, we implement the molecular dynamics simulations to uncover the convective heat transfer mechanism in the nano heat exchanger. A modified thermal pump method is proposed to investigate the thermal and flow characteristics in nano heat exchangers using the molecular dynamics simulation. Different from the heat exchanger at macroscale, temperature jump and velocity slip are discovered in nano heat exchanger. Owing to the insufficient thermal and hydraulic development accompanying with the greater Kapitza resistance in the entrance region, the heat transfer in the entrance region is worse than that in the thermal and hydraulic fully developed region. By enhancing the surface wettability of the solid walls, the heat transfer performance of the nano heat exchanger can be promoted due to two reasons: (1) strong wall–fluid interaction causes more near-wall fluid atoms to contact with walls and transport heat; (2) the quasi-solid fluid layers emerge at the walls when the surface wettability enhances, which gives rise to the “phonon bridge” effect between the fluids and walls. In addition, the Kapitza resistance and velocity slip co-determine the convective heat transfer of the cold and hot fluid sides at nanoscale. When the surface wettability of nano heat exchanger is weak, the convective heat transfer of the hot fluid side is superior to that of the cold fluid side because of the Kapitza resistance. When the surface wettability of the nano heat exchanger is strong, the larger velocity slip leads to better heat transfer on the cold fluid side than that on the hot fluid side. Our work is expected to provide the fundamental knowledge for the design of the nano heat exchangers and the thermal management of the micro/nanodevices.
Conflicts of interest
There are no conflicts of interest to declare.
Acknowledgements
This work was supported by the National Natural Science Foundation of China (No. 51806123), the Key R&D Program of Shandong Province, China (No. 2019GGX101030), the China Postdoctoral Science Foundation (No. 2018M642654), the Natural Science Foundation of Shandong Province, China (No. ZR2018BEE025, No. ZR2019MEE024), the Fundamental Research Funds for the Central Universities, China (No. 2018JC037), and the Fundamental Research Funds of Shandong University, China (No. 2018TB007).
References
- R. R. Schaller, IEEE Spectrum, 1997, 34, 52–59 Search PubMed
 .
. - M. Lundstrom, Science, 2003, 299, 210–211 CrossRef CAS PubMed
 .
. - A. L. Moore and L. Shi, Mater. Today, 2014, 17, 163–174 CrossRef CAS
 .
. - E. Pop, Nano Res., 2010, 3, 147–169 CrossRef CAS
 .
. - S. C. Yang, Microfluid. Nanofluidics, 2006, 2, 501–511 CrossRef CAS
 .
. - J. L. Barrat and F. Chiaruttini, Mol. Phys., 2003, 101, 1605–1610 CrossRef CAS
 .
. - N. Zucchetto and D. Bruhwiler, RSC Adv., 2015, 5, 74638–74644 RSC
 .
. - S. S. J. Aravind and S. Ramaprabhu, RSC Adv., 2013, 3, 4199–4206 RSC
 .
. - J. Jamali and S. N. Shoghl, RSC Adv., 2014, 4, 57958–57966 RSC
 .
. - B. Liu, X. Li, C. Qi, T. Mai, K. Zhan, L. Zhao and Y. Shen, RSC Adv., 2018, 8, 1461–1468 RSC
 .
. - D. Tuckerman and R. Pease, IEEE Trans. Electron Devices, 1981, 28, 1230–1231 Search PubMed
 .
. - H. Wu and P. Cheng, Int. J. Heat Mass Transfer, 2003, 46, 2547–2556 CrossRef CAS
 .
. - C. Friedrich and S. Kang, Precis. Eng., 1994, 16, 56–59 CrossRef
 .
. - S. Bigham, H. Shokouhmand, R. N. Isfahani and S. Yazdani, Numer. Heat Transfer, Part A, 2011, 59, 209–230 CrossRef CAS
 .
. - H. M. Hettiarachchi, M. Golubovic, W. M. Worek and W. Minkowycz, Int. J. Heat Mass Transfer, 2008, 51, 5088–5096 CrossRef
 .
. - H. Mohammed, P. Gunnasegaran and N. Shuaib, Int. Commun. Heat Mass Tran., 2011, 38, 63–68 CrossRef
 .
. - Q. Xue, Y. Tao, Z. Liu, S. Lu, X. Li, T. Wu, Y. Jin and X. Liu, RSC Adv., 2015, 5, 25684–25692 RSC
 .
. - D. Niu and G. H. Tang, RSC Adv., 2018, 8, 24517–24524 RSC
 .
. - A. D. Pierro, M. D. M. Bernal, D. Martinez, B. Mortazavi, G. Saracco and A. Fina, RSC Adv., 2019, 9, 15573–15581 RSC
 .
. - J. Zhang, F. Xu, Y. Hong, Q. Xiong and J. Pan, RSC Adv., 2015, 5, 89415–89426 RSC
 .
. - A. J. Markvoort, P. Hilbers and S. Nedea, Phys. Rev. E: Stat., Nonlinear, Soft Matter Phys., 2005, 71, 066702 CrossRef CAS PubMed
 .
. - S. Ge, Y. Gu and M. Chen, Mol. Phys., 2015, 113, 703–710 CrossRef CAS
 .
. - Y. Gu, S. Ge and M. Chen, Mol. Phys., 2016, 114, 1922–1930 CrossRef CAS
 .
. - D. C. Marable, S. Shin and A. Y. Nobakht, Int. J. Heat Mass Transfer, 2017, 109, 28–39 CrossRef CAS
 .
. - P. Chakraborty, T. Ma, L. Cao and Y. Wang, Int. J. Heat Mass Transfer, 2019, 136, 702–708 CrossRef CAS
 .
. - M. B. Motlagh and M. Kalteh, Int. J. Therm. Sci., 2020, 156, 106472 CrossRef
 .
. - J. Sun and Z. X. Li, Mol. Phys., 2008, 106, 2325–2332 CrossRef CAS
 .
. - J. Sun and Z. X. Li, Mol. Simul., 2009, 35, 228–233 CrossRef CAS
 .
. - C. Hu, D. Tang, J. Lv, M. Bai and X. Zhang, Phys. Chem. Chem. Phys., 2019, 21, 17786–17791 RSC
 .
. - H. Noorian, D. Toghraie and A. Azimian, Heat Mass Tran., 2014, 50, 95–104 CrossRef CAS
 .
. - J. Lv, W. Cui, M. Bai and X. Li, Microfluid. Nanofluidics, 2011, 10, 475–480 CrossRef CAS
 .
. - A. Rahman, Phys. Rev., 1964, 136, A405 CrossRef
 .
. - C. L. Kong, J. Chem. Phys., 1973, 59, 2464–2467 CrossRef CAS
 .
. - G. Nagayama and C. Ping, Int. J. Heat Mass Transfer, 2004, 47, 501–513 CrossRef CAS
 .
. - H. Zhang, Z. Zhang and H. Ye, Microfluid. Nanofluidics, 2012, 12, 107–115 CrossRef
 .
. - J. Lu, Q. Ge, A. Raza and T. Zhang, J. Phys. Chem. C, 2019, 123, 12753–12761 CAS
 .
. - D. Han, X. Wang, W. Ding, Y. Chen, J. Zhang, G. Xin and L. Cheng, Nanotechnology, 2018, 30, 075403 CrossRef PubMed
 .
. - X. Wang, J. Zhang, Y. Chen and P. K. Chan, Phys. Chem. Chem. Phys., 2017, 19, 15933–15941 RSC
 .
. - X. Wang, M. Wang, Y. Hong, Z. Wang and J. Zhang, Phys. Chem. Chem. Phys., 2017, 19, 24240–24248 RSC
 .
. - T. S. English, J. C. Duda, J. L. Smoyer, D. A. Jordan, P. M. Norris and L. V. Zhigilei, Phys. Rev. B: Condens. Matter Mater. Phys., 2012, 85, 035438 CrossRef
 .
. - M. Shojaeian and S. A. R. Dibaji, Int. Commun. Heat Mass Tran., 2010, 37, 324–329 CrossRef
 .
. - Z. Duan and B. He, Int. Commun. Heat Mass Tran., 2014, 56, 25–30 CrossRef
 .
. - X. Wang, D. Han, Y. Hong, H. Sun, J. Zhang and J. Zhang, ACS Omega, 2019, 4, 10121–10128 CrossRef CAS PubMed
 .
.
|
| This journal is © The Royal Society of Chemistry 2020 |
Click here to see how this site uses Cookies. View our privacy policy here.  Open Access Article
 *a
*a
![[thin space (1/6-em)]](https://www.rsc.org/images/entities/char_2009.gif) 000 argon atoms are randomly distributed in each channel, which means the corresponding average fluid density is about 1.2 g cm−3. With the aim of better simulating the convective heat transfer at nanoscale, Markvoort et al. and Ge et al. put forward two simulation methods where the fluid is just driven in a forcing region and the fluid temperature is controlled only in a temperature reset region.21,22 The difference between their methods is that: the method used by Markvoort et al. puts the temperature reset region in front of the forcing region, while Ge et al. drive the fluid before resetting the inlet fluid temperature. Due to the different heat transfer conditions in our work (cold and hot fluids undergo the convective heat transfer at nanoscale) from the previous studies at nanoscale (the fluid is cooled or heated by walls with the constant temperature or fixed heat flux),21,22 the existing simulation settings are no longer suitable for our simulation owing to the following reasons: (1) adding force in a specific region leads to an abnormally high temperature field in this region which acts as an internal heat source and generates the axial heat conduction with the adjacent fluid region; (2) if the forcing region locates behind the temperature reset region, the inlet fluid temperature could deviate from the desired temperature because of the unrealistic axial conduction; (3) if the inlet temperature resetting is implemented after driving the fluid, the outlet fluid temperature is influenced by the image atoms in the forcing region due to the periodic boundary condition in the simulation. For the convective heat transfer with the condition that cold and hot fluids exchange the heat, the temperature difference of cold and hot fluids plays an important role in the convective heat transfer and needs to be more accurate. In order to better simulate the convective heat transfer process between the cold and hot fluids at nanoscale, an modified thermal pump method is proposed in this work, which is a combination of the previous work.21,22 We divide the fluid domain into four independent regions: an outlet temperature reset region, a forcing region, an inlet temperature reset region and a data collection region, which is shown in Fig. 1. The outlet temperature reset region locates in the range of −10a Å < x < −8a Å and the inlet temperature reset region locates in the range of −2a Å < x < 0 Å. Both of them use the Langevin thermostats to rescale the thermal velocities of the fluid atoms after removing the streaming velocity bias. The cold fluid temperature is kept at 200 K and the hot fluid temperature is kept at 400 K at their corresponding temperature reset regions. The forcing region locates in the range of −8a Å < x < −2a Å, where a constant body force fb,x = 2 × 10⁻¹¹ N is applied to the argon atoms to drive the cold and hot fluids. To ensure that the cold and hot fluids do not transport the heat in the temperature reset regions and forcing region, the solid atoms, locating in the range of −10a Å < x < 0 Å, are frozen. The data collection region locates in the range of 0 Å < x < 100a Å, where the convective heat transfer process is simulated and the simulation results are recorded.
000 argon atoms are randomly distributed in each channel, which means the corresponding average fluid density is about 1.2 g cm−3. With the aim of better simulating the convective heat transfer at nanoscale, Markvoort et al. and Ge et al. put forward two simulation methods where the fluid is just driven in a forcing region and the fluid temperature is controlled only in a temperature reset region.21,22 The difference between their methods is that: the method used by Markvoort et al. puts the temperature reset region in front of the forcing region, while Ge et al. drive the fluid before resetting the inlet fluid temperature. Due to the different heat transfer conditions in our work (cold and hot fluids undergo the convective heat transfer at nanoscale) from the previous studies at nanoscale (the fluid is cooled or heated by walls with the constant temperature or fixed heat flux),21,22 the existing simulation settings are no longer suitable for our simulation owing to the following reasons: (1) adding force in a specific region leads to an abnormally high temperature field in this region which acts as an internal heat source and generates the axial heat conduction with the adjacent fluid region; (2) if the forcing region locates behind the temperature reset region, the inlet fluid temperature could deviate from the desired temperature because of the unrealistic axial conduction; (3) if the inlet temperature resetting is implemented after driving the fluid, the outlet fluid temperature is influenced by the image atoms in the forcing region due to the periodic boundary condition in the simulation. For the convective heat transfer with the condition that cold and hot fluids exchange the heat, the temperature difference of cold and hot fluids plays an important role in the convective heat transfer and needs to be more accurate. In order to better simulate the convective heat transfer process between the cold and hot fluids at nanoscale, an modified thermal pump method is proposed in this work, which is a combination of the previous work.21,22 We divide the fluid domain into four independent regions: an outlet temperature reset region, a forcing region, an inlet temperature reset region and a data collection region, which is shown in Fig. 1. The outlet temperature reset region locates in the range of −10a Å < x < −8a Å and the inlet temperature reset region locates in the range of −2a Å < x < 0 Å. Both of them use the Langevin thermostats to rescale the thermal velocities of the fluid atoms after removing the streaming velocity bias. The cold fluid temperature is kept at 200 K and the hot fluid temperature is kept at 400 K at their corresponding temperature reset regions. The forcing region locates in the range of −8a Å < x < −2a Å, where a constant body force fb,x = 2 × 10⁻¹¹ N is applied to the argon atoms to drive the cold and hot fluids. To ensure that the cold and hot fluids do not transport the heat in the temperature reset regions and forcing region, the solid atoms, locating in the range of −10a Å < x < 0 Å, are frozen. The data collection region locates in the range of 0 Å < x < 100a Å, where the convective heat transfer process is simulated and the simulation results are recorded.


 is the temperature difference between the cold and hot fluids at the inlet and
  is that at the outlet. NTU and η are defined as:


.
.
.
.
.
.
.
.
.
.
.
.
.
.
.
.
.
.
.
.
.
.
.
.
.
.
.
.
.
.
.
.
.
.
.
.
.
.
.
.
.
.
.


