 Open Access Article
Electro-spinning fabrication of nitrogen, phosphorus co-doped porous carbon nanofiber as an electro-chemiluminescent sensor for the determination of cyproheptadine†
Hao Cheng*a,
Zhengyuan Zhou a and
Tao Liu
 *b
*b
aGuangxi Key Laboratory of Green Processing of Sugar Resources, College of Biological and Chemical Engineering, Guangxi University of Science and Technology, Liuzhou 545006, Guangxi, P. R. China. E-mail: iamchenghao@126.com
bDepartment of Chemistry and Hong Kong Branch of Chinese National Engineering Research Center for Tissue Restoration & Reconstruction, Hong Kong University of Science and Technology (HKUST), Clear Water Bay, Kowloon, Hong Kong, China. E-mail: liutaozhx@ust.hk
First published on 17th June 2020
Abstract
Nitrogen, phosphorus co-doped porous carbon nanofiber (N, P-PCNF) is prepared by electrospinning the mixed solution of polyacrylonitrile (PAN), polyvinylpyrrolidone (PVP) and phosphoric acid followed by carbonization. The N, P-PCNF as a modified electrode material is directly used to fabricate an electro-chemiluminescent sensor for determination of cyproheptadine, and owing to the large specific area, more active sites and promotion of electron transfer, the sensor exhibits high electro-catalytic activity, high sensitivity, a good linear relationship ranging from 1.0 × 10⁻⁷ to 1.0 × 10⁻⁵ mol L−1 and a low detection limit (2.89 × 10⁻⁸ mol L−1). In addition, the good recoveries indicate that the sensor is a promising device for the detection of cyproheptadine in real samples.
1. Introduction
Cyproheptadine (CPH, Scheme 1 in ESI†), an anti-allergy drug, can effectively alleviate allergic symptoms such as hives, watery eyes, and itching, caused by the antagonizing effects of histamine on blood vessels and bronchial smooth muscles.1–3 However, an overdose of CPH might cause coma and even death, especially in children and the elderly,4 thus it has been one of the prohibited components in provender and drinking water for animals in China.5 To prevent safety problems due to drug abuse, it is important to establish a simple, selective, and sensitive method to detect CPH. Up to now, there have been many approaches to identify CPH including liquid chromatography (HPLC),6 liquid chromatography-mass spectrometry (LC-MS),7 capillary electrophoresis,8 and UV spectroscopy.1 The main disadvantages of these methods are that expensive instruments and long testing time are usually demanded.In recent years, electrochemiluminescence (ECL) as a newly developed analytical method has obtained considerable attention from researchers because of its simple equipment, easy operation, fast response, and high sensitivity,9,10 whose applied light is produced by the substance at excited state returning to the ground state.11 Among the ECL systems, the luminescence system based Ru(bpy)32+ has been mostly applied in various fields for its high luminescence efficiency, good solubility, high chemical stability, and regenerability.12,13 Moreover, the on-surface reactions of electron-transfer and light-emitting make it feasible to increase the ability of electron transfer by selecting electrode modified materials, leading to a positive influence on the sensitivity promotion and detection limit expansion of ECL detection.
Carbon nanofibers (CNFs) are now popular because of good electrical conductivities, superior stiffness and thermal conductivities, and widely applied in supercapacitors, batteries, and sensors.14–16 Also, some studies have reported that CNFs can improve electrical conductivities and promote electron transfer.17,18 Electro-spinning is a simple, efficient and promising method to fabricate interconnected and ultrafine CNFs with polymer solutions (polyacrylonitrile (PAN), polyvinylpyrrolidone (PVP), polybenzimidazole and so on)19–21 and subsequent process for carbonization and stabilization. Furnishing effective surface area for ion storage and transportation, porous carbon nanofibers (PCNFs) excellently overcome some shortcomings of CNFs.19 According to previous studies, PVP can generate porosity.22 Heteroatom doping can improve the physical and chemical properties of carbonaceous materials and increase the active sites.19,23 CNFs obtained via electrospinning is a perfect substrate or carrier for impurity doping. For example, N-doped carbon materials have been used in supercapacitors,24 batteries25 and sensors.26 He et al. fabricated nitrogen-doped CNFs as the negative electrode and achieved excellent energy storage performance.25 Phosphorus is in the same family with nitrogen while it possesses the higher electron-donating ability and exhibits stronger n-type behavior.27,28 Cui and coworkers made phosphorus-doped helical carbon nanofibers as an enhanced sensing platform for electrochemical detection of carbendazim, obtaining excellent results.29 Compared with single-atom doping, multi-atom co-doping can produce multiple functional groups, enhancing the overall performance.30,31 Liu's group synthesized N, P-co-doped carbon microspheres applied to the detection of acetaminophen realizing better electrocatalytic performance compared with N-doped carbon microspheres.32
In this study, we synthesize nitrogen and phosphorus co-doped porous carbon nanofibers (N, P-PCNF) and apply them to detect cyproheptadine. The N, P-PCNF is prepared by electrospinning and further carbonization process, with PAN as carbon source, PVP as a porogen, and phosphoric acid as a phosphorus source, respectively. More importantly, the N, P-PCNF can be directly used as electrode modified materials to fabricate the electroluminescent sensor for detecting cyproheptadine.
2. Results and discussion
The surface morphology of CNF and N, P-PCNF is clearly shown in Fig. 1a and b. The images exhibit homogeneous network interlaced morphology by continuous fibers whose surface is smooth, which proves the fibrous materials have been synthesized and are beneficial to electrochemical performance. It can be obviously found that there is no difference in external morphology of CNF and N, P-PCNF, which means that nitrogen and phosphorus doping may occur at molecular level.33 The results of the EDS elemental mapping shown in Fig. 1c–f further demonstrate that nitrogen and phosphorus have been uniformly distributed in the materials.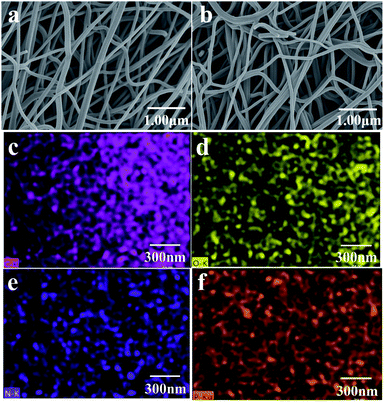 | ||
| Fig. 1 SEM images of CNF (a) and N, P-PCNF (b); EDX elemental mapping of C (c), N (d), O (e), P (f) of P-PCNF. | ||
The element compositions and the chemical bond configurations of samples are analyzed by X-ray photoelectron spectroscopy (XPS). According to Fig. 2a, the N, P-PCNF consists of C (81.1%), N (7.38%), O (9.89%), and P (1.62%), and the survey spectrum of the sample shows a predominant C 1s peak at 284.6 eV, O 1s peak at 532 eV, N 1s peak at 400 eV and a weak P 2p peak at 133.3 eV,34 in which PAN and PVP is nitrogen source. The C 1s peak can be deconvoluted into four peaks, corresponding to C–C (284.7 eV), C–P (285.9 eV), C–O (287.2 eV) and C–N (289 eV) bonding in Fig. 2b.35,36 As exhibited in Fig. 2c, the peaks of high-resolution O 1s at 531.5 eV and 533 eV are attributed to C![[double bond, length as m-dash]](https://www.rsc.org/images/entities/char_e001.gif) O and C–O, respectively.37 In Fig. 2d, the N 1s spectra can be divided into four peaks located at 398.3 eV, 399.8 eV, 401.2 eV and 402.2 eV corresponding to pyridinic-N, pyrrolic-N, graphitic-N and oxidized-N, respectively.33,38 As depicted in Fig. 2e, the high-resolution P 2p spectrum shows two peaks centered at 133 eV and 134.4 eV, corresponding to P–C and P–O, respectively39,40 and the existence of P–C suggests that P atoms have been successfully incorporated into the carbon framework.
O and C–O, respectively.37 In Fig. 2d, the N 1s spectra can be divided into four peaks located at 398.3 eV, 399.8 eV, 401.2 eV and 402.2 eV corresponding to pyridinic-N, pyrrolic-N, graphitic-N and oxidized-N, respectively.33,38 As depicted in Fig. 2e, the high-resolution P 2p spectrum shows two peaks centered at 133 eV and 134.4 eV, corresponding to P–C and P–O, respectively39,40 and the existence of P–C suggests that P atoms have been successfully incorporated into the carbon framework.
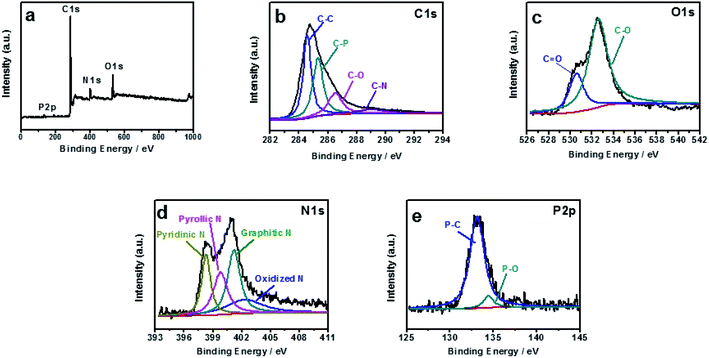 | ||
| Fig. 2 XPS survey spectra (a), high-resolution XPS spectra of C 1s peak (b), O 1s peak (c), N 1s peak (d), and P 2p peak of N, P-PCNF (e). | ||
The XRD pattern of N, P-PCNF is shown in Fig. 3a. It can be obviously seen that there are two peaks at 2θ = 24° and 43° assigned to the (002) plane of graphite structure and the (101) planes of amorphous carbon structure, which confirms that the sample is partially graphitized amorphous carbon material.41 Fig. 3b shows the Raman spectrum of the material. The two peaks center around 1590 cm−1 representing the sp2 graphite carbon (G band) and 1330 cm−1 indicating the defects of sp3 carbon (D band), respectively. The intensity ratio of ID/IG is 1.23, suggesting that the characteristic of N, P-PCNF is disordered and graphite,42 which is consistent with the results of XRD.
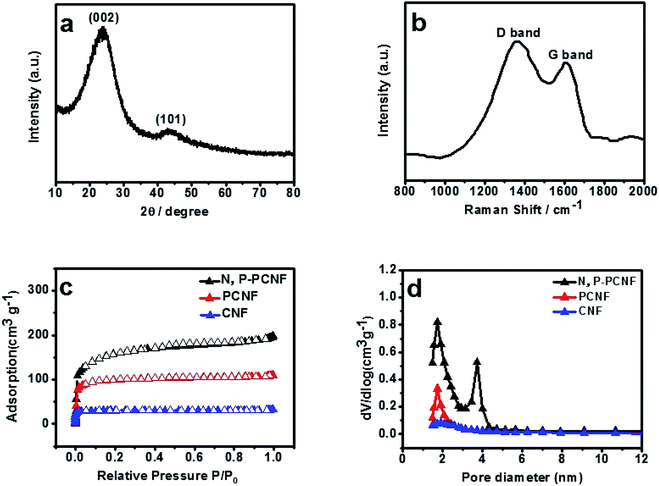 | ||
| Fig. 3 XRD pattern (a), Raman spectrum (b) of N, P-PCNF, N2 adsorption–desorption isotherms (c) and pore size distribution curve (d) of the N, P-PCNF. | ||
The texture properties of N, P-PCNF are estimated by the N2 adsorption–desorption measurement, and the results are shown in Fig. 3. The Fig. 3c exhibits that the isotherms of all samples belong to the type I with a steep at low relative pressures and an almost horizontal plateau by IUPC classification, which proves that the N, P-PCNF possesses micropores.43 The pore size distribution (PSD) curves are presented in Fig. 3d, indicating that the N, P-PCNF is supposed to be micropore with a fraction of mesopores, which is the result of that gases like CO2, N2O, H2O released by PVP to create pores during carbonization process.44 In addition, the pore volume parameters and the specific surface area (SSA) are also evaluated by the BET method. From CNF to N, P-PCNF, the SSA increases to 526 m2 g−1 from 94 m2 g−1, meanwhile, the total pore volume increase to 0.31 cm3 g−1 from 0.04 cm3 g−1.
2.1 Optimization of experimental conditions
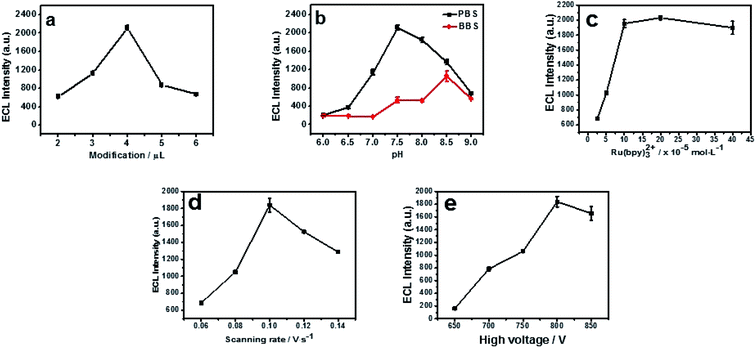
In order to get a low background and the best ECL sensitivity of cyproheptadine, the parameters including the type and pH of buffer solution, the volume of N, P-PCNF modification, the concentration of Ru (bpy)32+, the scan rate and the negative high voltage were optimized.2.2 The detection of cyproheptadine on the N, P-PCNF/GCE
Under the optimum conditions, the detection of cyproheptadine is carried out on the N, P-PCNF/GCE. As shown in Fig. 5a, the ECL intensity increases with the increasing concentration of cyproheptadine. There is a good linear relationship between the concentration and ECL intensity ranging from 1.0 × 10⁻⁷ to 1.0 × 10⁻⁵ mol L−1, and the linear equation is y = 175.83x + 8.49 (R2 = 0.999, Fig. 5b). The limit of detection (LOD) is calculated as 2.89 × 10⁻⁸ mol L−1 (S/N = 3). Compared with other methods of detecting cyproheptadine as depicted in Table 1, the N, P-PCNF/GCE for the detection of cyproheptadine has a wide detection range and high sensitivity.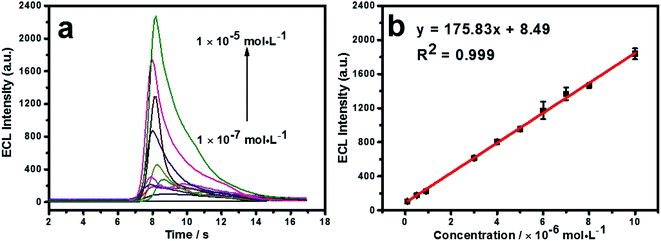 | ||
| Fig. 5 The ECL intensity with different concentrations of cyproheptadine (a) and the calibration curve of ECL responses to cyproheptadine concentration (b). | ||
| Methods | Linear range (mol L−1) | Detection limit (mol L−1) | References |
|---|---|---|---|
| a Dispersive liquid–liquid microextraction. | |||
| DLLMEa-HPLC | 5.8 × 10⁻⁷ to 1.3 × 10⁻⁵ | 3.83 × 10⁻⁸ | 47 |
| HPLC | 2.9 × 10⁻⁷ to 1.5 × 10⁻⁴ | — | 6 |
| LC-MS/MS | 2.9 × 10⁻⁹ to 2.9 × 10⁻⁷ | 2.52 × 10⁻⁹ | 7 |
| UV-spectrophotometric | 5.9 × 10⁻⁶ to 5.9 × 10⁻⁵ | 6.14 × 10⁻⁷ | 1 |
| ECL | 1.0 × 10⁻⁷ to 1.0 × 10⁻⁵ | 2.89 × 10⁻⁸ | This work |
2.3 Selectivity, reproducibility, and repeatability of the modified electrode
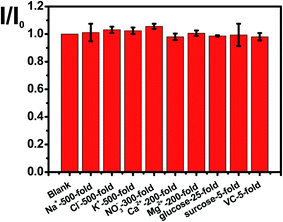
The selectivity of N, P-PCNF modified GCE for detecting cyproheptadine is studied by an interference experiment at the optimal conditions. Fig. 6 illustrates that 500 times of Na+, Cl−, K+, 300 times of NO3−, 200 times of Ca2+ and Mg2+, 25 times glucose, and 5 times of sucrose and ascorbic acid have no interference on the detection of 1.0 × 10⁻⁵ mol L−1 cyproheptadine, suggesting a good selectivity.The high reproducibility and repeatability are important characters for a modified electrode. In this study, the reproducibility is investigated by that five modified electrodes fabricated by the same method to detect cyproheptadine, and the relative standard deviation (RSD) at 3.97% shows good reproducibility. Meanwhile, a modified electrode is used to detect cyproheptadine repeatedly for ten times and the RSD at 4.36% indicating a good repeatability.
2.4 Analysis of the real samples
To evaluate the practicability of the proposed method, the N, P-PCNF modified GCE is used to detect cyproheptadine in tablets of cyproheptadine hydrochloride. Ten cyproheptadine hydrochloride tablets are crushed to mix evenly, and the mass of one tablet is weighed and dissolved in deionized water to configure 1.0 × 10⁻⁵ mol L−1 solution. The sample is detected at the optimum conditions and the RSD is 4.07%. As exhibited in Table 2, the recoveries are in the range of 99.35% to 100.64%, showing the method mentioned for the determination of cyproheptadine is effective in practice.| Sample (×10−5 mol L−1) | Added (×10−6 mol L−1) | Actual (×10−6 mol L−1) | Founded (×10−6 mol L−1) | Recovery (%) | R. S. D. (%, n = 3) |
|---|---|---|---|---|---|
| 1.0 | 1.0 | 5.5 | 5.56 ± 0.03 | 100.64 | 1.16 |
| 5.0 | 7.5 | 7.30 ± 0.20 | 99.35 | 1.97 | |
| 10.0 | 10.0 | 10.00 ± 0.50 | 99.92 | 3.76 |
3. Conclusions
In this study, the N, P-PCNF is fabricated successfully by electrospinning the mix solution of PAN, PVP and phosphoric acid followed by carbonization. The resulting N, P-PCNF with the N and P doped offers a large specific surface area, excellent conductivity, more active sites by increasing more defects, and well defined porous structure which accelerates electron transfer. The results demonstrate that N, P-PCNF/GCE has a good electrocatalytic activity to the determination of CPH, and can be applied in the detection of real samples due to high sensitivity, low detection limit, wide detection range and good recoveries.Conflicts of interest
There are no conflicts to declare.Acknowledgements
This work was supported by National Natural Science Foundation of China(no. 20968005) and the Opening Project of Guangxi Key Laboratory of Clean Pulp & Papermaking and Pollution Control (KF201812-4).References
- S. D. Patil, T. Dugaje and S. J. Kshirsagar, Asian J. Res. Chem., 2019, 12, 112–115 CrossRef.
- Y.-H. Lin, S.-K. Hung, W.-Y. Chiou, M.-S. Lee, B.-J. Shen, L.-C. Chen, D.-W. Liu, W.-T. Tsai, P.-H. Lin and Y.-T. Shih, Medicine, 2016, 95(34), 1–9 CrossRef PubMed.
- J. C. Szepietowski and R. Reszke, in Itch-Management in Clinical Practice, Karger Publishers, 2016, vol. 50, pp. 124–132 Search PubMed.
- S. L. Merhar, S. P. Pentiuk, V. A. Mukkada, J. Meinzen-Derr, A. Kaul and D. R. Butler, Acta Paediatr., 2016, 105, 967–970 CrossRef CAS PubMed.
- M. Guo, L. Sun, L. Liu, S. Song, H. Kuang and G. Cui, Food Agric. Immunol., 2018, 29, 941–952 CrossRef CAS.
- J. Yang, Z. Wang, T. Zhou, X. Song, Q. Liu, Y. Zhang and L. He, J. Chromatogr. B, 2015, 990, 39–44 CrossRef CAS PubMed.
- X. Feás, L. Ye, S. V. Hosseini, C. A. Fente and A. Cepeda, J. Pharm. Biomed. Anal., 2009, 50, 1044–1049 CrossRef PubMed.
- D. Zhu, X. Li, J. Sun and T. You, Talanta, 2012, 88, 265–271 CrossRef CAS PubMed.
- J. Sun, W. Gao, L. Qi, Y. Song, P. Hui, Z. Liu and G. Xu, Anal. Bioanal. Chem., 2018, 410, 2315–2320 CrossRef CAS PubMed.
- J. Yin, X. Chen and Z. Chen, Microchem. J., 2019, 145, 295–300 CrossRef CAS.
- Y. Wu, Z. Zheng, J. Yang, Y. Lin, X. Zhang, Y. Chen and W. Gao, J. Electroanal. Chem., 2018, 817, 118–127 CrossRef CAS.
- T. H. Fereja, S. A. Kitte, D. Snizhko, L. Qi, A. Nsabimana, Z. Liu and G. Xu, Anal. Bioanal. Chem., 2018, 410, 6779–6785 CrossRef CAS PubMed.
- C. Miao, A. Zhang, Y. Xu, S. Chen, F. Ma, C. Huang and N. Jia, Sensor. Actuator. B Chem., 2015, 213, 5–11 CrossRef CAS.
- L. Li, X. Zhang, Z. Zhang, M. Zhang, L. Cong, Y. Pan and S. Lin, J. Mater. Chem. A, 2016, 4, 16635–16644 RSC.
- Z. He, M. Li, Y. Li, J. Zhu, Y. Jiang, W. Meng, H. Zhou, L. Wang and L. Dai, Electrochim. Acta, 2018, 281, 601–610 CrossRef CAS.
- L. Li, T. Zhou, G. Sun, Z. Li, W. Yang, J. Jia and G. Yang, Electrochim. Acta, 2015, 152, 31–37 CrossRef CAS.
- L. Wu, X. Zhang and H. Ju, Anal. Chem., 2007, 79, 453–458 CrossRef CAS PubMed.
- Q. Zhao, H. Xie, H. Ning, J. Liu, H. Zhang, L. Wang, X. Wang, Y. Zhu, S. Li and M. Wu, J. Alloys Compd., 2018, 737, 330–336 CrossRef CAS.
- W. Yang, W. Yang, L. Kong, A. Song, X. Qin and G. Shao, Carbon, 2018, 127, 557–567 CrossRef CAS.
- S. Agarwal, A. Greiner and J. H. Wendorff, Prog. Polym. Sci., 2013, 38, 963–991 CrossRef CAS.
- M. Zhang, X. Zhao, G. Zhang, G. Wei and Z. Su, J. Mater. Chem. B, 2017, 5, 1699–1711 RSC.
- D. Cheng, R. Xie, T. Tang, X. Jia, Q. Cai and X. Yang, RSC Adv., 2016, 6, 3870–3881 RSC.
- Z. W. Liu, F. Peng, H. J. Wang, H. Yu, W. X. Zheng and J. Yang, Angew. Chem., Int. Ed., 2011, 50, 3257–3261 CrossRef PubMed.
- X. Zhao, G. Nie, Y. Luan, X. Wang, S. Yan and Y.-Z. Long, J. Alloys Compd., 2019, 808, 151737 CrossRef CAS.
- Z. He, M. Li, Y. Li, L. Wang, J. Zhu, W. Meng, C. Li, H. Zhou and L. Dai, Appl. Surf. Sci., 2019, 469, 423–430 CrossRef CAS.
- N. Lu, C. Shao, X. Li, F. Miao, K. Wang and Y. Liu, Ceram. Int., 2016, 42, 11285–11293 CrossRef CAS.
- N. Alexeyeva, E. Shulga, V. Kisand, I. Kink and K. Tammeveski, J. Electroanal. Chem., 2010, 648, 169–175 CrossRef CAS.
- K. R. Lee, K. U. Lee, J. W. Lee, B. T. Ahn and S. I. Woo, Electrochem. Commun., 2010, 12, 1052–1055 CrossRef CAS.
- R. Cui, D. Xu, X. Xie, Y. Yi, Y. Quan, M. Zhou, J. Gong, Z. Han and G. Zhang, Food Chem., 2017, 221, 457–463 CrossRef CAS PubMed.
- Y. Li, G. Wang, T. Wei, Z. Fan and P. Yan, Nano Energy, 2016, 19, 165–175 CrossRef CAS.
- J. Zhang, L. Qu, G. Shi, J. Liu, J. Chen and L. Dai, Angew. Chem., Int. Ed., 2016, 55, 2230–2234 CrossRef CAS PubMed.
- X. Liu, W. Li, T. Zeng, S. Zhang, B. Zhou, M. Li, P. Zhao and C. Peng, J. Electrochem. Soc., 2019, 166, B1491–B1496 CrossRef CAS.
- Z. He, M. Li, Y. Li, L. Wang, J. Zhu, W. Meng, C. Li, H. Zhou and L. Dai, Appl. Surf. Sci., 2019, 469, 423–430 CrossRef CAS.
- Z. Zhang, X. Li, C. Wang, S. Fu, Y. Liu and C. Shao, Macromol. Mater. Eng., 2009, 294, 673–678 CrossRef CAS.
- J. Wu, X. Zheng, C. Jin, J. Tian and R. Yang, Carbon, 2015, 92, 327–338 CrossRef CAS.
- D. Li, D. Wang, K. Rui, Z. Ma, L. Xie, J. Liu, Y. Zhang, R. Chen, Y. Yan and H. Lin, J. Power Sources, 2018, 384, 27–33 CrossRef CAS.
- D. Qin, S. Gao, L. Wang, H. Shen, N. Yalikun, P. Sukhrobov, T. Wagberg, Y. Zhao, X. Mamat and G. Hu, Microchim. Acta, 2017, 184, 2759–2766 CrossRef CAS.
- M. Borghei, N. Laocharoen, E. Kibena-Põldsepp, L.-S. Johansson, J. Campbell, E. Kauppinen, K. Tammeveski and O. J. Rojas, Appl. Catal., B, 2017, 204, 394–402 CrossRef CAS.
- J. Wu, C. Jin, Z. Yang, J. Tian and R. Yang, Carbon, 2015, 82, 562–571 CrossRef CAS.
- J. P. Paraknowitsch, Y. Zhang, B. Wienert and A. Thomas, Chem. Commun., 2013, 49, 1208–1210 RSC.
- W. Li, Z. Chen, J. Li, X. Chen, H. Xuan and X. Wang, Mater. Sci. Eng., A, 2008, 485, 481–486 CrossRef.
- Z. Zhang, X. Li, C. Wang, S. Fu, Y. Liu and C. Shao, Macromol. Mater. Eng., 2009, 294, 673–678 CrossRef CAS.
- X. Li, Y. Zhao, Y. Bai, X. Zhao, R. Wang, Y. Huang, Q. Liang and Z. Huang, Electrochim. Acta, 2017, 230, 445–453 CrossRef CAS.
- Y. Liu, L.-Z. Fan and L. Jiao, J. Mater. Chem. A, 2017, 5, 1698–1705 RSC.
- Y. Wu, X. Li, X. Tan, D. Feng, J. Yan, H. Zhang, X. Chen, Z. Huang and H. Han, Electrochim. Acta, 2018, 282, 672–679 CrossRef CAS.
- D. Feng, Y. Wu, X. Tan, Q. Chen, J. Yan, M. Liu, C. Ai, Y. Luo, F. Du, S. Liu and H. Han, Sensor. Actuator. B Chem., 2018, 265, 378–386 CrossRef CAS.
- M. Maham, V. Kiarostami, S. Waqif-Husain, P. Abroomand-Azar, M. Tehrani, M. Sharifabadi, H. Afrouzi, M. Shapouri and R. Karami-Osboo, Iran. J. Pharm. Res., 2013, 12(2), 311 CAS.
Footnote |
| † Electronic supplementary information (ESI) available. See DOI: 10.1039/d0ra02115f |
| This journal is © The Royal Society of Chemistry 2020 |

