 Open Access Article
Investigation of ash deposition dynamic process in an industrial biomass CFB boiler burning high alkali and chlorine fuel†
Hengli Zhang,
Chunjiang Yu and
Zhongyang Luo *
*
State Key Laboratory of Clean Energy Utilization, Zhejiang University, Hangzhou 310027, China. E-mail: zyluo@zju.edu.cn
First published on 4th June 2020
Abstract
Biomass direct combustion for power generation is used widely in China. The circulating fluidized bed (CFB) boiler has a lower combustion temperature and a wide fuel adaptability, which is suitable for biomass combustion. The dynamic process of ash deposition in a CFB boiler is different from that in a grate furnace because it has a lower combustion temperature and a higher flue gas flow. In this work, the dynamic process of ash deposition on a superheater in a 50 MW biomass CFB boiler was studied by a deposit sampling system at different deposition times. Multiple deposit samples with different deposition times were observed and analysed to obtain an indication of deposit changes with time to understand the entire deposit build-up process. This study differs from previous studies on ash deposition and the deposition process could be identified as occurring in three stages: (1) initial deposition, (2) KCI deposition and (3) capturing of fly ash particles. In the first stage, the temperature gradient near the superheater led to the deposition of fine particles smaller than 2 μm from the flue gas through thermophoretic deposition. In the second stage, the surface became rough, which led to an increase in gas-phase KCl condensation rate and the formation of a dense and continuous KCl layer after the initial deposition. In the third stage, KCI provided a sticky layer to capture larger particles in the flue gas. Thus, more large particles were captured in the flue gas and the KCl continued to condense. As the surface temperature was increased, the condensation rate of the gas-phase KCl decreased. The higher surface temperature enhanced KCI melting and captured more fly ash particles, which led to a rapid build-up of ash deposits on the heating surfaces.
1 Introduction
Biomass is an attractive renewable energy resource to reduce CO2 emissions.1,2 It has a favourable effect on global warming when it replaces fossil fuels in power plants. In China, the most common biomass fuel in power plants is herbaceous and agricultural biomass, including straw, rice husk, cotton stalks and peanut shell.3,4 Bark is another common fuel, which belongs to woody biomass. According to the statistics of 86 biomass fuel types, herbaceous and agricultural biomass have a relatively high alkali metal and chlorine content.5 Most barks have a relatively higher K content than other woody biomass.5 The K and Cl contents will be released to the gas phase during combustion, which causes severe deposition and corrosion problems on the heat transfer surface of boilers.6–12 The released forms of the K compounds are mainly KCl, KOH and K2SO4, and the forms tend to depend on the combustion temperature and S, Cl and water vapor content. Elemental K and Cl in the biomass are released into the gas phase as KCl when the temperature exceeds 700 °C.7,13–16 The dissociation of K2CO3 in biomass above 700–800 °C will release KOH or atomic K, which is enhanced significantly by a high water vapour content in the gas phase.14,16,17 When the temperature increases above 1000 °C, K2SO4 evaporation becomes significant.14 In addition, a small amount of K will also migrate into the gas phase below 600 °C. This behaviour may be related to the decomposition and release of organic K.15,16Elements that are deposited on the superheater in biomass-fired boilers include mainly K, Ca, Mg, Si, S and Cl, whereas Na, Al, P occur as minor elements.18 K, Cl and S are the dominant elements during deposition. Elemental K in biomass fuel is released to the gas phase as KCl, KOH and K2SO4 during combustion.7,14,17,19 KCl and K2SO4 deposit on the superheater mainly through condensation and thermophoresis, and the innermost deposition layer is formed.3,20–24 Sticky potassium salts with a low melting point capture fly ash particles to form the outer deposit layer.8 Nevertheless, most previous research on biomass ash deposition was based mainly on an analysis of mature deposits that are derived directly from heating surfaces during boiler maintenance. These mature deposits have gone through a long-term in situ reaction, which differs from their initial formation state. Hence, it is difficult to stratify and analyse deposit changes with time.
The literature indicates that ash deposition probes with temperature control have been used to study the deposit composition, deposit formation rate and corrosion that is caused by alkali deposits. To date, the influence of flue gas temperature, deposition exposure time and alkali content in fuel on the deposit formation rate has been investigated.25–28 Deposit shedding events were also considered during long-term experiments.25,28,29 The deposit composition of ash deposition probes was analysed by X-ray diffractometry (XRD) and scanning electron microscopy (SEM).30 The deposit samples were divided into an inner and outer layer. Chlorine- or sulphur-rich alkali particles were found in the early deposition stage, then larger particles from fly ash began to deposit through inertial impact.20,31,32 Corrosion caused by alkali metal deposits was investigated at different flue gas temperatures33 and probe surface temperatures on three types of superheater steels.34
Different from the literature mentioned above, in this work, we focused only on the dynamic deposition process. The deposit build-up process on an ash deposition probe at different deposition times was investigated based on a full-scale 50 MW biomass CFB boiler. The deposit samples with different deposition times, which indicate different intermediate deposition states, can be analysed directly to obtain more information on the deposition process. However, previous research on ash sampling probe experiments analysed only the inner- and outer-layer samples.30–32
2 Experimental section
2.1 50 MWth biomass circulating fluidized bed boiler
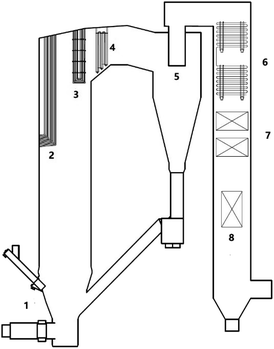
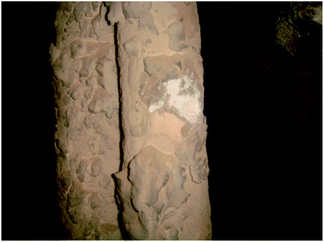
To investigate the biomass ash deposition dynamic process on a high-temperature CFB boiler superheater that burns a high alkali biomass fuel, experiments were conducted in a 50 MW CFB boiler at a biomass power plant in Guangdong, China. A schematic of the boiler is provided in Fig. 1. The boiler was developed and designed by Zhejiang University (ZJU), and is used to treat biomass with a high alkali content. The combustion chamber is divided into two zones: the lower dense-phase pyrolysis zone and the upper dilute-phase combustion zone. Biomass is pyrolyzed into volatiles and char in the dense-phase zone, and the volatiles and part of the char are burned in the phase zone. The temperature of the dense-phase zone and the return loop are controlled below 750 °C to prevent ash from agglomerating or slagging in the dense-phase zone. The temperature of the volatile combustion zone in the middle of the furnace hearth is controlled below 820 °C by arranging the heating surface and the recirculation rate of bed materials. In such a design, alkalis can be kept in the bed bottom, and less alkali can be transformed into the gas phase and deposit on the heat transfer surface in the upper part of the boiler. The designed concept of the boiler makes good use of the characteristics of a high biomass combustion activity and a low burnout temperature in biomass semi-coke. The CFB boiler that was designed by ZJU has been applied in many high-alkali biomass power plants in China. Nevertheless, as shown in Fig. 2, ash deposition on the heat transfer surface of the ZJU CFB boiler has been observed.2.2 Feedstock
The main feedstock that is used in the biomass power plant is eucalyptus bark with a high moisture content. Dry eucalyptus bark was digested by using microwaves, then elemental metal and chloride were analysed using atomic absorption spectroscopy and ion chromatography, respectively. The fuel properties of the eucalyptus bark are shown in Table 1. The feedstock is richer in K and Cl than that of the woody biomass. A high Cl content promotes K transformation to the gas phase, and accelerates deposition on the heat transfer surface.| Proximate analysis | Moisture (%, ar) | 44.28 |
| Ash (%, dry) | 6.97 | |
| Volatile (%, dry) | 71.74 | |
| Fixed carbon (%, dry) | 21.28 | |
| Ultimate analysis | C (%, dry) | 40.77 |
| H (%, dry) | 5.38 | |
| N (%, dry) | 0.35 | |
| S (%, dry) | 0.33 | |
| O (%, dry) | 46.19 | |
| Lower heating value | Q (MJ kg−1, ar) | 7.63 |
| Inorganic elements | Ca (%, dry) | 2.34 |
| K (%, dry) | 0.69 | |
| Na (%, dry) | 0.16 | |
| Cl (%, dry) | 0.86 |
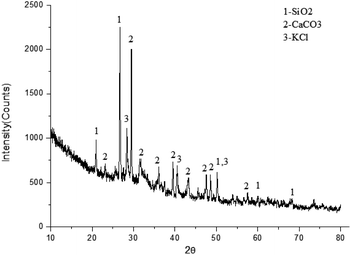
As shown in Table 2, the elemental composition of the fly ash was analysed from the energy spectrum. Combined with the X-ray diffraction (XRD) analysis in Fig. 3, the main components of the fly ash were identified as CaCO3, SiO2 and KCl. Because of the low content of other components, no obvious diffraction peak was found in the XRD diagram.
| Na | Mg | Al | Si | P | S | Cl | K | Ca | Fe |
|---|---|---|---|---|---|---|---|---|---|
| 1.4 | 2.2 | 5.7 | 9.9 | 0.9 | 0.6 | 5.2 | 5.4 | 17.3 | 3.9 |
2.3 Collection and analysis of deposits
A temperature-controlled deposit probe was designed to simulate the surface of a high-temperature superheater inside the boiler. The probe was placed in the high-temperature superheater region through a reserved hole that was prepared for the boiler soot blowing system. The dynamic process of deposit formation was registered by analysing the deposit surface microstructure and elemental distributions at different deposition times.A sketch of the ash deposit probe is shown in Fig. 4. The system includes a fan, electric control valve, digital display controller, thermocouple and stainless-steel sampling probe. The probe was 2.5 m long with a 38 mm outer diameter. A thin stainless-steel ring was attached to the probe to sample the ash deposit. To simulate the high-temperature superheater condition, the probe was cooled by air to maintain a stable sampling ring surface temperature. Because the main steam temperature of the boiler and flue gas temperature in the high temperature superheater region was 540 °C and 720 °C, respectively, the estimated surface temperature of the high-temperature superheater was 600 °C. Hence, the sampling ring surface temperature was set to 600 °C.
The sampling lasted 1, 2, 5, 15, 24 and 48 h for each test. After deposits sampling, there was no need to take the deposits off the ring. The deposit samples were analysed directly, together with the sampling ring. The ash deposit micromorphology was observed by scanning electron microscope (SEM). The microstructure elemental content was measured by energy dispersive spectrometer (EDS).
3 Results and discussion
3.1 Deposits and their elemental composition
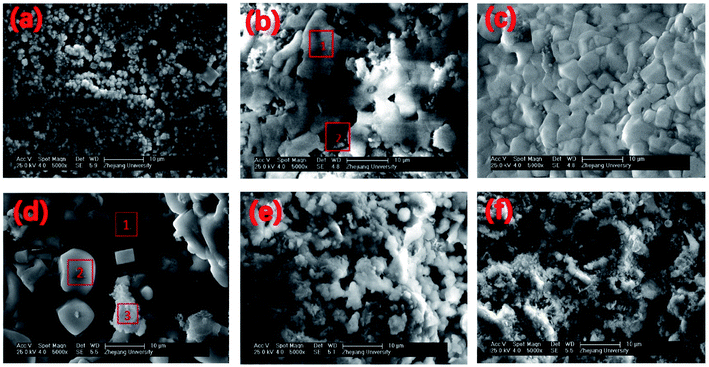
SEM and EDS analyses were conducted to understand the morphological configuration of the deposits and their corresponding chemical composition. SEM diagrams with a 5000× magnification of the deposits sampled at different deposition times are shown in Fig. 5. The elemental composition of the deposit samples with different deposition times are given in Table 3, and the results correspond with that of the SEM results in Fig. 5. Some typical microstructures were identified and are shown in Fig. 5(b) and (d) by red outlines and numerals. These microstructures were analysed by EDS and are also given in Table 3.| Element | Na | Mg | Al | Si | P | S | Cl | K | Ca |
|---|---|---|---|---|---|---|---|---|---|
| 1 h | 1.61 | 6.9 | 5.6 | 8.7 | 3.0 | 6.3 | 8.6 | 3.8 | 55.5 |
| 2 h S1 | 1.6 | 0.9 | 0.8 | 1.0 | 0.3 | 0.4 | 41.4 | 50.2 | 3.4 |
| 2 h S2 | 2.2 | 8.2 | 6.5 | 8.7 | 4.4 | 8.1 | 7.7 | 4.6 | 49.6 |
| 5 h | 2.2 | 0.7 | 0.4 | 0.6 | 0.1 | 0.2 | 46.8 | 47.9 | 1.2 |
| 15 h S1 | 1.5 | 1.2 | 0.4 | 0.7 | 0.3 | 0.1 | 45.4 | 48.3 | 2.2 |
| 15 h S2 | 2.4 | 0.5 | 0.4 | 0.4 | 0.5 | 0.1 | 46.1 | 48.4 | 1.3 |
| 15 h S3 | 2.2 | 4.3 | 4.9 | 11.3 | 2.4 | 4.0 | 12.3 | 12.1 | 46.5 |
| 1 day | 3.0 | 3.0 | 4.1 | 6.7 | 2.4 | 6.0 | 23.2 | 26.1 | 25.5 |
| 2 days | 1.7 | 3.0 | 5.9 | 9.9 | 2.5 | 6.3 | 12.7 | 14.1 | 43.9 |
Since some deposit layers are very thin, a large amount of Fe, Cr, Ni from sampling ring appears in EDS measurement results. Consequently, the EDS results were calibrated by removing C, O, Fe, Cr and Ni content, and the datas were normalized.
3.2 Initial deposition layer
The sampling ring of 1 h was smooth without macroscopic particles visible by the naked eye. The SEM results are shown in Fig. 5(a). The surface of the sampling ring was covered with deposits of fine particles with a diameter less than 2 μm. This initial deposition layer contained a significant amount of Ca, whereas the Mg, Si, P, S, Cl and K content was significantly lower. The main Ca component is probably CaCO3, which is also the main component of fly ash.According to deposition theories, fine particles deposit on the probe mainly through thermophoretic deposition. In a region with a large temperature gradient, fine particles are affected by the thermophoretic force that pushes the particles from the high-to the low-temperature zone. To verify the source of these 2 μm particles, particles less than 2 μm in the fly ash were chosen for tests by using EDS. Their average elemental content is listed in Table 4. The elemental composition is similar to that of the 1 h deposition sample, which indicates that the initial deposition layer may originate directly from the thermophoretic deposition of fine particles in the fly ash. This initial layer is different from previous research on the elemental composition and deposition mechanism.
| Na | Mg | Al | Si | P | S | Cl | K | Ca |
|---|---|---|---|---|---|---|---|---|
| 1.6 | 8.2 | 5.7 | 9.8 | 4.7 | 4.7 | 7.0 | 4.0 | 54.3 |
It has been reported in literature that the initial or innermost deposition layer is rich in K, Cl and S. Jensen found that pure KCl and K2SO4 form an initial deposition layer through condensation; however, FexOy was derived from superheater surface corrosion.21 Lianming Li suggested that the innermost layer composition was KCl, K2SO4, SiO2, K2Ca(SO4)2 and Fe2O3.3 KCl originated from condensation and reacted slowly with SO2 in flue gas to form K2SO4, whereas the reaction of K2SO4 and CaSO4 generated K2Ca(SO4)2. All results mentioned above are somewhat different from 1 h deposits in measurements in the 50 MW biomass CFB boiler. In this case, 1 h ash deposits on the sampling probe is a short deposition process before KCl condensation. This layer is so thin that it cannot be observed in mature deposits. KCl condensation also occurred in this study, which will be discussed in the next section. Fine-particle deposition also existed in Skrifvars's deposition probe experiment.31 The results suggest that submicron particles also deposited on the rear of the probe, including Ca, Mg, Na, K, S and Cl. These deposits could help form a thin initial layer. Inertial impaction rarely occurred on the rear of the probe. Except for potassium salt condensation, other submicron particles in flue gas may deposit through thermophoresis in the early stage of deposition. It is remarkable that the deposition of fine particles in Skrifvars's report differs from this study. The K, Cl and S are much lower in the 1 h deposits, most likely because the low combustion temperature and high Cl content of fuel in this study prevent K2SO4 release into the gas phase. Consequently, no significant S content (K2SO4) was found in all stages of deposition in this study. Cl and K increased rapidly in deposits of 2, 5 and 15 h.
3.3 KCl condensation
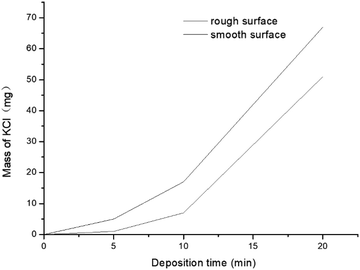
As shown in Fig. 5(b) and Table 3, different microstructures were observed in the deposit between the 2 h and 1 h samples. Spot 1 in Fig. 5(b) is a dense and continuous structure, which is composed mainly of elemental K and Cl. The K/Cl mass ratio agreed with KCl, which suggests KCI condensation with its non-granular structure. The particle structure is shown in Spot 2, which is located lower than the KCl layer. For Spot 2, the elemental composition is similar to the 1 h deposits, which suggests that the particle structure in Spot 2 is actually what we saw in 1 h deposits and then KCl condensed over the particle structure to form KCl layer like Spot 1.KCl has a relatively low melting temperature and presents in the gas phase after combustion. The initial deposit layer after 1 h makes the surface rough, which may increase the KCl condensation speed.
A small tube furnace experiment (Fig. 6) was conducted to investigate the KCl condensation on surfaces of different roughness. The furnace was heated to 800 °C (higher than the melting point of KCl) to accelerate KCl migration to the gas phase. A water-cooled metal tube whose surface temperature was kept at 600 °C was placed inside the tube furnace to collect KCl by condensation. KCl in the gas phase mixed with carrier gas and condensed on a water-cooled metal tube. The deposition time was set as 1, 5, 10, 20 and 40 min. The deposited KCl was collected and weighed to obtain mass–change curves (Fig. 7). At the beginning of condensation, KCl condensed much faster on the rough surface than on the smooth surface. When the surface was covered with KCl, the condensation rates tended to be equal, which explains why the KCl content is low in the initial deposits and increases rapidly in the following hours.
The deposition process in the second stage of KCI condensation can be described as follows: the sampling ring surface becomes rough after 1 h of deposition, which accelerates the KCI condensation rate in the gas phase, and allows KCl condensation to be the dominant deposition method in place of thermophoretic deposition. After 2 h, most part of area, such as Spot 1, was covered with the condensed KCl. Some part of the area, such as Spot 2, was not covered by the KCI layer. The deposit sample of 5 h had a thicker KCl layer than that at 2 h. The dominant KCl condensation lasted up to 15 h when the main part of the 15 h deposit sample remained as the KCl layer [Table 3 and Fig. 5(d)]. The EDS results show that smooth particles, such as Spot 2 in Fig. 5(d) are KCl, whereas flocculated particles, such as Spot 3 are mainly calcium-containing salts, which may originate from CaCO3 and Ca2SiO4 in the fly ash. It can be concluded that at this stage, the dominant deposition mechanism remains KCl gas-phase condensation. However, because of the existence of the sticky KCl layer, other ash particles in the fly ash were captured and settled on the existing deposition layer.
3.4 Rapid growth of deposits after KCl deposition
The deposits of 1 and 2 days are shown in Fig. 5(e) and (f). The surface microstructure is complex. Granular and molten structures existed in 1 day deposits, but these two structures were mixed and could not be analysed separately by EDS. According to the EDS results of the entire deposit surface, the molten structure is KCl, whereas the granular material is the fly ash particles that are captured by KCl. With deposition development, the content of KCl decreases and the content of calcium salt increases from the 1- to the 2-day deposit.As an important factor for gas-phase KCl condensation and subsequent deposition growth, the temperature of the deposit surface was calculated. The convection heat transfer formula of the flue gas that swept across the deposit sampling ring is:
| Re = V·d/ν | (1) |
| Nu = C·Ren·Pr1/3 | (2) |
 | (3) |
The radiation heat transfer formula of the deposit can be expressed as:
 | (4) |
The sum of convection heat transfer and radiation heat transfer on the deposit surface was equal to the heat flow inside the deposit.
 | (5) |
Deposits of 2, 5 and 15 h consist mainly of KCl, thus k is approximately equal to the thermal conductivity of KCl. In longer deposition times, k is 0.57 w/m·K, which is approximate experimental measurement value of deposits sample derived from high-temperature superheater (measured by the thermal conductivity meter). Td = 620 °C was chosen as the initial value for iteration and the iteration value of Td can be calculated from eqn (1)–(5). When the difference between two iteration values of Td was less than 1 °C, the iteration stopped. The final surface temperature was obtained in Table 5.
| 1 h | 2 h | 5 h | 15 h | 1 day | 2 days | |
|---|---|---|---|---|---|---|
| Thickness (mm) | 0.06 | 0.11 | 0.27 | 0.50 | 1.0 | 1.6 |
During the first 15 h, deposition was dominated by KCl with a large thermal conductivity, which is relatively pure, dense and less porous. The surface temperature does not increase significantly. However, with the development of deposits, KCl captures other fly ash particles in the flue gas to form a porous structure, which lowers the thermal conductivity coefficient. Thus, the surface temperature increased rapidly to 633 °C in 1 day and 645 °C in 2 days. Because of the increase in surface temperature, the condensation rate of the gas-phase KCl decreased. The higher surface temperature leads to a higher tendency for KCI melting and therefore, an easier capture of fly ash particles. Thus, the 2 day deposit sample has a significantly lower content of KCl than that of the 1 day deposits, and a higher particle content with calcium salt from flue gas.
It has been reported that biomass ash deposition presents at least two layers visible to us.20,35 The inner layer formed by condensation of potassium salts, and the outer layer consisting of KCl and fly ash particles captured by sticky KCl. These results were similar to that of the conclusions drawn by Lianming Li3 and Yanqing Niu.35 They also found that the content of KCl was gradually decreased and the content of Ca, Si was increased from inner deposition layer to outer layer.
4 Conclusions
The dynamic process of ash deposition on the superheater of a 50 MW biomass CFB boiler was studied using a deposit sampling system. More in-depth data and details about the dynamic process of ash deposition were found through an analysis of six intermediate deposition states.The initial deposits were caused by the thermophoretic deposition of fine particles from the flue gas, rather than the condensation of alkali species as reported previously. Then, gas-phase KCl condensation dominates the deposition and forms a dense KCl layer. Hence, KCl provides a sticky layer to capture larger particles in the flue gas. At this stage, an obvious trend of decrease in KCl and increase in calcium salts on the deposit surface resulted.
It is worth noticing that the elemental composition of the biomass fuel affects the ash deposition process significantly. The K content of biomass fuel is high in Chinese biomass power plants and the Cl content can vary greatly. Because the Cl content affects K migration during combustion, the deposition mechanism in the CFB boiler requires further research. Detailed research should be undertaken in a CFB boiler that burns high alkali and a low chlorine biomass fuel.
Conflicts of interest
There are no conflicts to declare.Acknowledgements
This research was funded by International Cooperation Foundation for China-USA, NSFC-NSF 51661125012.Notes and references
- S. V. Vassilev, D. Baxter, L. K. Andersen and C. G. Vassileva, Fuel, 2010, 89, 913–933 CrossRef CAS.
- K. Jayaraman, M. V. Kok and I. Gokalp, J. Therm. Anal. Calorim., 2017, 127, 1361–1370 CrossRef CAS.
- L. Li, C. Yu, F. Huang, J. Bai, M. Fang and Z. Luo, Energy Fuels, 2012, 26, 6008–6014 CrossRef CAS.
- Y. Zhou, Z. Zhang, Y. Zhang, Y. Wang, Y. Yu, F. Ji, R. Ahmad and R. Dong, Renewable Sustainable Energy Rev., 2016, 54, 1412–1428 CrossRef.
- S. V. Vassilev, D. Baxter, L. K. Andersen and C. G. Vassileva, Fuel, 2010, 89, 913–933 CrossRef CAS.
- T. Valmari, T. M. Lind, E. I. Kauppinen, G. Sfiris, K. Nilsson and W. Maenhaut, Energy Fuels, 1999, 13, 379–389 CrossRef CAS.
- E. Bjorkman and B. Stromberg, Energy Fuels, 1997, 11, 1026–1032 CrossRef.
- Y. Niu, H. Tan, L. Ma, M. Pourkashanian, Z. Liu, Y. Liu, X. Wang, H. Liu and T. Xu, Energy Fuels, 2010, 24, 6220 CrossRef CAS.
- B. M. Jenkins, L. L. Baxter, T. R. Miles and T. R. Miles, Fuel Process. Technol., 1998, 54, 17–46 CrossRef CAS.
- H. P. Nielsen, F. J. Frandsen, K. Dam-Johansen and L. L. Baxter, Prog. Energy Combust. Sci., 2000, 26, 283–298 CrossRef CAS.
- N. Mortazavi, L. Intiso, N. Israelsson, L. G. Johansson and M. Halvarsson, Corrosion, 2016, 72, 23–32 CAS.
- T. R. Miles, T. R. Miles, L. L. Baxter, R. W. Bryers, B. M. Jenkins and L. L. Oden, Biomass Bioenergy, 1996, 10, 125–138 CrossRef CAS.
- S. C. van Lith, P. A. Jensen, F. J. Frandsen and P. Glarborg, Energy Fuels, 2008, 22, 1598–1609 CrossRef CAS.
- J. N. Knudsen, P. A. Jensen and K. Dam-Johansen, Energy Fuels, 2004, 18, 1385–1399 CrossRef CAS.
- K. O. Davidsson, J. G. Korsgren, J. Pettersson and U. Jaglid, Fuel, 2002, 81, 137–142 CrossRef CAS.
- C. Chen, C. Yu, H. Zhang, X. Zhai and Z. Luo, Fuel, 2016, 167, 180–187 CrossRef CAS.
- P. A. Jensen, F. J. Frandsen, K. Dam-Johansen and B. Sander, Energy Fuels, 2000, 14, 1280–1285 CrossRef CAS.
- S. V. Vassilev, D. Baxter, L. K. Andersen and C. G. Vassileva, Fuel, 2013, 105, 40–76 CrossRef CAS.
- J. M. Johansen, J. G. Jakobsen, F. J. Frandsen and P. Glarborg, Energy Fuels, 2011, 25, 4961–4971 CrossRef CAS.
- H. P. Nielsen, L. L. Baxter, G. Sclippab, C. Morey, F. J. Frandsen and K. Dam-Johansen, Fuel, 2000, 79, 131–139 CrossRef CAS.
- P. A. Jensen, F. J. Frandsen, J. Hansen, K. Dam-Johansen, N. Henriksen and S. Horlyck, Energy Fuels, 2004, 18, 378–384 CrossRef CAS.
- X. Jin, J. Ye, L. Deng and D. Che, Energy Fuels, 2017, 31, 2951–2958 CrossRef CAS.
- T. Valmari, T. M. Lind, E. I. Kauppinen, G. Sfiris, K. Nilsson and W. Maenhaut, Energy Fuels, 1999, 13, 390–395 CrossRef CAS.
- L. A. Hansen, H. P. Nielsen, F. J. Frandsen, K. Dam-Johansen, S. Horlyck and A. Karlsson, Fuel Process. Technol., 2000, 64, 189–209 CrossRef CAS.
- M. S. Bashir, P. A. Jensen, F. Frandsen, S. Wedel, K. Dam-Johansen, J. Wadenback and S. T. Pedersen, Energy Fuels, 2012, 26, 2317–2330 CrossRef CAS.
- L. Tobiasen, R. Skytte, L. S. Pedersen, S. T. Pedersen and M. A. Lindberg, Fuel Process. Technol., 2007, 88, 1108–1117 CrossRef CAS.
- P. A. Jensen, M. Stenholm and P. Hald, Energy Fuels, 1997, 11, 1048–1055 CrossRef CAS.
- A. Zbogar, P. A. Jensen, F. J. Frandsen, J. Hansen and P. Glarborg, Energy Fuels, 2006, 20, 512–519 CrossRef CAS.
- M. S. Bashir, P. A. Jensen, F. Frandsen, S. Wedel, K. Dam-Johansen and J. Wadenback, Energy Fuels, 2012, 26, 5241–5255 CrossRef CAS.
- T. Madhiyanon, P. Sathitruangsak, S. Sungworagarn, S. Pipatmanomai and S. Tia, Fuel Process. Technol., 2012, 96, 250–264 CrossRef CAS.
- B. J. Skrifvars, T. Lauren, M. Hupa, R. Korbee and P. Ljung, Fuel, 2004, 83, 1371–1379 CrossRef CAS.
- Y. Liu, L. Cheng, J. Ji, Q. Wang and M. Fang, RSC Adv., 2018, 8, 33817–33827 RSC.
- S. Retschitzegger, T. Gruber, T. Brunner and I. Obernberger, Fuel Process. Technol., 2015, 137, 148–156 CrossRef CAS.
- S. Retschitzegger, T. Gruber, T. Brunner and I. Obernberger, Fuel Process. Technol., 2016, 142, 59–70 CrossRef CAS.
- Y. Niu, Y. Zhu, H. Tan, S. Hui, Z. Jing and W. Xu, Fuel Process. Technol., 2014, 128, 499–508 CrossRef CAS.
Footnote |
| † Electronic supplementary information (ESI) available. See DOI: 10.1039/d0ra04370b |
| This journal is © The Royal Society of Chemistry 2020 |

