 Open Access Article
Gel properties of Amur sturgeon (Acipenser schrenckii) surimi improved by lecithin at reduced and regular-salt concentrations†
Tong Shi‡
a,
Ganesha Yanuar Arief Wijaya‡a,
Li Yuana,
Quancai Sun a,
Fan Baic,
Jinlin Wangc and
Ruichang Gao
 *ab
*ab
aSchool of Food and Biological Engineering, Jiangsu University, Zhenjiang 212013, P. R. China. E-mail: xiyuan2008@ujs.edu.cn; Tel: +86-51188780201
bBio-Resources Key Laboratory of Shaanxi Province, School of Bioscience and Engineering, Shaanxi University of Technology, Hanzhong 723001, P. R. China
cQuzhou Xunlong Aquatic Products Sci-Tech Development Co., Ltd., Quzhou 324000, P. R. China
First published on 20th August 2020
Abstract
This study examined the gel properties of Acipenser schrenckii (A. schrenckii) surimi with 10 and 30 g kg−1 of added lecithin at reduced-salt (3 g kg−1 NaCl) and regular-salt (30 g kg−1 NaCl) concentrations. The results suggested that the gel properties of A. schrenckii surimi were strongly salt-dependent. Notably, regular-salt surimi gels showed better properties than reduced-salt surimi in all analyses. However, with the addition and increased levels of lecithin, the hydrogen bond formation and β-sheet content of low-salt surimi gels significantly increased (P < 0.05). The rheological patterns demonstrated higher elasticity and the gel strength, textural properties, and water holding capacity were also enhanced by lecithin (P < 0.05). The SEM analysis showed that the protein formation induced by lecithin was able to fill the empty voids and reinforce the microstructures. Unlike in reduced-salt surimi, the influence of higher salt concentration was more dominant in regular-salt surimi diminishing the effects of lecithin. The only adverse effect of lecithin found in this study was the decreasing of whiteness, especially when lecithin added up to 3% in both salt conditions. However, there was no significant damage to the overall gel properties.
1. Introduction
Surimi is a kind of food made of fish myofibrillar proteins that play a key role in the formation of the product quality. During the necessary heating step, the myofibrillar proteins unfold, interact with each other, and form a three-dimensional structure, resulting in surimi gel. The texture of surimi gel as well as appearance and flavors is an important parameter to evaluate the quality of surimi products.1 Salt has a flavor-enhancing effect on surimi products and promotes the functionality of protein during gelation.2 When the salt concentration is relatively high, more myofibrillar proteins will be extracted. Therefore, the concentration of salt is a critical factor to form good protein gelation.3 In the processing of surimi food product, the solubility and unfolding of myofibrillar proteins are promoted by salt, resulting in more water molecules come in contact. Consequently, the quality of gelation is enhanced.4–6Surimi products generally contain 10–30 g kg−1 of salt (by total weight).7 Reducing salt content could decrease the amount of solubilized and extracted protein, decrease the water binding capacity, and furthermore results in the weakening of gel properties.8 Nevertheless, the World Health Organization (WHO) reported that most people consumed too much salt (9–12 g per day),9 or around twice of the recommendations (maximum 5 g per day). Excessive sodium intake has been linked to hypertension and high blood pressure, which may increase the risk of stroke and premature death from cardiovascular diseases (CVD), which are notorious as the world's biggest killer accounting for 15.2 million deaths in 2016.9 Thus, it has led to a handful of studies to develop surimi products with reduced-salt content. The protein solubilization by salt might not be an absolute necessity for gel formation. Searching for ingredients that can compensate for the negative effects of salt reduction could be one of the keys to developing reduced-salt surimi. Recent studies have reported that some additives effectively improved the gel properties of reduced-salt surimi, such as microbial transglutaminase (MTGase),10 tetra-sodium pyrophosphate (TSPP),7 and amino acids.11 MTGase can catalyse the acyl transfer reaction between proteins and peptides, mainly between glutamine and lysine residues, thus improving cross-linking of proteins.7,12 TSPP and amino acids enhance the solubility of proteins at low NaCl.7 However, the actual efficiency of MTG depends on the availability of the target amino acids (glutaminyl residues) that relies on the species of meat.13 TSPP can chelate the Ca2+ ion, an activator for endogenous transglutaminase, consequently, gel properties are impaired.14 Moreover, amino acids suppressed the aggregation of myosin by inhibiting endogenous transglutaminase activity and disrupting hydrophobic interactions.15,16
Lecithin is the most versatile byproducts of the oilseed industry and has been commonly used as a functional additive in food processing.17 Previous studies have reported that because of its zwitterionic properties, lecithin can interact and create a synergistic effect with protein structure to improve the gel properties of porcine myofibrillar proteins (MP).18 Lecithin caused the change in secondary structure and hydrophobicity of proteins, which contribute to improve the gel properties by making the gel network denser and more homogenous networks.18 Xia et al.18 reported that the gel textural properties, WHC and whiteness changed with the addition of lecithin, which may be related to the increase in hydrophobic interactions and hydrogen bonds.
Furthermore, lecithin exhibits antioxidant activity, memory improvement, immunological function and regulation of both lipid metabolism and cardiovascular risks,19 therefore, it can be used as a functional ingredient to foods. To the best of our knowledge, there is no published report regarding the use of lecithin in A. schrenckii surimi gel, particularly the effects of lecithin on reduced-salt surimi. The main objective of the present work was to reduce the NaCl content in A. schrenckii surimi gels from the regular level (30 g kg−1) to 3 g kg−1 to make healthier products, and also to compensate the negative effects of salt reduction by using lecithin at different levels (10 and 30 g kg−1). It is expected that the addition of lecithin will improve the gel properties of surimi made from A. schrenckii. The results are essential for enriching the range of using new additive in reduced-salt surimi for healthier lifestyle.
2. Materials and methods
2.1 Preparation of surimi gel
Frozen blocks of Amur sturgeon (A. schrenckii) was obtained from Qiandao Lake, Chun'an County, Hangzhou, Zhejiang province. In brief, the thawed fish blocks (±1 kg) were cleaned, deboned and filleted to obtain the white muscle. The washing process was conducted two times using 5 times volume distilled water and 5 times volume salt water (2.5 g L−1 NaCl) solutions. The washed meat was then centrifuged at 4 °C, with the speed of 10![[thin space (1/6-em)]](https://www.rsc.org/images/entities/char_2009.gif) 000 × g for 20 min to remove the water excess (Eppendorf centrifuge 5810 R). The washed meat was adjusted to the final moisture content of ≤80%. The meat was cooled on ice for 2 h and then was chopped at medium speed for 2 min with food processor (Panasonic, Model MK-5087M, Ōsaka, Japan) to obtain the homogenous paste. After that, salt was added to the meat paste and chopping was continued for another 2 min. The lecithin powder (Sinopharm Chemical Reagent Co., Ltd., Shanghai, China) was added to the meat paste in batches and was homogenized for another 5 min. Different meat pastes were formed in two salt conditions: reduced-salt (3 g kg−1 NaCl) and regular-salt (30 g kg−1 NaCl), and soybean lecithin with different levels (0, 10, and 30 g kg−1) were added to these two salt conditions. The surimi pastes were stuffed into a polyvinylidene chloride casing (2.5 cm diameter) and were heated in a water bath. The conditions of the heating were 40 °C/60 min and 90 °C/30 min. After heating, gels were immediately cooled by immersion on ice water for 15 min and stored in a refrigerator (<4 °C) before analysis (within 24 h).
000 × g for 20 min to remove the water excess (Eppendorf centrifuge 5810 R). The washed meat was adjusted to the final moisture content of ≤80%. The meat was cooled on ice for 2 h and then was chopped at medium speed for 2 min with food processor (Panasonic, Model MK-5087M, Ōsaka, Japan) to obtain the homogenous paste. After that, salt was added to the meat paste and chopping was continued for another 2 min. The lecithin powder (Sinopharm Chemical Reagent Co., Ltd., Shanghai, China) was added to the meat paste in batches and was homogenized for another 5 min. Different meat pastes were formed in two salt conditions: reduced-salt (3 g kg−1 NaCl) and regular-salt (30 g kg−1 NaCl), and soybean lecithin with different levels (0, 10, and 30 g kg−1) were added to these two salt conditions. The surimi pastes were stuffed into a polyvinylidene chloride casing (2.5 cm diameter) and were heated in a water bath. The conditions of the heating were 40 °C/60 min and 90 °C/30 min. After heating, gels were immediately cooled by immersion on ice water for 15 min and stored in a refrigerator (<4 °C) before analysis (within 24 h).
2.2 Determination of chemical interactions
Hydrogen bonds, hydrophobic interactions and disulfide bonds chemical interactions were measured by following Jiang and Xiong.20 The sample of gels (1 g) were dissolved in 9 mL of disrupting reagents using homogenizer. The reagents used were 8 mol L−1 urea + 0.05 mol L−1 sodium phosphate (to analyze the hydrogen bonds), 5 g L−1 SDS + 0.05 mol L−1 sodium phosphate (to analyze the hydrophobic interactions), and 2.5 mL L−1 β-mercaptoethanol + 0.05 mol L−1 sodium phosphate (to analyze disulfide bonds). The mixed solutions were heated at 80 °C for 1 h, chilled at 4 °C for 5 min, and then centrifuged at 10![[thin space (1/6-em)]](https://www.rsc.org/images/entities/char_2009.gif) 000 × g at 4 °C for 15 min. The biuret method was conducted to determine the protein concentrations in the supernatant.21 In view of the difference in the total protein content between the blank and treated samples, all results were expressed as the percentage of the total protein content of the samples.20 The test was repeated three times.
000 × g at 4 °C for 15 min. The biuret method was conducted to determine the protein concentrations in the supernatant.21 In view of the difference in the total protein content between the blank and treated samples, all results were expressed as the percentage of the total protein content of the samples.20 The test was repeated three times.
2.3 Protein secondary structures
Protein secondary structures were analyzed by following Kobayashi et al.22 using FT-Raman spectrometer (NXRFT-Raman module, Thermo Scientific Inc., Waltham, MA, USA). Approximately 0.4 g of freeze-dried samples was applied on a glass microscope slide. A spectral resolution was set to 4.0 cm−1 from 400 to 3050 cm−1, and the final spectra were an average of 15 scans. The recorded spectra were analyzed using the OMNIC Professional software version 8.3 (Thermo Fisher Co. Ltd., Waltham, MA, USA). Subsequently, the Raman intensities from 1600 cm−1 to 1700 cm−1 were selected to deconvolute, second-order derivative and fitting using PeakFit 4.12 (Systat Software, Inc, USA) Finally, the obtained peak intensity and peak area in the range of 1600 cm−1–1700 cm−1 was calculated by normalization to obtain the percentages of α-helix, β-sheet, β-turn, and random coil.2.4 Rheological properties
Dynamic oscillatory studies were performed with a rheometer (Discovery HR-1, TA Instruments Co., Ltd., New Castle DE, USA) using 40 mm parallel steel plate geometry as described by Shi et al.23 Prior to the temperature sweep, strain sweeps were conducted to determine the linear viscoelastic region (LVR) (ESI Fig. 1†). A 1000 μm gap, a 0.1 Hz oscillation frequency and a 4% strain were used (within the LVR range). Surimi paste about 1 g was loaded between the plates and heated at a rate 1 °C min−1 from 10 °C to 90 °C. The changes in the elastic modulus (G′) and loss modulus (G′′) were recorded.2.5 Gel strength
Gel strength is an important quality indicator of surimi products, and was determined by following Buamard and Benjakul.24 A texture analyzer (Model TA-XT2, Stable Micro System, Surrey, USA) with a load cell 5 kg was used. Cylindrical gel samples (2.5 cm diameter and 2.5 cm height) were prepared and equilibrated at room temperature (±25 °C) for 30 min before analysis. The conditions of penetration were: crosshead speed of 1 mm s−1, distance 15 mm, trigger force 10 g, and penetrated with a spherical-ended stainless steel plunger (P/0.25 S). The breaking force was monitored and read on the force vs. deformation curve by the value of the first force peak (g). The deformation was monitored and read on the same curve by dividing the sample height between the start point and the first peak force point (mm). The gel strength (g mm) was calculated by multiplying breaking force with deformation.2.6 Texture profile analysis
TPA parameters were determined by using the same instrument as gel strength measurement. The testing conditions were: crosshead speed of 1 mm s−1, 50% compression of the original sample height, distance 15 mm, and trigger force 10 g. Hardness, springiness, cohesiveness, gumminess, and chewiness were recorded.242.7 Water holding capacity (WHC)
By following the protocol by Wu et al.,25 approximately 2 g of gel samples were centrifuged at 4 °C, with the speed 10![[thin space (1/6-em)]](https://www.rsc.org/images/entities/char_2009.gif) 000 × g for 15 min. The percentage of WHC was defined as multiplying the ratio of the pellet's weight (Y) to the original gel (X) weight by 100%.
000 × g for 15 min. The percentage of WHC was defined as multiplying the ratio of the pellet's weight (Y) to the original gel (X) weight by 100%.| WHC (%) = (1 − (X − Y/X)) × 100% |
2.8 Whiteness
Whiteness determined as described by Kaewudom et al.26 using a colorimeter (HunterLab, Colorflex, Hunter Associates Laboratory, VA, USA). CIE L* (lightness), a* (redness/greenness), and b* (yellowness/blueness) values were measured and whiteness was then calculated using the following equation:| Whiteness = 100 − [(100 − L*)2 + a*2 + b*2]1/2 |
2.9 Microstructures
Microstructures of the gels were examined by following Buamard and Benjakul24 using a Scanning Electron Microscope (SEM). A mix of 25 mL L−1 glutaraldehyde in 0.2 mol L−1 phosphate buffer (pH 7.2) was used to fix surimi samples (2–3 mm) for 3 h at room temperature before rinsing with distilled water. Ethanol with serial concentrations of 250, 500, 700, 800, 900, and 1000 mL L−1 were then used to dehydrate the fixed samples. Transition fluid (CO2) was used to dry the samples. The dried samples were mounted on a bronze stub and sputter-coated with gold. The visualization of specimens using SEM was finally conducted (Quanta 400, FEI, Eindhoven, the Netherlands).2.10 Statistical analysis
The IBM SPSS Statistics 20 for windows (SPSS Inc., Chicago, IL, USA) was used to analyze the significance. Comparison of means was carried out by Duncan's multiple range test.27 All the diagrams were plotted by Origin 9.0 (Origin-Lab, Northampton, MA, USA).3. Results and discussions
3.1 Chemical interactions
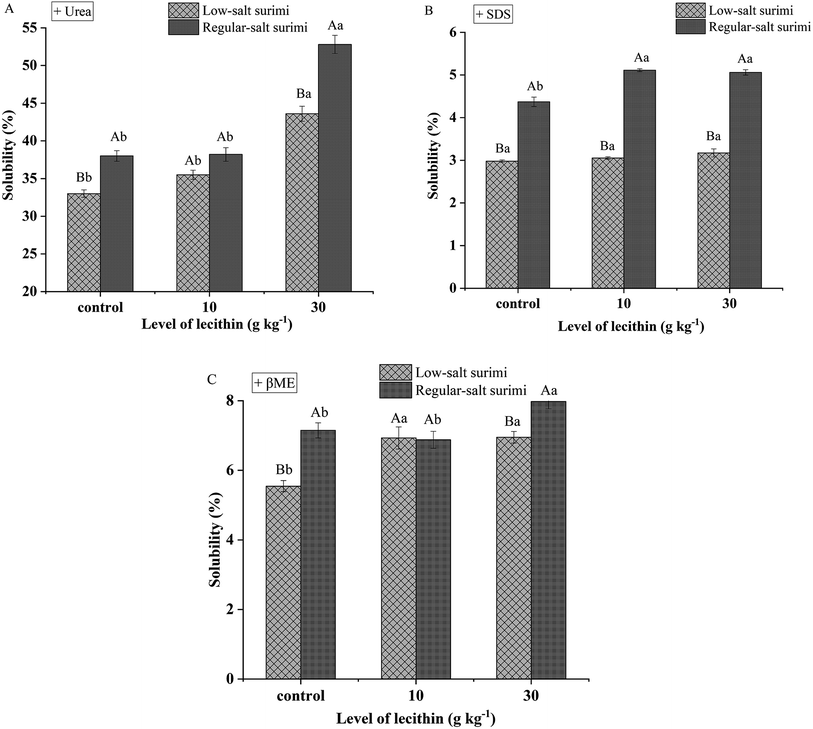
Myofibrillar proteins of salted surimi pastes expose reactive surfaces during heating, which interact to form intermolecular bonds. When intermolecular bonds is sufficient enough, a three-dimensional network forms, resulting in a surimi gel. Hydrogen bonds contribute to the stabilization of bound water within the hydrogel and enhance gel strength during cooling of surimi seafoods. Intermolecular hydrophobic interactions, which are strengthened by increasing temperature, is considered as a primary mechanism for surimi gel formation. During heating at high temperature (>40 °C), disulfide bonding (S–S) is thought to be the predominant covalent bond in the formation of protein gels.5 As shown in Fig. 1, the difference between samples from low-salt and regular-salt surimi is remarkable. Control gel (without lecithin) of regular-salt surimi showed significantly higher hydrogen bonds (Fig. 1A), hydrophobic interactions (Fig. 1B), and disulfide bonds (Fig. 1C) (P < 0.05) than reduced-salt surimi, suggesting that the salt treatment is the main driving force for protein conformation. According to Cando et al.,7 surimi mainly comprises of salt-soluble myofibrillar proteins. The addition of salt induces the solubilization of these proteins that exposed more reactive groups to form new bonds. Whereas, a small amount of salt will result in low solubility and reduce the formation of new bonds.Nevertheless, Fig. 1A indicated that the solubility of hydrogen bonds showed no differences (P > 0.05) between low-salt surimi and regular-salt surimi in the addition of 10 g kg−1 lecithin. Simultaneously, Fig. 1C suggested that the solubility of disulfide bonds also showed a similar tendency (P > 0.05) between low-salt surimi and regular-salt surimi in the addition of 10 g kg−1 lecithin. These results demonstrated that the addition of 10 g kg−1 lecithin weakened the discrepancy in the contributions of hydrogen bonds and disulfide bonds between low-salt surimi and regular-salt surimi, which was induced by the discriminate salt contents.
Some additives such as lard diacylglycerols28 and heat-induced soy protein29 are known to improve the molecular forces during gelation. A similar result was found in this study, although the addition of lecithin induced different effects on the various chemical forces between low-salt and regular-salt surimi. In detail, Fig. 1A indicated that 30 g kg−1 lecithin increased the contribution of hydrogen bonds in both low-salt and regular-salt surimi (P < 0.05). Fig. 1B suggested that the addition of lecithin did not affect the solubility of hydrophobic interactions in reduced-salt surimi (P > 0.05) but increased the contribution of hydrophobic interactions (P < 0.05) in reduced-salt surimi. Moreover, Fig. 1C suggested 10 g kg−1 lecithin improved the contribution of disulfide bonds in reduced-salt surimi significantly (P < 0.05), and 30 g kg−1 lecithin played the same role in regular-salt surimi. These improvements might be due to zwitterionic properties of lecithin molecule. Xia et al.18 reported that the hydrophilic lecithin head binds to water molecules by hydrogen bonds, while the hydrophobic phospholipid fatty acid binds with hydrophobic regions of protein by hydrophobic interactions. These interactions created a synergistic effect in the formation of new bonds that further reinforced the gel networks.
3.2 Secondary structures
In the process of surimi gelation, it is usually accompanied by the transformation from α-helix to other secondary conformations.30 As shown in Fig. 2, regular-salt surimi gels showed lower α-helix and higher β-sheets than low-salt surimi, indicating the formation of a stronger gel network. This result was consistent with a previous study,31 which demonstrated that β-sheets are significant conformational ingredient of aggregated protein during the heat-induced progress. Guo et al.30 reported that the decrease in α-helix indicates the higher degree of protein unfolding, and the β-sheet structures were formed simultaneously along with the unfolding of α-helix. Furthermore, the increasing of β-sheet indicated the rearrangement of the intramolecular hydrogen bonds and hydrophobic groups that reinforced the gel structure.29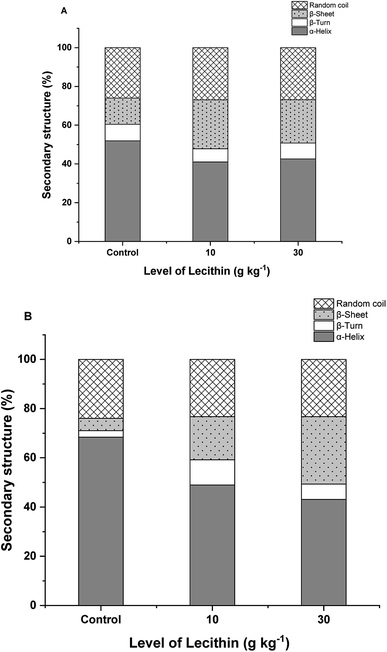 | ||
| Fig. 2 The changes in protein secondary structures of regular-salt (A) and reduced-salt (B) surimi gels at different level of lecithin. | ||
Raman spectroscopic analysis showed progressive increases in the β-sheet structure and general decreases in the α-helix upon the addition of lecithin (Fig. 2). Meanwhile, only slight changes were found in the β-turn and random coil. This trend was more pronounced in reduced-salt surimi than regular-salt surimi. The increasing of β-sheet in regular-salt surimi was mainly more affected by the higher salt content. Whereas, lecithin added in low-salt surimi might induce more unfolding of α-helix followed by the formation of β-sheet, fixing the weak structure of reduced-salt surimi gel. Thus, lecithin has a significant effect on the secondary structures. The increasing of β-sheet in the mixed gels is in agreement with the increasing of solubility (Fig. 1).
3.3 Rheological properties
In terms of regular-salt surimi and reduced-salt surimi, Fig. 3 showed the distinguished profiles of shear modulus versus temperature. The heating procedure was divided into three phases for regular-salt surimi: Phase I – heating from 10 to 40 °C, indicating the formation of the preliminary protein network structure; Phase II – heating from 40 to 46 °C, indicating gel weakening; Phase III – after 46 °C, indicating the formation of a relatively strong gel network due to enhanced attractive interactions. However, the temperature sweeps of reduced-salt surimi gelation generally marked four-stage changes, where G′ and G′′ decreased slightly with temperature before the gelation. Furthermore, regular-salt surimi paste showed higher G′ and lower G′′ values at the end of programming heating than reduced-salt surimi (Fig. 3A and C), suggesting a more solid-like gel structure.32 According to Núñez-Flores et al.,2 a higher amount of salt (30 g kg−1) induced higher solubilization and protein unfolding that exposed more reactive groups to form new bonds and a viscous gel structure. Therefore, the present results might result from the low solubility of reduced-salt surimi (Fig. 1), meaning the gel could not maintain its firmness and lead to a relatively high fluidity during gelation.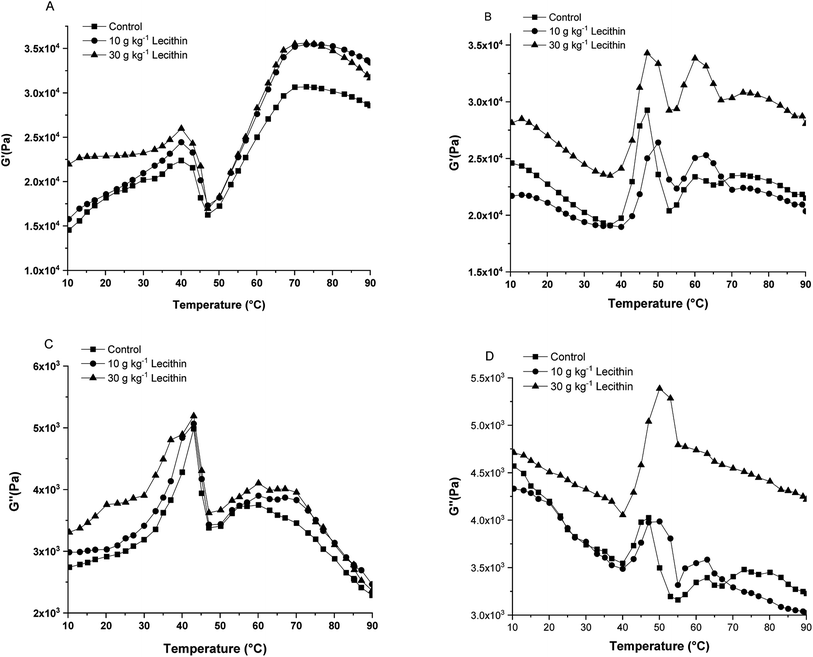 | ||
| Fig. 3 Representative rheograms (G′ & G′′) of surimi paste incorporated with lecithin at regular-salt (A and C) and reduced-salt (B and D) conditions. | ||
In this study, the addition of lecithin significantly affected rheological patterns. Fig. 3 showed that the mixed gels exhibited better gelation ability than pure A. schrenckii gels. Furthermore, the final G′ of mixed gels significantly improved upon the addition of lecithin, indicating that lecithin could maintain the firmness of the final gel. In the regular-salt surimi, the addition of 10 and 30 g kg−1 lecithin reinforced the gels during weakening and significantly increased the elasticity at the end of heating (Fig. 3A and C). Whereas, in the reduced-salt surimi, gels with the addition of 30 g kg−1 of lecithin showed the most stable behavior compared to samples with 0 and 10 g kg−1 lecithin. More strikingly, reduced-salt surimi gel with the addition of 30 g kg−1 lecithin exhibited a similar final G′ (about 3.0 × 10⁴ Pa at 90 °C) with that of regular-salt surimi at the same content lecithin. This result indicated that lecithin in the present study showed a more pronounced ability of improving the G′ of reduced-salt surimi than that of regular-salt surimi.
The elastic behavior of mixed gels, especially in the gel strengthening progress, might be affected by the increase of hydrogen bonds and hydrophobic interactions between lecithin and protein as previously discussed. Kasinos et al.33 also found that phospholipids can modify the secondary protein of whey proteins due to hydrophobic interactions.
3.4 Gel strength
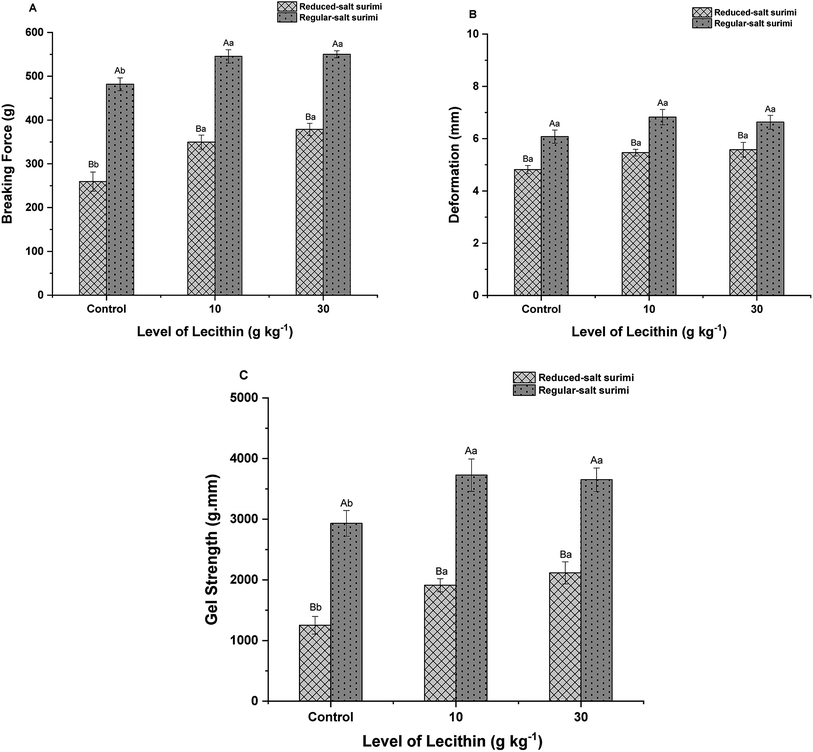
Regardless of the addition of lecithin, control gel of regular-salt surimi exhibited significantly higher breaking force, deformation, and gel strength (P < 0.05) than control gel of reduced-salt surimi (Fig. 4). As mentioned before, the higher gel strength in regular-salt surimi was thought primarily related to the formation of more new bonds induced by higher salt concentration. Whereas, a small amount of salt results in low solubility and reduce the formation of protein networks, leading to the weakening of final gel structure in reduced-salt surimi. However, the present study showed that the addition of lecithin reinforced the gel strength of low-salt surimi. The addition of 10 g kg−1 lecithin remarkably increased the breaking force and gel strength (P < 0.05) of reduced-salt surimi by 34.72% and 52.61%, respectively. When lecithin was added up to 30 g kg−1, the breaking force and gel strength of low-salt surimi still increased (P < 0.05) by 8.28% and 10.65%. It appears that lecithin also reinforced the gel strength of regular-salt surimi. However, the enhancement was less noticeable than that in reduced-salt surimi. The addition of 1 g kg−1 lecithin in regular-salt surimi improved both breaking force and gel strength (P < 0.05) by 13.21% and 27.14%, respectively. However, the increasing trend did not continue as the level of lecithin increased to 30 g kg−1. The gel formation of regular-salt surimi was more influenced by the higher salt concentration. Since the cross-linking induced by higher salt content already abundant, the lecithin effect will diminish at such a high salt concentration. A similar result was observed by Chin et al.,34 who revealed the diminishing effect of konjac flour at high-salt concentration. Furthermore, the addition of lecithin did not appear to have a significant effect on the deformation (P > 0.05), which was consistent with the previous result studied by Buamard & Benjakul.243.5 Texture profile analysis (TPA)
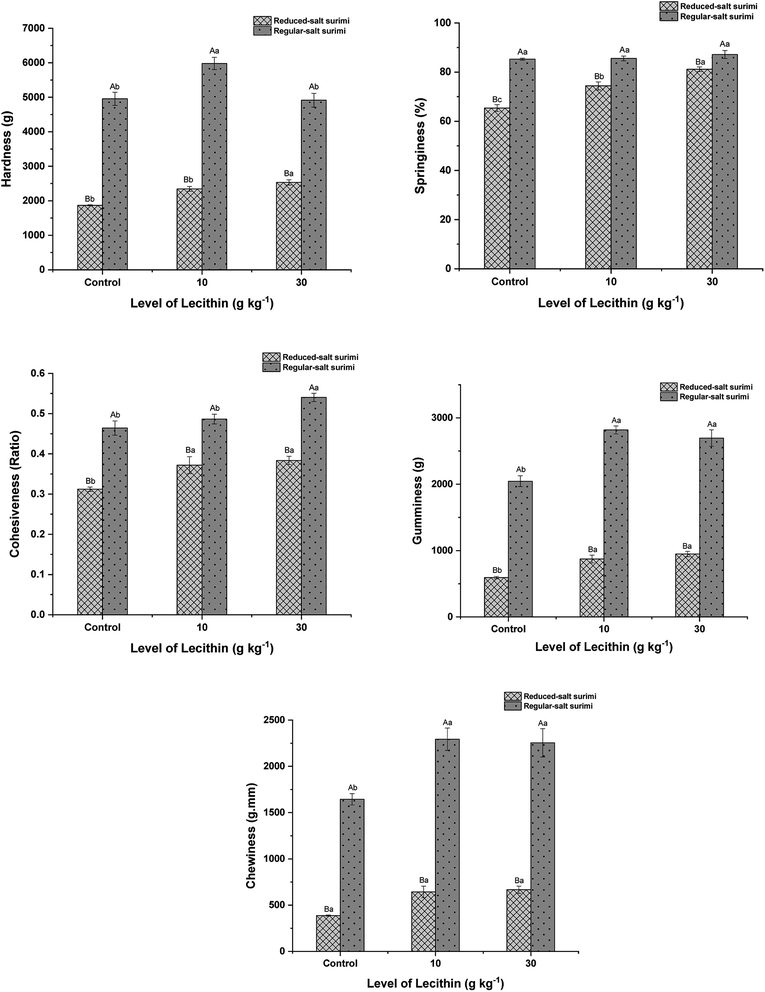
Texture is a major parameter of functional characteristics of surimi gels. Hardness represented the peak force that occurs during the first compression cycle to achieve a given deformation. Springiness symbolized the ratio of the second compression distance to the first compression distance. Cohesiveness was defined as ratio of the second compression energy to the first compression energy. Gumminess was symbolized as hardness × cohesiveness. Chewiness was defined as hardness × cohesiveness × springiness.35 Consistent with the above findings, regular-salt surimi led to the general enhancement of textural properties (P < 0.05) (Fig. 5) due to the higher degree of protein unfolding. These results also indicate that the regular-salt surimi gel was more resistant to the compression and has stronger macroscopic attributes. In the presence of lecithin, the gel hardness of regular-salt surimi was first increased at the lecithin level of 10 g kg−1, but the increasing trend did not continue at the level of 30 g kg−1. Whereas a slight increase was found in reduced-salt surimi when 10 g kg−1 lecithin added, and the increasing trend continues at the level of 30 g kg−1. This trend in hardness was similar to the gel strength (Fig. 4). Moreover, gumminess and chewiness showed the same improvements as hardness. These results might be associated with the synergistic effect between lecithin and protein molecules as discussed previously in Section 3.1. These improvements might also be related to the increase of solubility observed in solubility test (Fig. 1). Lecithin significantly increased the springiness and cohesiveness of reduced-salt surimi gel (P < 0.05). Meanwhile, it did not give apparent change in regular-salt gel. This is due to the cross-linking induced by higher salt content was already abundant. Thus, some textural parameters, namely springiness, and cohesiveness in this study, might not be increased significantly with the addition of lecithin. However, the springiness and cohesiveness values of regular-salt surimi were still obviously higher (P < 0.05) than those in reduced-salt surimi. It indicates the dominant effect of salt in textural properties.3.6 Water holding capacity (WHC)
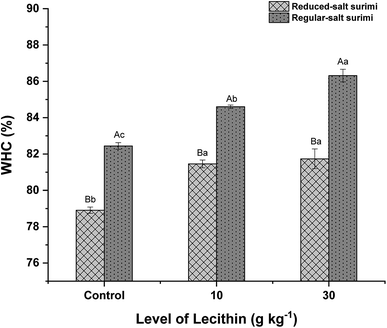
As shown in Fig. 6, regular-salt surimi showed significantly higher WHC than reduced-salt surimi (P < 0.05). As previously discussed, the higher solubility induced by higher ionic strength resulted in the formation of more new bonds. These bonds filled the empty holes to make the gel denser during the heat-induced.36 A compact gel structure is able to entrap and immobilize a large amount of water in the capillaries of the protein matrix, increasing the WHC.28 Fig. 6 also shows the tendency of the WHC to increase significantly as the lecithin levels were increased (P < 0.05), which was probably due to the formation of more new bonds induced by lecithin (Fig. 1). Lecithin naturally has hydrophilic properties (water-loving). Therefore, it was speculated theoretically that the hydrophilic lecithin heads might interact with amino acid residues of protein so that increased the hydration ability of surimi proteins, further increasing the WHC.18 The WHC of mixed gels in regular-salt condition was even higher due to the combined effect of lecithin and higher salt content. The WHC results are in agreement with gel strength (Fig. 4) and hardness (Fig. 5). Thus, it confirmed that the addition of lecithin reinforced the gel structure. As a result, a strong gel network with high water binding capacity was formed.3.7 Whiteness
Regardless of lecithin levels added, regular-salt surimi showed significantly higher whiteness (P < 0.05) than reduced-salt surimi (Table 1). Whereas, the redness (a*) and yellowness (b*) did not show obvious difference. This result may be attributed to the light-scattering of the gels due to the higher WHC.36 Notably, there were significant decreases in lightness (L*) and whiteness (P < 0.05) as the lecithin added. In low-salt surimi, the addition of 10 g kg−1 and 30 g kg−1 lecithin significantly decreased the lightness and whiteness (P < 0.05). Meanwhile, in regular-salt surimi, a significant decrease of whiteness was observed after the addition of 30 g kg−1 lecithin (P < 0.05). These results suggest that lecithin may alleviate the color properties of mixed gels. It is consistent with the investigation by Xia et al.,18 who revealed that the whiteness of surimi gels significantly decreased as the lecithin levels increased due to the natural yellowish color of soybean lecithin. Food-grade lecithin maintains clear yellow color and resists darkening at temperatures up to 350 °F.17| NaCl (%) | Lecithin (%) | L* | a* | b* | Whiteness | ||||||||||||||||||||||||||||||||||||||||||||||||||||||||||||||||||||||||||||||||||||||||||||||
|---|---|---|---|---|---|---|---|---|---|---|---|---|---|---|---|---|---|---|---|---|---|---|---|---|---|---|---|---|---|---|---|---|---|---|---|---|---|---|---|---|---|---|---|---|---|---|---|---|---|---|---|---|---|---|---|---|---|---|---|---|---|---|---|---|---|---|---|---|---|---|---|---|---|---|---|---|---|---|---|---|---|---|---|---|---|---|---|---|---|---|---|---|---|---|---|---|---|---|---|
| a Different capital letters represent significant differences (P < 0.05) at the same lecithin level and different salt content. Different lowercase letters represent significant differences (P < 0.05) at the same salt content and different lecithin level. | |||||||||||||||||||||||||||||||||||||||||||||||||||||||||||||||||||||||||||||||||||||||||||||||||||
| 0.3 | 0 | 78.51 ± 0.94Ba | -0.78 ± 0.10Aa | 21.19 ± 0.84Aa | 69.78 ± 0.16Ba | ||||||||||||||||||||||||||||||||||||||||||||||||||||||||||||||||||||||||||||||||||||||||||||||
| 1 | 74.65 ± 0.75Bb | -0.86 ± 0.06Aa | 20.10 ± 1.16Aa | 67.61 ± 0.22Bb | |||||||||||||||||||||||||||||||||||||||||||||||||||||||||||||||||||||||||||||||||||||||||||||||
| 3 | 74.82 ± 1.49Ab | -0.81 ± 0.05Aa | 21.29 ± 1.52Aa | 66.94 ± 0.25Bb | |||||||||||||||||||||||||||||||||||||||||||||||||||||||||||||||||||||||||||||||||||||||||||||||
| 3 | 0 | 84.39 ± 0.06Aa | -1.11 ± 0.33Aa | 23.64 ± 0.29Aa | 71.65 ± 0.21Aa | ||||||||||||||||||||||||||||||||||||||||||||||||||||||||||||||||||||||||||||||||||||||||||||||
| 1 | 79.73 ± 0.84Ab | -2.66 ± 0.05Bb | 20.75 ± 1.16Aa | 70.84 ± 0.41Aa | |||||||||||||||||||||||||||||||||||||||||||||||||||||||||||||||||||||||||||||||||||||||||||||||
| 3 | 77.31 ± 0.65Ab | -2.26 ± 0.11Bb | 21.06 ± 0.54Aa | 68.96 ± 0.40Ab | |||||||||||||||||||||||||||||||||||||||||||||||||||||||||||||||||||||||||||||||||||||||||||||||
3.8 Microstructures
As illustrated at Fig. 7, the microstructures of mixed gels generally showed smoother network and smaller voids than pure A. schrenckii gels, indicating that cross-linking with lecithin reinforced the gel structures and reduced the empty spaces. This result is consistent with the gel strength (Fig. 4). Furthermore, the microstructures of surimi gels with the addition of 10 & 30 g kg−1 lecithin at regular-salt condition (Fig. 7B and C) showed the finest structures with uniform particles and small voids. Simultaneously, the microstructures of reduced-salt surimi was ameliorated remarkably by 10 & 30 g kg−1 lecithin, although the control gel of low-salt surimi showed the worst microstructure with largest holes due to the low solubility. These results were supported by Xia et al.18 who reported that the addition of lecithin enhanced the microstructures of MP gels at different ionic strength. Results from the SEM analysis were in general agreement with the aforementioned analyses.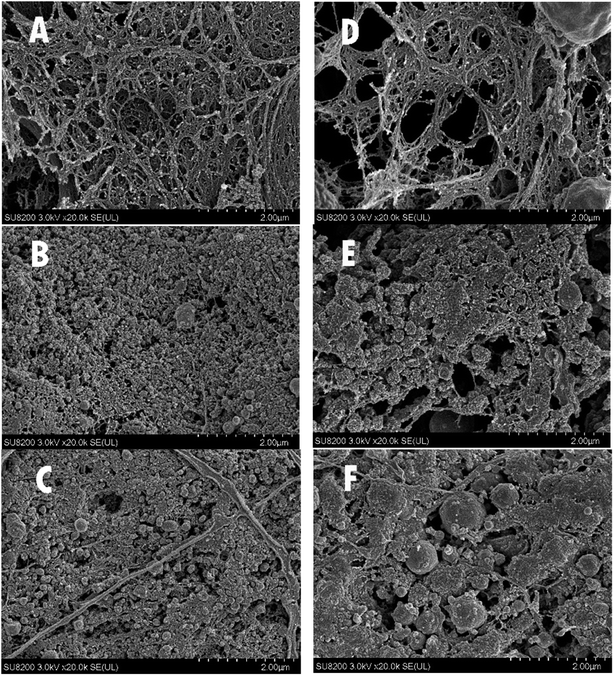 | ||
| Fig. 7 The microstructure of regular-salt surimi gels added with 0 (A), 10 (B), 30 (C) g kg−1 lecithin and reduced-salt surimi gels added with 0 (D), 10 (E), 30 (F) g kg−1 lecithin. | ||
4. Conclusions
This study showed that salt has major effects on gel properties as regular-salt surimi gels generally resulted in better gel properties than reduced-salt surimi gels. However, this study demonstrated that lecithin could be used to fortify reduced-salt surimi gels. Progressive increases in hydrogen bonds and β-sheet formations (P < 0.05) were found when lecithin added at the level 10 and 30 g kg−1. Rheological patterns showed higher elasticity and physical properties such as gel strength, WHC, TPA, and microstructures also enhanced (P < 0.05). Similar improvements were also found in regular-salt surimi. However, the gel properties in regular-salt surimi gels were more influenced by the higher salt content than lecithin addition.Conflicts of interest
The authors have no conflict of interest.Acknowledgements
This work was supported by the China Agriculture Research System (CARS-46), and also supported by the National Natural Science Foundation of China (31671882).References
- T. Ooizumi, Manufacture of Kamaboko, Chikuwa, Tempura, and Hanpen, Surimi and Surimi Seafood 3rd, CRC PressTaylor & Francis Group, 2014, pp. 271–273 Search PubMed.
- R. Núñez-Flores, D. Cando, A. J. Borderías and H. M. Moreno, Food Chem., 2018, 239, 1226–1234 CrossRef PubMed.
- X. D. Sun and R. A. Holley, Compr. Rev. Food Sci. Food Saf., 2011, 10, 33–51 CrossRef CAS.
- M. Okada, Frozen surimi, The Science of Kamaboko, Seizando Shoten, Tokyo, 1999, pp. 177–191 Search PubMed.
- B. Rasco and G. Bledsoe, Surimi and surimi analog products, Handbook of Food Science, Technology and Engineering, CRC Press, Boca Raton, FL, 2006, vol. 4, pp. 160–167 Search PubMed.
- S. Thawornchinsombut and J. W. Park, J. Food Biochem., 2007, 31, 427–455 CrossRef CAS.
- D. Cando, B. Herranz, A. J. Borderías and H. M. Moreno, Food Chem., 2016, 196, 791–799 CrossRef CAS PubMed.
- R. Tahergorabi, S. K. Beamer, K. E. Matak and J. Jaczynski, LWT--Food Sci. Technol., 2012, 48, 175–181 CrossRef CAS.
- World Health Organization, Salt reduction, 2016, accessed 28 January 2019, https://www.who.int/en/news-room/fact-sheets/detail/salt-reduction/ Search PubMed.
- J. Feng, A. Cao, L. Cai, L. Gong, J. Wang, Y. Liu, Y. Zhang and J. Li, LWT--Food Sci. Technol., 2018, 93, 1–8 CrossRef CAS.
- D. Cando, A. J. Borderías and H. M. Moreno, LWT--Food Sci. Technol., 2017, 75, 599–607 CrossRef CAS.
- C. Kuraishi, J. Sakamoto, K. Yamazaki, Y. Susa, C. Kuhara and T. Soeda, J. Food Sci., 1997, 62, 488–490 CrossRef CAS.
- A. M. Lennon, K. McDonald, S. S. Moon, P. Ward and T. Kenny, Meat Sci., 2010, 85, 620–624 CrossRef CAS.
- O. Julavittayanukul, S. Benjakul and W. Visessanguan, Food Hydrocolloids, 2006, 20, 1153–1163 CrossRef CAS.
- D. Liu, S. Kanoh and E. Niwa, Nippon Suisan Gakkaishi, 1995, 61, 608–611 CrossRef CAS.
- R. C. Gao, Y. M. Wang, J. L. Mu, T. Shi and L. Yuan, Food Hydrocolloids, 2018, 75, 174–181 CrossRef CAS.
- G. R. List, Polar Lipids, 2015, pp. 1–33 Search PubMed.
- W. T. Xia, L. Ma, X. K. Chen, X. Y. Li and Y. H. Zhang, Food Hydrocolloids, 2018, 82, 135–143 CrossRef CAS.
- N. Sun, J. Chen, D. Wang and S. Lin, Trends Food Sci. Technol., 2018, 80, 199–211 CrossRef CAS.
- J. Jiang and Y. L. Xiong, Meat Sci., 2013, 93, 469–476 CrossRef CAS.
- A. G. Gornall, C. J. Bardawill and M. M. David, J. Biol. Chem., 1949, 177, 751–766 CAS.
- Y. Kobayashi, S. G. Mayer and J. W. Park, Food Chem., 2017, 226, 156–164 CrossRef CAS.
- T. Shi, L. Yuan, Y. M. Wang and R. C. Gao, Food Sci. Nutr., 2018, 39, 1–5 Search PubMed.
- N. Buamard and S. Benjakul, Food Hydrocolloids, 2015, 51, 146–155 CrossRef CAS.
- M. Wu, Y. Xiong, J. Chen, X. Tang and G. H. Zhou, J. Food Sci., 2009, 74, 207–217 CrossRef.
- P. Kaewudom, S. Benjakul and K. Kijroongrojana, Food Biosci., 2013, 1, 39–47 CrossRef CAS.
- R. G. D. Steel and J. H. Torries, A biom appr., 1980 Search PubMed.
- X. Diao, H. Guan, X. Zhao, X. Diao and B. Kong, Meat Sci., 2016, 121, 333–341 CrossRef CAS PubMed.
- Z. Wang, J. Liang, L. Jiang, Y. Li, J. Wang, H. Zhang, D. Li, F. Han, Q. Li, R. Wang, B. Qi and X. Sui, CyTA--J. Food, 2015, 13, 527–534 CAS.
- M. Guo, S. Liu, M. Ismail, M. M. Farid, H. Ji, W. Mao, J. Gao and C. Li, Food Chem., 2017, 227, 219–226 CrossRef CAS PubMed.
- R. Liu, S. M. Zhao, Y. M. Liu, H. Yang, S. B. Xiong, B. J. Xie and L. H. Qin, Food Chem., 2010, 121, 196–202 CrossRef CAS.
- Y. K. Zhang, Q. Zhang, J. Lu, J. L. Xu, H. Zhang and J. H. Wang, Bioact. Carbohydr. Diet. Fibre, 2017, 11, 18–25 CrossRef CAS.
- M. Kasinos, P. Sabatino, B. Vanloo, K. Gevaert, J. C. Martins and P. Van der Meeren, Food Hydrocolloids, 2013, 32, 312–321 CrossRef CAS.
- K. B. Chin, M. Y. Go and Y. L. Xiong, Meat Sci., 2009, 81, 565–572 CrossRef CAS.
- Y. S. Wang, J. Zhao, W. W. Zhang, C. Q. Liu, P. Jauregi and M. G. Huang, Food Hydrocolloids, 2020, 100, 105397 CrossRef CAS.
- T. Yin, J. W. Park and S. Xiong, J. Food Qual., 2017, 1–8 CAS.
Footnotes |
| † Electronic supplementary information (ESI) available. See DOI: 10.1039/d0ra04487c |
| ‡ These authors contributed equally to the present work. |
| This journal is © The Royal Society of Chemistry 2020 |

