 Open Access Article
Spherical amine grafted silica aerogels for CO2 capture
Xing Jiangab,
Yong Kong *ab,
Zhiyang Zhaoab and
Xiaodong Shenabc
aCollege of Materials Science and Engineering, Nanjing Tech University, Nanjing 210009, P. R. China. E-mail: ykong@njtech.edu.cn
bJiangsu Collaborative Innovation Center for Advanced Inorganic Function Composites, Nanjing 210009, P. R. China
cState Key Laboratory of Materials-Oriented Chemical Engineering, Nanjing Tech University, Nanjing 210009, P. R. China
First published on 9th July 2020
Abstract
The objective of this research was to develop a novel spherical amine grafted silica aerogel for CO2 capture. A spherical silica gel was synthesized by dropping a sodium silicate based silica sol into an oil bath. Amine grafting was achieved by bonding 3-aminopropyltriethoxysilane onto the framework of the silica gel. The spherical amine grafted silica gels were dried using vacuum drying to prepare the spherical amine grafted silica aerogels (SASAs). The synthetic mechanism of the SASAs was proposed. The structures and the CO2 adsorption performances of SASAs were researched. The amine loading of the SASAs increased with the grafting time, however, the specific surface area and pore volume sharply decreased owing to the blockage of the pore space. Excess amine loading led to the decrease of the CO2 adsorption capacity. The optimal CO2 adsorption capacity was 1.56 mmol g−1 with dry 1% CO2 and at 35 °C. This work provides a low-cost and environmentally friendly way to design a capable and regenerable adsorbent material.
1. Introduction
Atmospheric CO2 concentrations have increased enormously in recent decades, which leads to global warming and climate issues. CO2 capture is an effective way to reduce CO2 emissions.1–4 Among the available techniques, porous adsorbents such as zeolites, activated carbon and metal–organic frameworks (MOFs)5–10 have attracted intensive attention because of their good performance. Due to their characteristic of large porosity, these adsorbents show high CO2 adsorption capacities.11,12 However, these physical adsorbents have a low selective adsorption capacity for CO2, and are only available for CO2 rich gases. Moreover, their CO2 capacities show a significant decrease in humid environments.An available way to enhance the CO2 adsorption property of the porous materials is to load amines that can react with CO2.13–17 Mesoporous silicas and carbons, MOFs, porous polymers, and aerogels were used as supports to prepare amine functionalized adsorbents, and good CO2 adsorption performances were achieved.18–23 Among kinds of porous supports, aerogels have large surface areas and porosities, interpenetrating network, and relatively larger pore size, which favour the gas diffusion and the amine surface loading.24–31 Linneen et al. impregnated silica aerogels with tetraethylenepentamine (TEPA) to achieve amine functionalization.32,33 A CO2 adsorption capacity of 3.5 mmol g−1 at 75 °C with 10% CO2 was achieved. Wang et al. impregnated aerogel with PEI with a CO2 adsorption capacity of 3.3 mmol g−1 at 25 °C in pure CO2.34 Wörmeyer et al. synthesized an amine grafted silica aerogel, which exhibited a low CO2 adsorption capacity of 1.07 mmol g−1 at 22 °C in 2500 ppm CO2.35–37 Linneen et al. achieved amine grafting of silica aerogels in anhydrous and hydrous solutions with different amines, hydrous solutions leaded to higher CO2 adsorption property.38 Begag et al. prepared amine functionalized silica aerogels with amines and siloxanes as precursors, one gram of aerogel sample can adsorb 1.43 mmol CO2 by simulating the flue gas atmosphere.39 Kong et al. developed a series of amine hybrid silica aerogels by one-step sol–gel process based on in situ polymerization with APTES and TEOS as precursors, which exhibited CO2 adsorption capacities of 6.66, 5.55 and 2.57 mmol g−1 at 25–30 °C with 10%, 1% and 450 ppm CO2, respectively.40–45
The aforementioned amine functionalized aerogels showed excellent CO2 adsorption performances under different conditions. However, these aerogel-based CO2 adsorbents were light-weight powders. The powdered adsorbents have to mixed with matrix otherwise the fixed bed reactor will be blocked.41–43 Moreover, the silicon alkoxides and alcohols are used as precursor and solvent, which may have cost and environment issues.46,47 Traditional silica aerogels are neither environmentally friendly nor expensive at industrial scale.48 It is important to improve the environmental and economic benefits of aerogels. As a cheap precursor, sodium silicate can replace as the starting material instead of the alkoxides.49 The supercritical CO2 fluid drying (SCD) was used to dry the wet gels, which needs expensive equipment and complex technology. Most commercial aerogels are prepared by SCD which produced a series of undesirable, more expensive, and less energy efficient products, the green and cost-effective dry methods were developed to solve the environmental and economy problems.50,51 Koebel et al. prepared the ambient-dried silica aerogel and silica-biopolymer hybrid aerogels, which reduced the environmental pollution greatly and make it from laboratory to pilot scale.52 However, it is necessary to develop new environment-friendly products. To solve these issues, a low-cost spherical amine grafted silica aerogel for CO2 capture was developed in this work. Water glass and water were used as precursor and solution, respectively. Amine functionalization of the spherical silica aerogel was achieved by grafting APTES onto the silica gel. A low-cost and convenient vacuum drying (VD) instead of SCD was used to dry the silica gels. The structures and low-concentration CO2 adsorption performances of the spherical amine grafted silica aerogels were studied.
2. Experimental
2.1. Materials
Water glass (WG, 33 wt%, modulus 3.3) was supplied by the Quechen Silicon Chemical Co., Ltd, China. Acetic acid (HAc, AR, 99.5%) was purchased from the Shanghai Shenbo Chemical Co., Ltd, China. Dimethicone oil (1000 ± 80 mPa s) and APTES (AR, 98%) were purchased from the Shanghai Aladdin Biochemical Technology Co., Ltd, China. Ethanol (EtOH, AR, 99.7%) was purchased from the Wuxi City Yasheng Chemical Co., Ltd, China. DI water (W) was home-made. All chemicals were used as received without any further purification.2.2. Preparation of the spherical amine grafted silica aerogels
WG, W and HAc were mixed with a volumetrical ratio of 6![[thin space (1/6-em)]](https://www.rsc.org/images/entities/char_2009.gif) :
:![[thin space (1/6-em)]](https://www.rsc.org/images/entities/char_2009.gif) 33
33![[thin space (1/6-em)]](https://www.rsc.org/images/entities/char_2009.gif) :
:![[thin space (1/6-em)]](https://www.rsc.org/images/entities/char_2009.gif) 1.2 under room temperature (25 °C) to form a water glass solution. The spherical silica gel was prepared by a “ball drop method”. The water glass solution was dropped into a dimethylsilicic oil bath at 70 °C to form the spherical silica gel. The spherical silica gel was washed with deionized water 3 times at 70 °C, and aged at 50 °C for 2 days. Then the spherical silica gel was transferred into an APTES/EtOH/W solution with a molar ratio of 1
1.2 under room temperature (25 °C) to form a water glass solution. The spherical silica gel was prepared by a “ball drop method”. The water glass solution was dropped into a dimethylsilicic oil bath at 70 °C to form the spherical silica gel. The spherical silica gel was washed with deionized water 3 times at 70 °C, and aged at 50 °C for 2 days. Then the spherical silica gel was transferred into an APTES/EtOH/W solution with a molar ratio of 1![[thin space (1/6-em)]](https://www.rsc.org/images/entities/char_2009.gif) :
:![[thin space (1/6-em)]](https://www.rsc.org/images/entities/char_2009.gif) 24
24![[thin space (1/6-em)]](https://www.rsc.org/images/entities/char_2009.gif) :
:![[thin space (1/6-em)]](https://www.rsc.org/images/entities/char_2009.gif) 3 for amine grafting at 50 °C. The spherical amine grafted silica gels with different grafting days were dried by VD to form the spherical amine grafted silica aerogels (SASAs), denoting as SASA-d, where d represents the grafting days. The spherical silica aerogel (SSA) without amine functionalization was prepared as control sample.
3 for amine grafting at 50 °C. The spherical amine grafted silica gels with different grafting days were dried by VD to form the spherical amine grafted silica aerogels (SASAs), denoting as SASA-d, where d represents the grafting days. The spherical silica aerogel (SSA) without amine functionalization was prepared as control sample.
2.3. Characterization
Apparent density (ρa) was calculated on account of the weight and the physical dimensions of the samples. Using a ZEISS 1530VP scanning electron microscope (SEM) to investigate morphology of the adsorbent. N2 adsorption/desorption observation was determined with a Quantachrome Autosorb-iQ analyzer. Before testing, samples were degassed for 6 hours at 90 °C under vacuum. Specific surface area and pore size distribution were calculated using Brunauer–Emmett–Teller (BET) and the Non Local Density Functional Theory (NLDFT) models, respectively. X-ray Photoelectron Spectroscopy (XPS) measurements were recorded on a Physical Electronics PE5800 ESCA/AES system. Fourier transform infrared spectra (FTIR) were analyzed by using a Bruker ALPHA infrared spectrometer. TG curves were examined by using a TA model SDT Q600 thermogravimetric analyzer.2.4. CO2 capture test
The CO2 capture test of the SASAs was performed on a fixed bed equipment. Dry 1% CO2 was utilized for CO2 adsorption and pure N2 was utilized for CO2 desorption. The flowrates were 300 ml min−1. The SASA sample was packed in a circular glass tube (Φ25 × 2 mm) to form a fixed bed. When the temperature was 130 °C, the SASA was treated in N2 flow for 30 min. Then the fixed bed was cooled down to a certain temperature, N2 was changed to 1% CO2. The CO2 adsorption was regarded as equilibrium when the outlet CO2 concentration achieved 1%. For CO2 desorption, 1% CO2 was changed to N2, the temperature of the glass tube was elevated to 90 °C and held at that temperature for 20 min. The breakthrough curves and background of the adsorbent can be used for calculating the CO2 adsorption capacity. To obtain the cyclic CO2 adsorption capacity, the aforementioned procedures were performed repeatedly.3. Results and discussion
3.1. Formation mechanism of the SASA
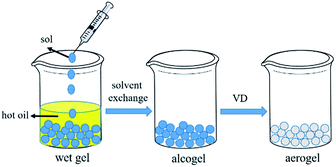
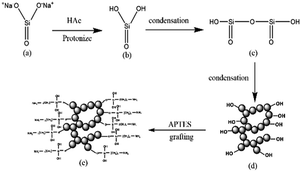
The schematic diagram of the formation of the spherical silica aerogel is presented in Fig. 1. The silica sol is aqueous, which is indissoluble with oil. The liquid ball is formed when dropping the silica sol into the oil bath. The sol–gel kinetics is affected by the temperature significantly. Therefore, a temperature of 70 °C was used to accelerate the gelation. The spherical silica gel was formed as soon as the silica sol was dropped into the hot oil, which avoid the damage of the spherical droplet. The synthetic mechanism of the spherical amine silica aerogels is presented in Fig. 2. The sodium silicate (a) transformed to silicic acid (b) by protonation after adding the acetic acid. Two silicic acid molecules react to form the Si–O–Si linkage (c) by leaving a water molecule. The silica gel (d) was formed along with the growth of the network via the dehydration condensation of the silicic acid. The sol–gel process was controlled by the amount of acid catalyst to ensure that the gel instead of precipitation is obtained. There are many hydroxyl groups on the surface of the silica gel, which can be used for amine grafting. The hydrolysed APTES species react with hydroxyl groups via dehydration condensation to achieve the amine grafting of silica gel (e).3.2. Morphology and microstructure
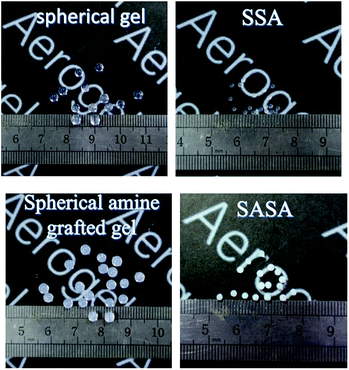
The photographs of the spherical silica gels and aerogels are shown in Fig. 3. The spherical silica gel and aerogel are transparent, and they become white after amine grafting. Vacuum drying leads to obvious shrinkage of the special silica gels whether or not amine grafted. However, the resulting spherical aerogels did not disintegrate and still remain intact appearance, which indicates that VD can be used to prepare aerogels as a low-cost and convenient method. As shown in Table 1, amine grafting leads to the increase of the apparent density. Moreover, the apparent density of the SASAs increases with the grafting time, indicating that more amine groups are loaded when increasing the modification time.| Samples | Apparent density (g cm−3) | BET specific surface (m2 g−1) | Pore volume (cm3 g3) | CO2 adsorption capacity (mmol g−1) |
|---|---|---|---|---|
| SSA | 0.0928 | 541.040 | 1.4830 | |
| SASA-1 | 0.1055 | 255.133 | 0.5545 | 1.00 |
| SASA-3 | 0.1366 | 203.586 | 0.4883 | 1.56 |
| SASA-5 | 0.1780 | 123.024 | 0.2336 | 1.54 |
| SASA-7 | 0.2013 | 25.278 | 0.0404 | 0.45 |
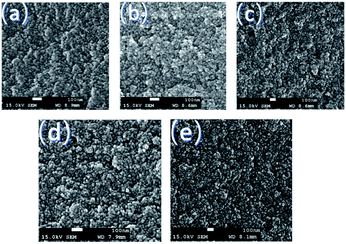
The N2 adsorption–desorption isotherms and pore size distribution curves of the SSA and SASAs are given in Fig. 4. The isotherms for SASAs displayed type IV isotherms with H1 hysteresis loops, which indicated a characterization of typical mesoporosity. The noticeable saturation adsorption platforms demonstrate that there are no macropores in the SASAs, which is supported by their pore size distribution curves. The pore sized distribution curves of the SASAs also reveal that the pores concentrates on the range of 3–20 nm and are gradually blocked along with the increase of the amine grafting, which is also observed from the SEM images. The specific surface areas and pore volumes of the SASAs are shown in Table 1, which are accordance with the results discussed above. SEM images of the SSA and SASAs with different amine grafting days are shown in Fig. 5. The samples have compact network with colloidal structure, owing to the aforementioned shrinkage during VD process.
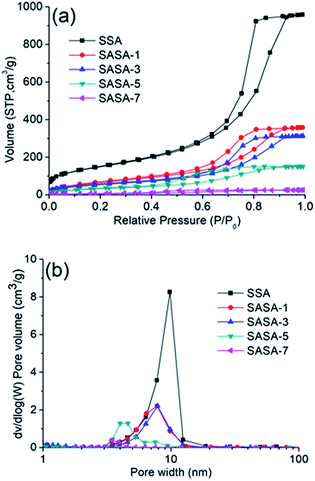 | ||
| Fig. 4 (a) N2 adsorption/desorption isotherms and (b) pore-size distribution curves of the SSA and SASAs. | ||
3.3. Chemical structure
The FTIR spectra of the SSA and SASAs are presented in Fig. 6(a). The bands observed near 3433 cm−1 have the O–H stretching vibration from Si–OH groups and the hydrogen bonded water. The bands at 1385, 2852 and 2922 cm−1, respectively represented the symmetric deformation vibration, symmetric stretching vibration, and antisymmetric stretching vibration of C–H (–CH2).53 The band corresponding to the Si–O in-plane stretching vibration of Si–OH group is ascribed to 966 cm−1.53 The appearance of –CH2 group and the disappearance of Si–OH group after grafting suggest that the APTES was successfully grafted on to the framework of the silica wet gel. The bands are shown at around 1000–1250, 800, 689 and 460 cm−1, which are ascribed to the vibration of Si–O–Si, Si–O, Si–O–Si and O–Si–O of silica, respectively.53 The bands around 1640 cm−1 are due to the deformation vibration of H–O–H (adsorbed water).53 It should be noted that the bands resulted from free amine and H-bonded amine can be coved by the band of adsorbed water at 1640 cm−1.54–56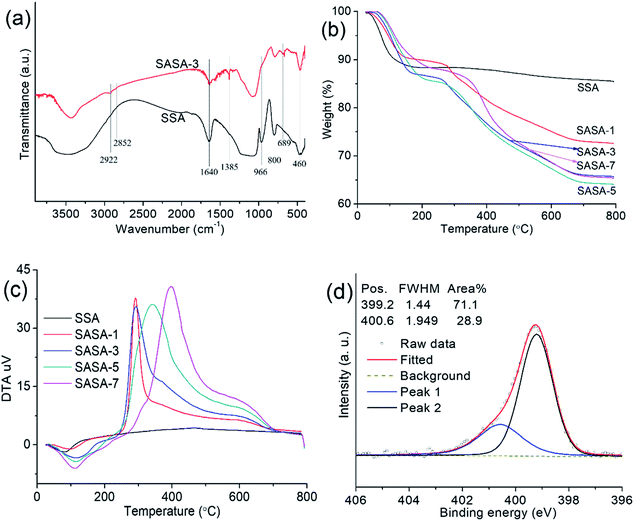 | ||
| Fig. 6 (a) FTIR spectra, (b) TG curves, (c) DSC curves and (d) N 1s XPS spectrum of the SSA and SASA samples. | ||
The TG and DSC curves of the SSA and SASAs are presented in Fig. 6(b–c). For SSA, weight losses below 120 °C are caused by the elimination of CO2 and the adsorbed moisture. In the temperature range from 120 and 230 °C, weight losses are ascribed to the boned water. Weight losses after 230 °C correspond to the decomposition of the organic species, such as amine and hydroxyl groups. For SASA-1, SASA-3, SASA-5, weight losses below 130–202 °C are ascribed to the elimination of CO2 and the adsorbed moisture. From 150 °C to 280 °C, weight losses are caused by the boned water. Weight losses after 230 °C correspond to the decomposition of the organic species, such as amine and hydroxyl groups. It reveals that the amine loading increases with the grafting time. For SASA-7, weight losses below 230 °C are ascribed to the elimination of CO2 and the adsorbed moisture. In the temperature range from 230 and 350 °C, weight losses are caused by the boned water. Weight losses after 350 °C derive from the decomposition of the organic species, such as amine and hydroxyl groups. The results demonstrate that the temperatures for the moisture and CO2 desorption and the organic moieties decomposition of the SASA samples increase with the grafting time. The reason is that the specific area decreases with the grafting time, and low specific surface area leads to the low reactivity of the SASA samples. Weight loss of the SASA-7 at 800 °C is lower than that of the SASA-5. It can be explained by that no more APTES species are grafted when the grafting time is more than 5 days. The condensation polymerization will take place among the hydroxyl groups derived from the hydrolyzed APTES, which leads to the loss of the organic moieties during sample preparation.
The N 1 s XPS spectrum is presented in Fig. 6(d). The N 1s spectrum of the SASA-3 showed two bands at 399.2 eV and 400.6 eV, respectively corresponding to free amine and H-boned amine.43–45 The H-boned amines can form between an amine group and other groups such as –NH2 and –OH.57 The amine (N) surface contents of the SASA-1, SASA-3, SASA-5 and SASA-7 from the XPS tests are 4.38, 4.52, 3.86 and 1.45 mmol g−1, respectively. The amine surface content of the SASAs first increases, then starts to decrease with grafting time. It is explained that pores are gradually blocked along with the increase of the amine grafting.
3.4. CO2 adsorption performances
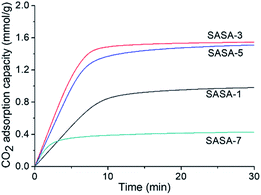
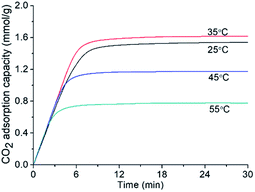
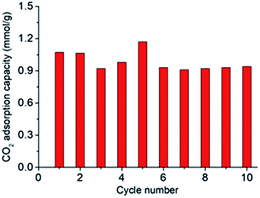
As shown in Fig. 7, the CO2 adsorption kinetics of the SASAs change with different grafting times. The CO2 adsorption capacity first increases, then starts to decrease with grafting time. Although longer grafting time leads to larger amine loading according to the TG curves, the highest CO2 adsorption capacity of the SASA-3 was 1.56 mmol g−1. It is explained by that the amine surface content depends on both amines loading and specific surface area. Excessive amine loading leads to the sharp decline of the specific surface area, many amine groups are covered. It indicates that the amine loading should be controlled to avoid the blockage of the pore space and achieve a high amine surface content.As shown in Fig. 8, the CO2 adsorption kinetics of the SASA-3 change with different temperatures. On account of the thermodynamic theory, the CO2 adsorption capacity of the amine-based adsorbents should decrease with the temperature.58 However, the CO2 adsorption capacity of the SASA-3 increases from 25 to 35 °C, then decreases with the temperature below 55 °C. The reason is that the mass transfer and reaction activity are limited under low temperature.33,40,59 When the temperature was above 35 °C, the thermodynamics would become predominant again. Fig. 9 shows the cyclic adsorption capacities of SASA-3 at 35 °C. The SASA-3 shows excellent stability with 10 cycles. It indicates that amine groups in the SASA are immobilized to the aerogel via forming the chemical bonds.
Amine hybrid silica aerogels had excellent CO2 adsorption capacities. The highest CO2 adsorption capacity of the amine hybrid silica aerogels was 4.19 mmol g−1 with dry 1% CO2.43–45,60,61 The CO2 adsorption capacity of the SASA with dry 1% CO2 is lower than these adsorbents. However, the weight or volume of the whole fixed bed should be taken into account when evaluating the performances of the CO2 adsorbents. For example, an amine hybrid silica aerogel had to mix with sand to avoid the blockage of the fixed bed, only 4% amine hybrid silica aerogel was involved in the whole fixed bed.43 As a consequence, the optimal CO2 adsorption capacity of the amine hybrid silica aerogel with dry 1% CO2 decreased from 3.57 mmol g−1 to 0.14 mmol g−1 when considering the whole weight of the fixed bed.43 On the other hand, the drying method should be considered. Kong synthesized an amine hybrid silica aerogel by ambient pressure drying (APD), which only achieved a CO2 adsorption capacity of 1.52 mmol g−1 with dry 1% CO2.40,62 CO2 adsorption capacities of SASA-3 and its state-of-art counterparts are given in Table 2. The CO2 adsorption capacity of the SASA (1.56 mmol g−1) is higher than its state-of-art counterparts with similar preparation and test conditions.
| Adsorbent | Year | Preparation method | CO2 concentration | Apparatus | Capacity (mmol g−1) | Researcher |
|---|---|---|---|---|---|---|
| SASA-3 | 2020 | Ball drop | Dry 1% at 35°C | Fixed bed | 1.56 | This work |
| SA-I-80 | 2013 | Sol–gel | Dry 10% at 75°C | TGA | 3.5 | Linneen et al.32,33 |
| AFSAS | 2012 | Sol–gel | Humid 0.25% | Fixed bed | 1.07 | Wörmeyer et al.35–37 |
| AFA | 2013 | Sol–gel | Dry 10% | TGA | 1.43 | Begag et al.39 |
| AH-RFSA | 2015 | One-step sol–gel | Humid/dry 450 ppm | Fixed bed | 1.80/2.57 | Kong et al.40–45 |
| AHSA | 2017 | Sol–gel | Dry 1% | Fixed bed | 1.52 | Kong et al.40–62 |
4. Conclusions
The SASAs were synthesized by a simple, convenient, low-cost and environmental-friendly method. The low-cost water glass was used as precursor to prepare the spherical silica gel by a ball drop method. Amine functionalization of the spherical silica gel was achieved by APTES grafting. The low-cost and convenient vacuum drying was used to dry the silica gels. The CO2 adsorption capacity depended on the adsorption temperature and amine surface content. The amine surface content was influenced by the specific surface area and amine loading, which can be controlled by the grafting time. Long grafting time leaded to the blockage of the pore space and coverage of the amine groups, thus resulted in the decrease of the amine surface loading. The CO2 adsorption capacity of the SASA is higher than its state-of-art counterparts with dry 1% CO2. It indicates that this work can provide low-cost and environmentally friendly way on the design of a capable and regenerable adsorbent material for low-concentration CO2 capture. The SASA can be used in a fluidized bed reactor without pelleting which is involved in powder-like adsorbents. CO2 adsorption performances of the SASA in the fluidized bed reactor are currently being studying.Conflicts of interest
There are no conflicts to declare.Acknowledgements
The authors acknowledge the supports from the National Natural Science Foundation of China (51602151), the Natural Science Foundation of Jiangsu Province – China (BK20161003), the Project funded by China Postdoctoral Science Foundation (2018T110490, 2018M642228), and the Priority Academic Program Development of Jiangsu Higher Education Institution (PAPD) – China.Notes and references
- Y. Guo, C. Zhao, C. Li and S. Lu, Appl. Energy, 2014, 129, 17–24 CrossRef CAS.
- C. W. Zhao, X. P. Chen, E. J. Anthony, X. Jiang, L. B. Duan, Y. Wu, W. Dong and C. S. Zhao, Prog. Energy Combust. Sci., 2013, 39, 515–534 CrossRef.
- Y. Xu, V. Ramanathan and D. G. Victor, Nature, 2018, 564, 30–32 CrossRef CAS PubMed.
- M. McNutt, Science, 2019, 365, 411 CrossRef CAS PubMed.
- Z. N. Song, Q. B. Dong, W. W. L. Xu, F. L. Zhou, X. H. Liang and M. Yu, ACS Appl. Mater. Interfaces, 2018, 10, 769–775 CrossRef CAS PubMed.
- S. R. Yan, D. Zhu, Z. Y. Zhang, H. Li, G. J. Chen and B. Liu, Appl. Energy, 2019, 248, 104–114 CrossRef CAS.
- D. Das and B. C. Meikap, Fuel, 2018, 224, 47–56 CrossRef CAS.
- L. Jiang, A. Gonzalez-Diaz, J. Ling-Chin, A. P. Roskilly and A. J. Smallbone, Appl. Energy, 2019, 245, 1–15 CrossRef CAS.
- N. A. A. Qasem, R. Ben-Mansour and M. A. Habib, Appl. Energy, 2018, 210, 317–326 CrossRef CAS.
- Y. Jiang, P. Tan, S. C. Qi, X. Q. Liu, J. H. Yan, F. Fan and L. B. Sun, Angew. Chem., Int. Ed., 2019, 58, 6600–6604 CrossRef CAS PubMed.
- D. Yu, J. Hu, L. H. Zhou, J. X. Li, J. Tang, C. J. Peng and H. L. Liu, Energy Fuels, 2018, 32, 3726–3732 CrossRef CAS.
- M. Irani, A. T. Jacobson, K. A. M. Gasem and M. H. Fan, Energy, 2018, 157, 1–9 CrossRef CAS.
- T. Wang, J. Liu, H. Huang, M. Fang and Z. Luo, Chem. Eng. J., 2016, 284, 679–686 CrossRef CAS.
- T. Wang, K. S. Lackner and A. B. Wright, Phys. Chem. Chem. Phys., 2013, 15, 504–514 RSC.
- Y. Wu, X. Chen, M. Fan, G. Jiang, Y. Kong and A. E. Bland, Chem. Eng. J., 2015, 262, 1192–1198 CrossRef CAS.
- C. Zhao, Y. Guo, W. Li, C. Bu, X. Wang and P. Lu, Chem. Eng. J., 2017, 312, 50–58 CrossRef CAS.
- N. Linneen, R. Pfeffer and Y. S. Lin, Microporous Mesoporous Mater., 2013, 176, 123–131 CrossRef CAS.
- W. Yu, T. Wang, A. H. A. Park and M. X. Fang, Nanoscale, 2019, 11, 17137–17156 RSC.
- T. Wang, K. Ge, Y. S. Wu, K. X. Chen, M. X. Fang and Z. Y. Luo, Energy Fuels, 2017, 31, 11127–11133 CrossRef CAS.
- C. L. Hou, Y. S. Wu, T. Wang, X. R. Wang and X. Gao, Energy Fuels, 2019, 33, 1745–1752 CrossRef CAS.
- Y. Uehara, D. Karami and N. Mahinpey, Microporous Mesoporous Mater., 2019, 278, 378–386 CrossRef CAS.
- J. Q. Deng, Z. L. Liu, Z. J. Du, W. Zou and C. Zhang, J. Appl. Polym. Sci., 2019, 136, 7 Search PubMed.
- Z. Zhang, Z. P. Cano, D. Luo, H. Z. Dou, A. P. Yu and Z. W. Chen, J. Mater. Chem. A, 2019, 7, 20985–21003 RSC.
- S. Z. Zhang, J. Feng, J. Z. Feng, Y. G. Jiang and F. Ding, Appl. Surf. Sci., 2018, 440, 873–879 CrossRef CAS.
- S. Z. Zhang, J. Feng, J. Z. Feng and Y. G. Jiang, Chem. Eng. J., 2017, 309, 700–707 CrossRef CAS.
- Y. H. Kwok, Y. F. Wang, A. C. H. Tsang and D. Y. C. Leung, Appl. Energy, 2018, 217, 258–265 CrossRef CAS.
- C. Kleemann, I. Selmer, I. Smirnova and U. Kulozik, Food Hydrocolloids, 2018, 83, 365–374 CrossRef CAS.
- S. Antonyuk, S. Heinrich, P. Gurikov, S. Raman and I. Smirnova, Powder Technol., 2015, 285, 34–43 CrossRef CAS.
- V. Baudron, P. Gurikov and I. Smirnova, Colloids Surf., A, 2019, 566, 58–69 CrossRef CAS.
- K. Ganesan, T. Budtova, L. Ratke, P. Gurikov, V. Baudron, I. Preibisch, P. Niemeyer, I. Smirnova and B. Milow, Materials, 2018, 11, 37 CrossRef PubMed.
- S. Meng, J. Y. Zhang, W. P. Chen, X. P. Wang and M. F. Zhu, Microporous Mesoporous Mater., 2019, 273, 294–296 CrossRef CAS.
- N. Linneen, R. Pfeffer and Y. Lin, Microporous Mesoporous Mater., 2013, 176, 123–131 CrossRef CAS.
- N. N. Linneen, R. Pfeffer and Y. Lin, Ind. Eng. Chem. Res., 2013, 52, 14671–14679 CrossRef CAS.
- Z. Wang, Z. Dai, J. Wu, N. Zhao and J. Xu, Adv. Mater., 2013, 25, 4494–4497 CrossRef CAS PubMed.
- K. Woermeyer and I. Smirnova, Microporous Mesoporous Mater., 2014, 184, 61–69 CrossRef CAS.
- K. Wörmeyer, M. Alnaief and I. Smirnova, Adsorption, 2012, 18, 163–171 CrossRef.
- K. Wörmeyer and I. Smirnova, Chem. Eng. J., 2013, 225, 350–357 CrossRef.
- N. N. Linneen, R. Pfeffer and Y. S. Lin, Chem. Eng. J., 2014, 254, 190–197 CrossRef CAS.
- R. Begag, H. Krutka, W. Dong, D. Mihalcik, W. Rhine, G. Gould, J. Baldic and P. Nahass, Greenhouse Gases: Sci. Technol., 2013, 3, 30–39 CrossRef CAS.
- Y. Kong, G. Jiang, M. Fan, X. Shen and S. Cui, RSC Adv., 2014, 4, 43448–43453 RSC.
- Y. Kong, G. D. Jiang, M. H. Fan, X. D. Shen, S. Cui and A. G. Russell, Chem. Commun., 2014, 50, 12158–12161 RSC.
- Y. Kong, X. Shen, S. Cui and M. Fan, Green Chem., 2015, 17, 3436–3445 RSC.
- Y. Kong, X. Shen, S. Cui and M. Fan, Appl. Energy, 2015, 147, 308–317 CrossRef CAS.
- Y. Kong, G. Jiang, Y. Wu, S. Cui and X. Shen, Chem. Eng. J., 2016, 306, 362–368 CrossRef CAS.
- Y. Kong, X. D. Shen, M. H. Fan, M. Yang and S. Cui, Chem. Eng. J., 2016, 283, 1059–1068 CrossRef CAS.
- X. D. Cheng, C. C. Li, X. J. Shi, Z. Li, L. L. Gong and H. P. Zhang, Mater. Lett., 2017, 204, 157–160 CrossRef CAS.
- L. Yan, H. B. Ren, J. Y. Zhu, Y. T. Bi and L. Zhang, J. Porous Mater., 2019, 26, 785–791 CrossRef CAS.
- Z. Mazrouei-Sebdani, S. Salimian, A. Khoddami and F. Shams-Ghahfarokhi, Mater. Res. Express, 2019, 6, 10 Search PubMed.
- P. R. Aravind, P. Shajesh, G. D. Soraru and K. G. K. Warrier, J. Sol–Gel Sci. Technol., 2010, 54, 105–117 CrossRef CAS.
- R. Garrido, J. D. Silvestre, I. Flores-Colen, M. D. Julio and M. Pedroso, J. Non-Cryst. Solids, 2019, 516, 26–34 CrossRef CAS.
- I. Pinto, J. D. Silvestre, J. de Brito and M. F. Julio, J. Cleaner Prod., 2020, 252, 9 CrossRef.
- M. M. Koebel, L. Huber, S. Y. Zhao and W. J. Malfait, J. Sol–Gel Sci. Technol., 2016, 79, 308–318 CrossRef CAS.
- R. Al-Oweini and H. El-Rassy, J. Mol. Struct., 2009, 919, 140–145 CrossRef CAS.
- S. Culler, H. Ishida and J. Koenig, J. Colloid Interface Sci., 1985, 106, 334–346 CrossRef CAS.
- C. Cherkouk, L. Rebohle, W. Skorupa, T. Strache, H. Reuther and M. Helm, J. Colloid Interface Sci., 2009, 337, 375–380 CrossRef CAS PubMed.
- D. G. Kurth and T. Bein, Langmuir, 1993, 9, 2965–2973 CrossRef CAS.
- N. Planas, A. L. Dzubak, R. Poloni, L. C. Lin, A. Mcmanus, T. M. Mcdonald, J. B. Neaton, J. R. Long, B. Smit and L. Gagliardi, J. Am. Chem. Soc., 2013, 135, 7402–7405 CrossRef CAS PubMed.
- M. Irani, M. Fan, H. Ismail, A. Tuwati, B. Dutcher and A. G. Russell, Nano Energy, 2015, 11, 235–246 CrossRef CAS.
- L. He, M. Fan, B. Dutcher, S. Cui, X.-d. Shen, Y. Kong, A. G. Russell and P. McCurdy, Chem. Eng. J., 2012, 189–190, 13–23 CrossRef CAS.
- Y. Kong, J. Zhang and X. Shen, J. Sol–Gel Sci. Technol., 2017, 84, 422–431 CrossRef CAS.
- Y. Kong, X. Shen and S. Cui, Microporous Mesoporous Mater., 2016, 236, 269–276 CrossRef CAS.
- Y. Kong, X. Shen, S. Cui and M. Fan, Int. J. Glob. Warming, 2017, 12, 228–241 CrossRef.
| This journal is © The Royal Society of Chemistry 2020 |

