 Open Access Article
Fabrication of hierarchically porous superhydrophilic polycaprolactone monolith based on nonsolvent-thermally induced phase separation†
Yu Caoa,
Wenjuan Han *a,
Ziyang Pua,
Xiaofeng Wang
 b,
Bo Wanga,
Chuntai Liuc,
Hiroshi Uyama
 d and
Changyu Shenc
aSchool of Materials Science & Engineering, Zhengzhou University, Zhengzhou 450001, China. E-mail: wenjuan.han@zzu.edu.cn
bSchool of Mechanics and Engineering Science, National Center for International Research of Micro-Nano Molding Technology, Key Laboratory of Henan Province for Micro Molding Technology, Zhengzhou 450001, China
cKey Laboratory of Materials Processing and Mold, Ministry of Education, National Engineering Research Center for Advanced Polymer Processing Technology, Zhengzhou University, Zhengzhou 450001, China
dDepartment of Applied Chemistry, Graduate School of Engineering, Osaka University, Suita, 565-0871, Japan
First published on 13th July 2020
Abstract
Monoliths with a continuous porous structure are of great interest due to high transfer efficiency and large surface area in environmental and tissue engineering fields. This study demonstrated a facile method to prepare PCL monoliths with hierarchically porous structure by nonsolvent-thermally induced phase separation. A suitable mixed solvent mixture using ethanol as nonsolvent reduced the amount of dioxane and provided PCL monoliths with three levels of structures. The monolith structure was easily controlled by changing the fabrication parameters, such as the nonsolvent, the temperature of phase separation, the concentration of the PCL. Finally, the superhydrophilic monolith was easily obtained by polydopamine surface modification. The easy way of fabrication of a hierarchically porous PCL monolith with superhydrophilicity will find applications such as in tissue engineering and purification.
1. Introduction
Hierarchically porous monoliths with macropores (>50 nm) and mesopores (2–50 nm) are generally highly porous, with high surface area, large accessible space, low density and interconnected hierarchical porosity at different length scales.1 Owing to their diversity and performance, hierarchically porous monolith have been attractive for applications in wastewater treatment, battery electrodes and tissue engineering.1–6 As a result, the fabrication of hierarchical monoliths with sufficient porosity, tunable pore size and interconnected 3D pores is attracting a lot of attention.Up to now, many methods have been reported to fabricate hierarchically porous polymeric monoliths, such as porogen leaching, electrospinning, emulsion-templated, foaming and self-assembly.7–10 Porogen leaching is helped with additives, such as salt and sugars.11 The electrospinning process fabricates fibers with tunable diameters, however, it is challenged with well-defined 3D porous structures and geometries.12 The emulsion-templated method usually contains additives because of polymerization from monomer, which is difficult to simultaneously control the polymerization and pore-forming process.13 The foaming technology requires the precise control on the forming agent and the pore structures simultaneously, which is also by the aid of sophisticated devices.
Phase separation is an effective method to prepare hierarchically porous materials due to the advantages of simple equipment requirement and easy operation, which can be divided by thermally induced phase separation (TIPS) and nonsolvent induced phase separation (NIPS).5,14–19 In addition, the combined nonsolvent-thermally induced phase separation (NTIPS) method are also applied to fabricate porous monolith by employing a miscible solvent mixture and by controlling the temperature.20,21 However, the relationship of the fabrication parameters and the desired structures have not been fully elucidated.
Poly(ε-caprolactone) (PCL), biodegradable polymer, is attractive as it has longer degradation time, flexible and tough mechanical properties.22,23 In the present study, PCL monolith will be fabricated by NTIPS method. The effect of processing parameters, including nonsolvent, phase separation temperature (Tps) and PCL concentration (CPCL), on the morphology of PCL monolith is discussed. Furthermore, the surface hydrophilicity of PCL monolith is adjusted by a one-step method.
2. Experimental
2.1 Materials
PCL was purchased from Swiss Perstorp(CAPA 6500, Mn = 5 × 10⁴ g mol−1). Dioxane and ethanol were purchased from Tianjin Fuyu Fine Chemical. Dopamine hydrochloride was purchased from Beijing Huawei Ruike Chemical. Tris was purchased from Haiyuan Ye Biotechnology. Deionized water was used as provided.2.2 Preparation of PCL monolith
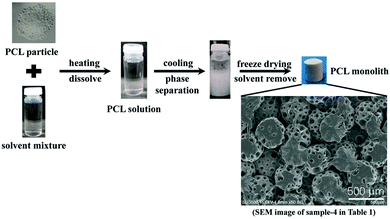
Fig. 1 showed schematic of PCL monolith preparation process. Firstly, a certain amount of PCL and solvent mixture were mixed in a glass tube by heating at 55 °C with mechanical agitation for 4 hours to get a transparent uniform solution. After that, the glass tube was placed at different temperatures for phase separation for 24 hours to get wet PCL monolith. Finally, wet PCL monolith was washed in deionized water and dried in lyophilizer. The preparation parameters are listed in Table 1. In this study three Tps were chosen, 20 °C, 4 °C, −18 °C, which were room temperature, refrigerated temperature and freezing temperature, respectively. The other preparation parameters were decided by the phase diagram which was determined by the calculated of cloud point, as shown in Fig. S1 and S2.†| Sample | CPCL (mg mL−1) | Solvent mixture dioxane/ethanol (v/v) | Tps (°C) |
|---|---|---|---|
| 1 | 80 | 30/70 | −18 |
| 2 | 80 | 30/70 | 4 |
| 3 | 80 | 30/70 | 20 |
| 4 | 100 | 30/70 | 20 |
| 5 | 120 | 30/70 | 20 |
| 6 | 140 | 30/70 | 20 |
| 7 | 140 | 25/75 | 20 |
2.3 Surface modification of PCL monolith
0.1 g of dopamine hydrochloride was dissolved in the mixture of 50 mL Tris–HCl buffer (pH = 8.5) and 20 mL ethanol. The solution was stirred until the solution changed from colorless to dark black to form polydopamine (PDA). Then, the PCL monolith (sample-4 obtained in Saection 2.2) was immersed in the as-prepared PDA solution with degassing for 18 hours. After that the monolith was washed with deionized water and subsequently dried at 40 °C for 12 hours in a vacuum oven to obtain the PDA-PCL monolith.2.4 Characterization
Surface morphologies of the samples were observed with a field emission scanning electron microscope (SEM, Hitachi S3000N). A thin gold film was sputtered on the samples before the images were collected. N2 adsorption/desorption isotherms were measured with a NOVA 4200e Surface Area & Pore Size Analyzer (Quantachrome Instruments) at 77 K. Before the measurements, all samples were degassed at 20 °C under vacuum for at least 6 hours. The Brunauer–Emmett–Teller (BET) method was utilized to determine the specific surface areas and Density Functional Theory (DFT) method was applied to calculate the pore sizes distribution. Differential scanning calorimetry (DSC) thermograms was taken using a Seiko DSC6020 instrument at the heating/cooling rate of 10 °C min−1 under nitrogen. Water contact angles (CA) were measured on a contact angle analysis system (Zhongchen JC2000C) at room temperature with 5 μL of water droplets as indicators. The surface chemistry of the membranes was characterized by a Fourier transform infrared spectrometer (FT-IR, NICOLET IS50). The transmittance of each sample was recorded between 4000 cm−1 and 500 cm−1 with a resolution of 2 cm−1. The PDA coating on the surface of PCL monolith was analyzed by X-ray photoelectron spectroscopy (XPS, Miniscope TM 3000 equipped with Swift ED 3000 Hitachi). The XPS N 1s core-level signal was used as a marker for the analysis of the PDA on the surface.3. Results and discussion
3.1 The Hansen solubility parameters
In this study, the dioxane was employed as the good solvent for PCL dissolving. The ethanol was selected as nonsolvent to induce the NTIPS due to its environmentally friendly, low toxicity and low cost. When the solvent mixture of dioxane and ethanol at the volume ratios of 25/75, 30/70 (recorded as E25/75, E30/70), respectively, the PCL monolith could be obtained at the Tps of 20 °C, 4 °C and −18 °C. At the phase separation temperature, the solvent mixture of E30/70 was still liquid, as shown in Fig. S3.†To investigate the interaction of PCL and the solvents, the distance D between the solvent and the solute in the “solubility space” which affected the solubility of polymers in solvents was calculated based on the Hansen's solubility theory. According to the referenced formulae (S1)–(S3),† the solubility parameters of different materials were calculated and listed in Table S2.†
In general, when the distance D between the solvent and the polymer was less than 7.5, the solvent was regarded as a good solvent, otherwise the solvent was a nonsolvent.24,25 The distance D between the polymer and different solvent at different Tps was shown in Fig. 2. It can be found that the D between PCL and solvent mixture (E25/75 and E30/70) were all higher than 7.5, which explained the reason that phase separation can easily be generated at all three temperatures, and the monoliths were obtained accordingly.
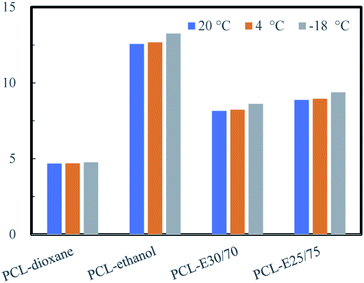 | ||
| Fig. 2 The distance D between the polymer and different solvent at different Tps (20 °C, 4 °C, −18 °C respectively). | ||
The experimental and theoretical results suggested that the ethanol was an efficient nonsolvent, because the phase separation could take place even at room temperature which was higher than the freezing point of the solution. Therefore, the ethanol acting as nonsolvent in this study enlarged the processing window and reduced the energy consumption in the preparation of PCL monolith. In addition, the distance D, the Hanses solubility parameter, can provide an effective way to predict whether phase separation could occur in different solution systems.
3.2 Morphology control of the PCL monolith
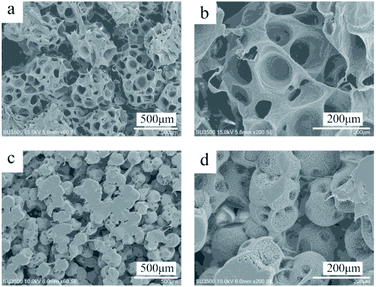
Phase separation method had been extensively applied in fabrication of monolith. In a TIPS process, the presence of temperature gradient induced spatial variation leading to a change in chemical potential, which was the driving force for phase separation. When the thermodynamic equilibrium was broken, liquid–liquid phase separation in a polymer-rich and a polymer-lean phase can take place, which includes two phase separation mechanism namely nucleation growth (NG) mechanism and spinodal decomposition (SD) mechanism.26 The polymer-rich phase leaded the skeleton and the polymer-lean phase leaded the pores. By introducing a nonsolvent in this NTIPS method, ethanol, the increased potential of polymer precipitation further promoted the efficiency of TIPS. The effect of fabrication parameters on the morphology of the PCL monolith based on the NTIPS method was discussed.The globular structure might be the result of the NG mechanism in the liquid–liquid (L–L) phase separation, and subsequently a crystallization process taking place in the polymer rich phase. During the crystallization, crystal lamellae grew freely in 3D space from the center, showing spherulite shapes. It was known that crystallization in solution followed the similar rules within polymer melt when the solution concentration was high (not dilute solution), namely nucleation and growth. Firstly, there should be nuclei formed by either self-assembly (homogeneous nucleation) or as-existed impurities (heterogeneous nucleation). The molecular chains diffused and arranged themselves in a crystal lattice and thus the crystallite grew to be larger and larger. In the solvent mixture, the solvent and nonsolvent served as impurities. When more nonsolvent was added in the solution, the dissolvability of PCL decreased, therefore the interaction between polymer and solvent became weaker. Furthermore the viscosity of the solution system decreased accordingly, then polymer chains can more easily arrange to the sphere particles.27 As a result, the sphere particle showed a larger diameter in E25/75 than that in E30/70. The pores shown on the surface of sphere might be the result of aggregated solvent molecules due to the repulsion of freeze drying.28
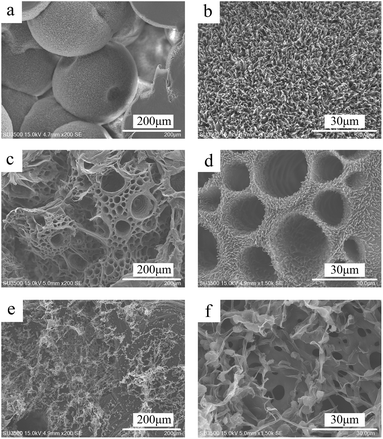
The relationship between the structural feature and Tps reveals that the phase separation temperature played a dominant role on the morphology of PCL monoliths. When the Tps was 20 °C, the phase separation was regarded as the NG mechanism in the L–L phase separation. And a slow cooling rate leaded to a fast crystal growth rate and formation of large “lotus-leaf-like” crystal lamellae. As the temperature decreased to 4 °C, the phase separation changed to NG mechanism of the L–L phase separation. And the PCL solution showed a higher nucleation rate and a lower crystal growth rate, which resulted that the crystal lamellae seemed smaller. When the Tps was −18 °C,with a SD mechanism, the instant nucleation and very slow crystal growth resulted in the formation of fibrous structure.29
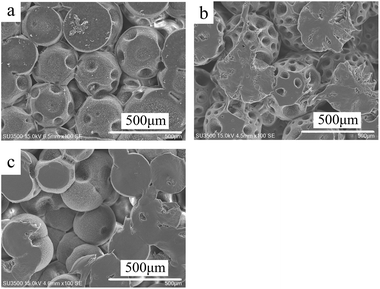 | ||
| Fig. 5 SEM of the morphology of PCL monolith at different PCL concentrations, 120 mg mL−1 (a), 100 mg mL−1 (b), 80 mg mL−1 (c). (E30/70, Tps at 20 °C). | ||
As the concentration of the PCL solution decreased, the viscosity of the PCL solution decreased accordingly. And it was easier for the PCL molecular chain to rearrange to crystalize, which resulted in a larger diameter of the stacking golf-like structure at 20 °C. However, as the CPCL became to 80 mg mL−1, the diameter of the balls decreased due to the number of rearranged crystal chains decreased. This result suggested that the temperature regulate the phase separation mechanism, while solution concentration might affect the geometric dimension of a specific porous feature.
3.3 The hierarchical structure of PCL monolith
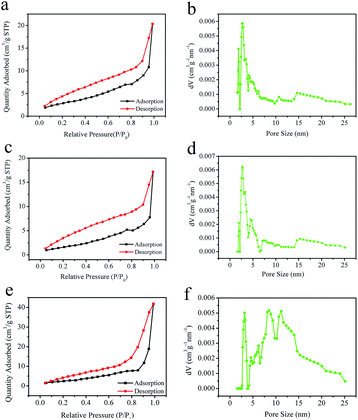
Fig. 6(a), (c) and (e) shows the adsorption/desorption isotherms of the PCL monolith at 77 K, which was a type V adsorption with H1 type hysteresis loop in the P/P0 range from 0.2 to 1.0, whose characteristic was mesoporosity and low energy of adsorption. The specific surface area was determined to be 10.4 m2 g−1, 6.5 m2 g−1, 9.1 m2 g−1 for the samples at the Tps of 20 °C, 4 °C, to −18 °C, considering monolayer adsorption by using BET method. These valuescan be compared to the PCL nanofibers with the specific surface area about 7.3 m2 g−1 (average diameter 160 nm), indicating that the PCL monolith had a relatively large specific surface area.30 Fig. 6(b), (d) and (f) display the pore size distribution using the DFT method, which showed that the diameters of the uniform pores were 5.5 nm, 5.3 nm, 9.3 nm, respectively. The results suggested there were numerous nanopores in the monoliths obtained at different Tps, which might contribute significantly to the specific surface area of the monolith. Furthermore, these data indicated that the formation of hierarchically porous structures with relatively uniform mesopores in the PCL monolith.3.4 Crystallization of the PCL monolith
Fig. S4† showed the DSC curves of the first heating of the PCL particle and the PCL monoliths fabricated at different Tps. The calculated DSC result was shown as Table 2. The degree of crystallinity of all the PCL monolith was higher than that of PCL particles at 55%, which was also much higher than that of PCL foams at 37% reported.23 The PCL monolith obtained at 4 °C had the highest degree of crystallinity, 82%. While the melting temperature was all around 61 ± 2 °C, suggesting that the crystalline structure was almost the same. The high degree of crystallinity result indicated that the as-mentioned rough surface of the globular structure was the PCL crystal lamellae.| Sample | χc (%) | Tm (°C) |
|---|---|---|
| PCL particle | 55 | 59 |
| PCL monolith-20 °C | 74 | 61 |
| PCL monolith-4 °C | 82 | 61 |
| PCL monolith-18 °C | 60 | 63 |
3.5 Characterization of modified PDA-PCL monolith
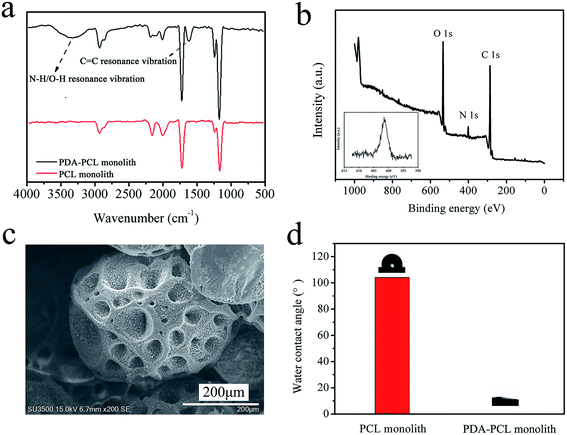
In order to investigate the surface composition after modification, chemical characteristics of PCL and PDA-PCL monolith surface was tested by ATR-FTIR spectroscopy. As shown in Fig. 7(a), the new peaks at 3600–3100 cm−1 and 1600 cm−1 appeared in the spectrum of PDA-PCL monolith, which were due to the stretching vibration of the –NH and –OH groups and the resonance movement of the C![[double bond, length as m-dash]](https://www.rsc.org/images/entities/char_e001.gif) C bond on the benzene ring from PDA.31 The PDA-PCL monolith was further confirmed by XPS measurements. Fig. 7(b) showed an XPS wide scanning and N 1s core-level spectra of the PDA-PCL monolith respectively. The N 1s core-level spectrum of the PDA-PCL monolith had one peak component with the binding energy at about 400 eV, due to the PDA on the monolith surface.31 The morphology of PDA-PCL monolith was shown in Fig. 7(c). It can be clearly observed that there were plenty of tiny white dots attached on the rough surfaces homogeneously. Compared to the neat PCL monolith, the contact angle of PDA-PCL sharply decreased from 105° to nearly 0, and water uptake increased from 74% to 80%, which revealed that a superhydrophilic PDA-PCL monolith was obtained (Fig. 7(d) and S7†).
C bond on the benzene ring from PDA.31 The PDA-PCL monolith was further confirmed by XPS measurements. Fig. 7(b) showed an XPS wide scanning and N 1s core-level spectra of the PDA-PCL monolith respectively. The N 1s core-level spectrum of the PDA-PCL monolith had one peak component with the binding energy at about 400 eV, due to the PDA on the monolith surface.31 The morphology of PDA-PCL monolith was shown in Fig. 7(c). It can be clearly observed that there were plenty of tiny white dots attached on the rough surfaces homogeneously. Compared to the neat PCL monolith, the contact angle of PDA-PCL sharply decreased from 105° to nearly 0, and water uptake increased from 74% to 80%, which revealed that a superhydrophilic PDA-PCL monolith was obtained (Fig. 7(d) and S7†).
The hydrophobicity of PCL porous materials hindered the further applications in tissue engineering and other fields.32–34 As a result, the surface chemistry using adhesive catecholamine inspired by mussel adhesion was developed, which was based on the easy self-polymerization of dopamine to form PDA with the adhesive-layer on any materials.35 The PDA coating was achieved by combined pathways of non-covalent self-assembly of dopamine and 5,6-dihydroxyindole and polymerization of the indole, resulting in the formation of a robust layer of PDA.35 The PDA adhesive-layer might serve as a platform for post-modification. The successful modified PCL monolith by PDA was proved by the result of FT-IR and XPS. And the static water contact angle showed the superhydrophlic of the PDA-PCL monolith. This simple one-step deposition modification of PCL monolith may expand considerably in the range of application in water treatment and tissue engineering.
4. Conclusions
A hierarchically porous PCL monolith was successfully fabricated from a PCL solution by the combination of TIPS and NIPS. A high efficient solvent mixture with ethanol acting as nonsolvent provided the PCL monolith with a 3D continuous hierarchically porous structure at different Tps. The result showed that NIPS increased the efficiency of TIPS of PCL solution. The hierarchical structure of the PCL monolith was significantly affected by the phase separation parameters including types of nonsolvent, ratio of solvent/nonsolvent, the CPCL and the Tps. Furthermore, the superhydrophilic PDA-PCL monolith was successfully obtained by PDA modification with one-step deposition method. This method of fabricating the superhydrophilic PDA-PCL monolith provided a more eco-friendly and facile technique with hierarchical porous structure, which might show a great potential in the application of tissue engineering and regenerative medicine.Conflicts of interest
There are no conflicts to declare.Acknowledgements
The authors acknowledge financial support from the Key Science &Technology Project for Institutions of Higher Education of Henan Province (No. 19B430010), Key R & D and Promotion Projects in Henan Province, the China 111 Project (D18023) and the Introducing Overseas Intelligence of Henan Province (CXJD2018003, HNGD2020011).References
- M. Sun, S. Huang, L. Chen, Y. Li and X. Yang, Chem. Soc. Rev., 2016, 45, 3479–3563 RSC.
- Y. Liu, D. Luo and T. Wang, Small, 2016, 12, 4611–4632 CrossRef CAS PubMed.
- Z. Chen, et al., J. Membr. Sci., 2020, 603, 118041 CrossRef CAS.
- S. D. Lacey, et al., Adv. Mater., 2018, 30, 1705651 CrossRef PubMed.
- Y. Xin, et al., Carbohydr. Polym., 2017, 157, 429–437 CrossRef CAS PubMed.
- S. A. Saba, M. P. Mousavi, P. Bühlmann and M. A. Hillmyer, J. Am. Chem. Soc., 2015, 137, 8896–8899 CrossRef CAS PubMed.
- X. Guo, et al., Biomacromolecules, 2020, 21, 1202–1213 CrossRef CAS PubMed.
- T. Xu, J. M. Miszuk, Y. Zhao, H. Sun and H. Fong, Adv. Healthcare Mater., 2015, 4, 2238–2246 CrossRef CAS PubMed.
- L. Alison, et al., Sci. Rep., 2019, 9, 1–9 CrossRef CAS PubMed.
- H. Mi, et al., ACS Appl. Mater. Interfaces, 2019, 11, 7479–7487 CrossRef CAS PubMed.
- L. Zhu, D. Luo and Y. Liu, Int. J. Oral Sci., 2020, 12, 1–15 Search PubMed.
- L. A. Smith, X. Liu and P. X. Ma, Soft Matter, 2008, 4, 2144–2149 RSC.
- S. M. Silverstein, Prog. Polym. Sci., 2014, 39, 199–234 CrossRef.
- A. Elhaj and K. Irgum, ACS Appl. Mater. Interfaces, 2014, 6, 15653–15666 CrossRef CAS PubMed.
- Y. Wang, et al., J. Hazard. Mater., 2018, 344, 849–856 CrossRef CAS PubMed.
- Q. Bai, Q. Xiong, C. Li, Y. Shen and H. Uyama, Cellulose, 2017, 24, 4275–4289 CrossRef CAS.
- A. Dobashi, J. Maruyama, Y. Shen, M. Nandi and H. Uyama, Carbohydr. Polym., 2018, 200, 381–390 CrossRef CAS PubMed.
- K. Okada, et al., Chem. Commun., 2011, 47, 7422–7424 RSC.
- G. R. Guillen, Y. Pan, M. Li and E. M. Hoek, Ind. Eng. Chem. Res., 2011, 50, 3798–3817 CrossRef CAS.
- T. Jin, Z. Zhao and K. Chen, J. Appl. Polym. Sci., 2016, 133, 42953 CrossRef.
- H. Matsuyama, Y. Takida, T. Maki and M. Teramoto, Polymer, 2002, 43, 5243–5248 CrossRef CAS.
- A. H. Ardekani-Zadeh and S. F. Hosseini, Carbohydr. Polym., 2019, 223, 115108 CrossRef PubMed.
- O. C. Onder, E. Yilgor and I. Yilgor, Polymer, 2018, 136, 166–178 CrossRef CAS.
- C. M. Hansen, Hansen solubility parameters: a user's handbook, CRC press, 2007 Search PubMed.
- C. Bordes, et al., Int. J. Pharm., 2010, 383, 236–243 CrossRef CAS PubMed.
- P. V. D. Witte, P. J. Dijkstra, J. W. A. V. D. Berg and J. Feijen, J. Membr. Sci., 1996, 117, 1–31 CrossRef.
- T. Alfrey, A. Bartovics and H. Mark, J. Am. Chem. Soc., 1942, 64, 1557–1560 CrossRef CAS.
- S. Liu, Z. He, G. Xu and X. Xiao, Mater. Sci. Eng., C, 2014, 44, 201–208 CrossRef CAS PubMed.
- J. Zhao, et al., Carbohydr. Polym., 2011, 83, 1541–1546 CrossRef CAS.
- M. Thommes, et al., Pure Appl. Chem., 2015, 87, 1051–1069 CAS.
- Q. Tu, et al., Colloids Surf., B, 2013, 102, 361–370 CrossRef CAS PubMed.
- D. Mondal, M. Griffith and S. S. Venkatraman, Int. J. Polym. Mater. Polym. Biomater., 2016, 65, 255–265 CrossRef CAS.
- M. Mirhosseini, V. Haddadi-Asl and S. S. Zargarian, J. Appl. Polym. Sci., 2016, 133, 43345 CrossRef.
- A. Gloria, et al., Biomacromolecules, 2012, 13, 3510–3521 CrossRef CAS PubMed.
- H. Lee, S. M. Dellatore, W. M. Miller and P. B. Messersmith, Science, 2007, 318, 426–430 CrossRef CAS PubMed.
Footnote |
| † Electronic supplementary information (ESI) available. See DOI: 10.1039/d0ra04687f |
| This journal is © The Royal Society of Chemistry 2020 |

