 Open Access Article
Long-range ferromagnetic order in perovskite manganite La0.67Ba0.25Ca0.08Mn(1−x)TixO3 (x = 0.00, 0.05 and 0.10)
Marwa Bourguibaab,
Mohamed Amara Gdaiem *c,
Moez Chafraa and
E. K. Hlild
aLaboratoire de recherche en Mécanique Appliquée et systèmes (LASMAP-EPT), Ecole Polytechnique de Tunisie, Université de Carthage, La Marsa, Tunisia
bFaculté des sciences de Tunis, Université de Tunis el Manar, Tunis 2092, Tunisia
cLaboratoire de la Matière Condensée et des Nanosciences, Département de Physique, Faculté des Sciences de Monastir, 5019, Tunisia. E-mail: gdaiem_mohamed@hotmail.fr; Tel: +21629523640
dInstitut Néel, CNRS et Université Joseph Fourier, BP 166, 38042 Grenoble, France
First published on 14th July 2020
Abstract
In this study, we report the effects of Ti on the critical behavior of La0.67Ba0.25Ca0.08MnO3 samples prepared by the flux method. Moreover, the critical exponents β, γ and δ are estimated through numerous techniques such as the modified Arrott plot, the Kouvel–Fisher method and critical isotherm analysis of the magnetic measurements on record near the Curie temperature. Compared to standard models, the estimated critical exponents are close to the theoretical values of the mean-field model for these samples. In order to estimate the spontaneous magnetization at a given temperature, we used a process based on the analysis, in the mean-field theory, of the magnetic entropy change (−ΔSM) vs. magnetization (M). An excellent agreement was found between the spontaneous magnetization determined from −ΔSM vs. M2 and the classical extrapolation from the Arrott curves (μ0H/M vs. M2), thus confirming that −ΔSM is a valid approach to estimate the spontaneous magnetization in this system. The accuracy of the critical exponent values was confirmed with the scaling hypothesis. The magnetization curves fall onto one of two sides, below and above TC.
1. Introduction
Hole-doped manganite perovskites La1−xAxMnO3 (A = Ca, Sr, and Ba) have attracted extensive attention. This is owing to their peculiar magnetic properties and their potential technological applications and in particular the discovery of colossal magnetoresistance (CMR) in recent years.1–5 For x = 0, the ground state compound of LaMnO3 is an insulating A-type canted antiferromagnetic (AFM) state with TN = 140 K.6 With Sr-doped lanthanum manganites, the magnetic properties highly depend on the content of x.7 The ferromagnetic (FM) materials generated by doped holes are attributed to the double exchange (DE) effect, in which eg electrons transfer between adjacent Mn3+ and Mn4+ ions, and to the Jahn–Teller effect.8 For x = 0.5, the compound with a tetragonal phase is characterized by an FM curie temperature (TC) TC = 310 K and undergoes a transition to the A-type AFM order at TN = 220 K.9 To further understand the FM–paramagnetic (PM) transition in the bulk material, M. Hazzez et al. calculated the critical exponents of La0.5Sr0.5MnO3 synthesized by a solid state reaction and showed that the transition is of a second order, corresponding to the mean-field model with critical exponents β = 0.507 and γ = 1.107, which is dominated by long-range interactions around TC.10 Recently, the lanthanum strontium manganites have been extensively studied on a nanoscale due to the potential applications in magnetic refrigeration, biomedicine and biological research.11–13 Numerous attempts have been made to investigate the magnetic nanoparticles for their interesting size effects and surface magnetism.14–16 As the particle size decreases, the surface and interface become more important due to the increased surface atoms/bulk atom ratio. The magnetic properties of nanomaterials are strongly influenced by the surface spins and may differ significantly from the bulk material properties. Therefore, it is very important to gain an understanding of the magnetic transition mechanism by investigating the critical behaviors of nano-sized compounds. In the present study, we study the effect of titanium on the critical behavior around the FM–PM phase transition for La0.67Ba0.25Ca0.08MnO3 samples. Moreover, the critical exponents β, γ and δ are estimated through numerous techniques such as the modified Arrott plot (MAP), Kouvel–Fisher (KF) method and critical isotherm (CI) analysis of the magnetic measurements near TC.2. Experimental details
In this study, our samples were prepared by the flux method. La2O3, BaCO3, CaCO3, MnO2 and TiO2 precursors, with high purity, were used. The mixture was ground in an agate mortar for 2 h with an appropriate quantity of KCl. Then, the powder was heated in an alumina crucible at 800 °C for 24 h. Further, it was washed with hot distilled water to remove the KCl salts. The residue was dried at 100 °C in air. After being ground well, the powders were pressed into circular pellets (e = 1 mm and d = 10 mm) at 105 Pa. The pellets were sintered in the air at 1000 °C for 24 h.Magnetization isotherms were measured in the range of 0–5 T and with a temperature interval of 3 K in the vicinity of TC. These isotherms are corrected by a demagnetization factor D that was determined by a standard procedure from low-field dc magnetization measurement at low temperatures (μ0H = μ0Happ − DM).
3. Scaling analysis
In order to clarify the nature of the FM–PM phase transition, deeper insight into the magnetic phase transition should be obtained by analyzing the critical region around TC. In general, the critical phenomena cannot define the first-order transition for because the magnetic field can affect the transition17 and create a discontinuity of the order parameter in the vicinity of the critical temperature. Based on the scaling hypothesis, the critical behavior of our samples, around TC, was studied using Arrott plots and the critical exponents. β is associated with MS just below TC, γ is related to the critical magnetization isotherm at TC, and δ is related to the initial magnetic susceptibility just above TC.18,19 As is known, four models can usually describe the magnetic interactions in manganites: the mean-field (β = 0.5, γ = 1.0 and δ = 3.0), tri-critical mean-field (β = 0.25, γ = 1.0 and δ = 5.0), three-dimensional (3D) Heisenberg (β = 0.365, γ = 1.336 and δ = 4.8) and 3D-Ising (β = 0.325, γ = 1.24 and δ = 4.82) models. This method was based on the equation of state:
 | (1) |
The exponent's equations from M measurements are given below:
| MS(T) = m0(−ε)β; T < TC, ε < 0 | (2) |
 | (3) |
| M(μ0H) = D(μ0H)1/δ; T = TC, ε = 0 | (4) |
Furthermore, in the critical region, M and the internal field should obey the universal scaling behavior, which can be written as:
 | (5) |
4. Results and discussion
Using the experimental M data obtained for all of the studied compounds, we determined MAP in order to better understand the nature of the transition around TC. These curves are obtained from the following equation:20
 | (6) |
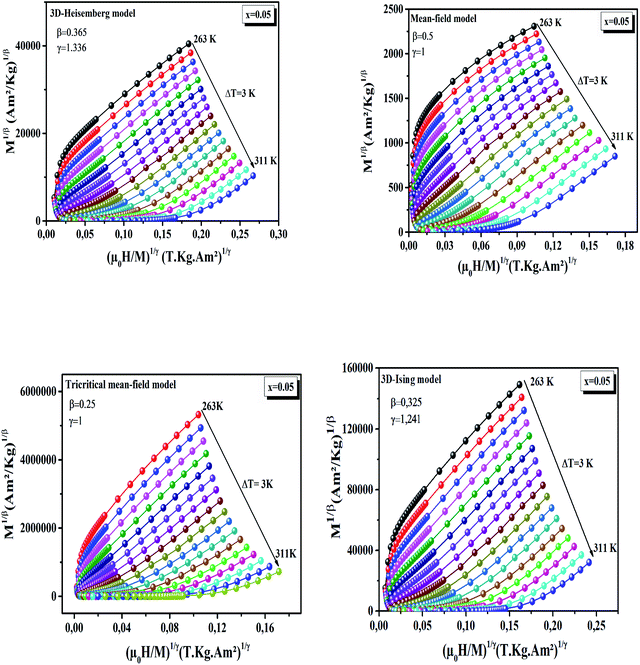
Fig. 1 shows M1/β vs. (H/M)1/γ based on the Arrott–Noakes equation of state eqn (6) at different temperatures for the x = 0.05 sample as an example, deduced by using trial critical exponents from several models: mean-field, 3D-Heisenberg, 3D-Ising and tri-critical mean-field. For this analysis, only the high-field linear region is used because at low magnetic fields the magnetic multi-domains are not totally aligned and the MAP deviates from linearity. It is evident in Fig. 1 that all of the models yield quasi-straight and nearly parallel lines in the high field region, making it difficult to decide which model is best to determine the critical exponent.
Thus, to confirm the best model to fit our experimental data, we calculated the so-called relative slope (RS) defined at the critical point as:
| RS = S(T)/S(TC) | (7) |
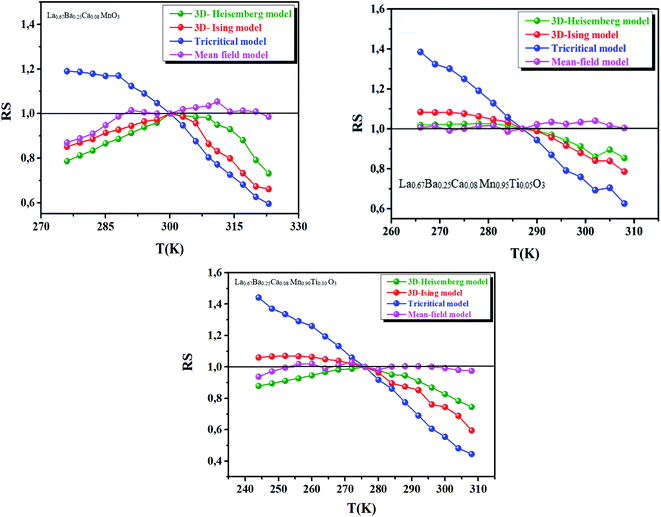 | ||
| Fig. 2 RS of our samples as a function of temperature defined as RS = S(T)/S(TC) using several methods. | ||
Fig. 3 shows the power law fittings of the temperature dependence of MS(T,0) and χ0−1(T,0). New values of β, γ and TC were obtained by fitting the plots of MS(T,0) and χ0−1 (T,0) with eqn (1) and (2), respectively. The results of the fits for our samples are also presented in the same figure and listed in Table 1. Subsequently, convergence was reached by the reasonable values of the critical parameters. These values are very close to the critical exponents of the mean-field model, as displayed in Table 1.
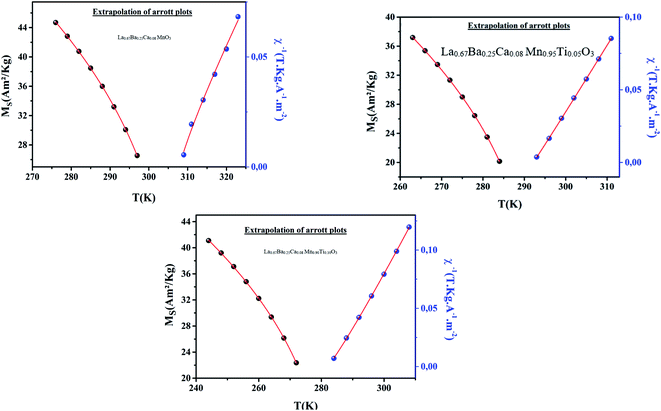 | ||
| Fig. 3 Temperature dependence of the spontaneous magnetization MS (T,0) (left) and the inverse initial susceptibility χ0−1(T) (right), with the fitting curves based on the power laws. | ||
| Samples | TC (K) | β | γ | δ | Ref. | |
|---|---|---|---|---|---|---|
| x = 0.00 | MAP | 301 | 0.48 | 1.06 | — | This work |
| KF | 304.15(5) | 0.47(5) | 1.13(3) | — | ||
| CI(exp) | 300 | — | — | 3.31(1) | ||
| CI(cal) | — | — | — | 3.37(8) | ||
| x = 0.05 | MAP | 291.17(8) | 0.45(4) | 1.02(0) | — | This work |
| KF | 291.69(3) | 0.46(1) | 1.03(0) | — | ||
| CI(exp) | 287 | — | — | 3.25(2) | ||
| CI(cal) | — | — | — | 3.23(4) | ||
| x = 0.10 | MAP | 280.08(4) | 0.48(8) | 1.09(8) | — | This work |
| KF | 279.99(2) | 0.478(8) | 1.12(5) | — | ||
| CI(exp) | 277 | — | — | 3.22(5) | ||
| CI(cal) | — | — | — | 3.33(9) | ||
| Mean field model | — | 0.5 | 1 | 3 | 30 | |
| 3D Heisenberg model | — | 0.365 | 1.336 | 4.80 | 30 | |
| 3D Ising model | — | 0.325 | 1.241 | 4.82 | 30 | |
| Tricritical model | — | 0.25 | 1 | 5 | 31 | |
| La0.67Ca0.33Mn0.95Fe0.05O3 | 162 | 0.552 | 1.024 | 2.801 | 32 | |
| La0.6Ca0.4MnO3 | 267.88 | 0.248 | 0.995 | 4.896 | 33 | |
| La0.67Ba0.33Mn0.98Ti0.02O3 | 310 | 0.551 ± 0.008 | 1.020 ± 0.024 | 2.851 | 34 | |
| La0.7Ca0.3Mn0.95Ti0.05O3 | 136 | 0.601 ± 0.02 | 1.171 ± 0.01 | 2.95 ± 0.01 | 35 | |
| La0.67Ba0.33MnO3 | 306 | 0.356 ± 0.004 | 1.120 ± 0.003 | 4.15 ± 0.05 | 36 | |
The third parameter ‘δ’ was determined precisely from M(TC, μ0H) at T = TC using eqn (4). We plotted these isotherms together with the log–log plot of M versus μ0H (inset of Fig. 4). As seen in the high-field region, the log–log plots are straight lines with the slope 1/δ. The critical exponents from this static scaling analysis are related to the Widom scaling relation δ = 1+ γ/β.23 Using this relation and the estimated values of γ and β (obtained above) from the mean-field method, we obtained results close to the values obtained from the critical isotherms. The estimated values of δ for all of the samples are given in Table 1. These values are consistent with the prediction of the mean-field theory (β = 0.5, γ = 1, and δ = 3).24
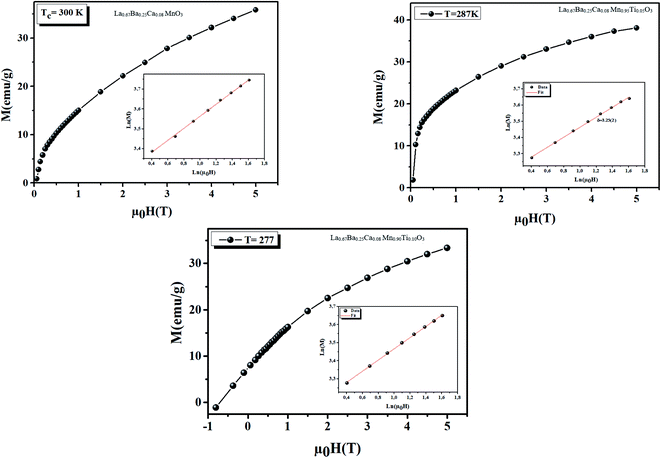 | ||
| Fig. 4 Isothermal M(TC, μ0H) plot for our samples at TC. The insets show the same plot in log–log scale for each sample, and the solid line is the linear fit following eqn (4) for the determination of the critical exponent δ. | ||
Another method to find the critical exponents and TC more accurately is the KF method, which is expressed in the following equations:25
 | (8) |
 | (9) |
The temperatures of  and
and  are shown in Fig. 5. The fit of these curves by eqn (8) and (9) leads to the determination of the critical exponents γ, β and TC. The obtained values for these exponents are summarized in Table 1. Noticeably, these values are also in a good agreement with those obtained from MAP.
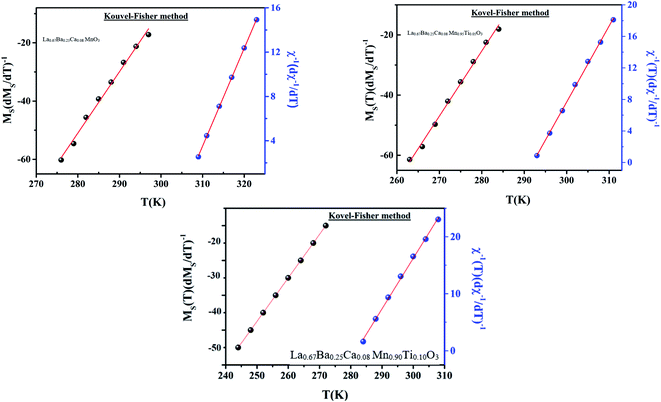 | ||
| Fig. 5 KF plots for the spontaneous magnetization (left) and the inverse initial susceptibility χ0−1(T) (right) for our samples. | ||
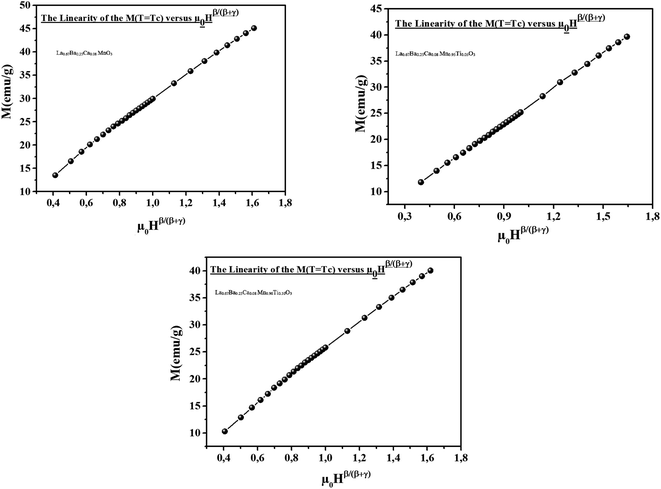
The Widom relationship was tested by plotting M(T = TC) versus (μ0H) β/(β+γ) and checking the linearity of the curve, as shown in Fig. 6.
The reliability of the critical exponents determined experimentally can be verified using a more rigorous method18 based on the prediction of the scaling hypothesis in the critical region, through which the applied magnetic field μ0H and M can be related in the vicinity of TC by eqn (5). Fig. 7 shows that for each compound, two universal curves are obtained: the first one for temperature values below TC and the second one for temperature values above TC. Hence, the critical exponents and the critical temperature TC agreed well with the scaling hypothesis.
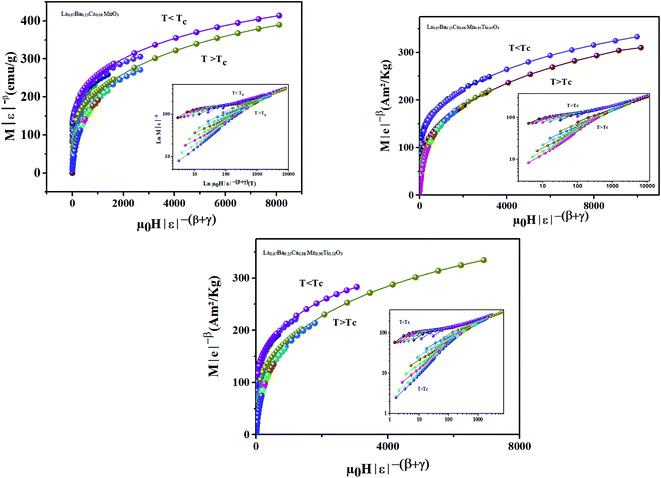 | ||
| Fig. 7 Scaling plots M|ε|−β vs. μ0H|ε|−(β+γ), indicating two universal curves below and above TC for our samples. Inset shows the same plots on a log–log scale. | ||
In addition, in homogeneous magnets and based on the renormalization group analysis of systems performed by Fisher et al., the universality class of the magnetic phase transition depends strongly on the range of the exchange interaction, as described by the following equation:26
| J(r) = 1/rd+σ | (10) |
For a three-dimensional material (d = 3), the relationship is J(r) = 1/r3+σ with 3/2 ≤ σ ≤ 2. In general, if J(r) decreases faster than r−5 (r greater than 2), the Heisenberg exponents (β = 0.365, γ = 1.336 and δ = 4.8) are valid for a 3D-isotropic ferromagnet. However the MF-theory (β = 0.5, γ = 1.0 and δ = 3.0) exponents are valid for σ < 1/2 if J(r) decreases with the “long-range” distance slower than r−4.5. In the intermediate range, if 1/2 < σ < 2, the exponents belong to other universality classes (such as the TMF theory and the 3D-Ising model). In the case of our samples, the values of the critical exponents are in agreement with the mean-field model. Consequently, (d + σ) will be smaller than 4.5, and the exchange interaction J(r) drops slower than r−4.5 for our samples.
The following section shows an attempt to do theoretical modeling of MS based on the mean-field analysis of −ΔSM.27 A general result issued from the mean-field theory reveals the dependence of −ΔSM on the relative M is described as:28,29
 | (11) |
For small M values, eqn (11) can be performed using a power expansion, and −ΔSM is proportional to M2:
 | (12) |
Moreover, below TC, the material produces MS. For this reason, the state r = 0 is never reached. If we consider only the first term of expansion of eqn (12), it is equivalent to:
 | (13) |
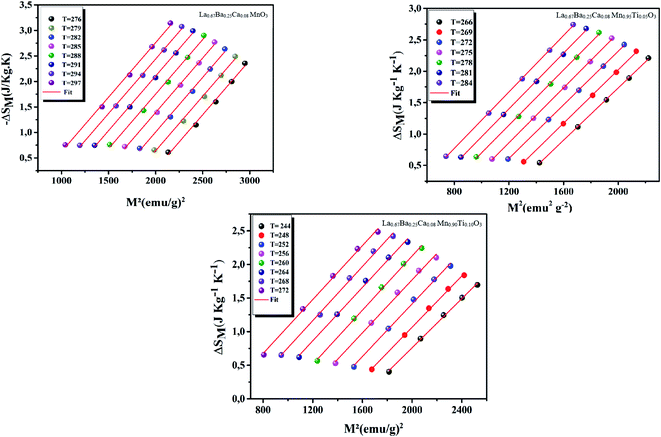
Eqn (13) proves that the −ΔSM curve with respect to M2 has a linear variation.
As seen in Fig. 8, all the curves at different temperatures (266–284 K) respect the same regularities and a clear linear variation with a nearly constant slope (0.0034), indicating that it is appropriate to analyze the current experimental results with the mean-field theory. MS(T) is then estimated from the linear adjustments of the −ΔSM curve with respect to the M2 curve at different temperatures, as shown in Fig. 9. We can see that as the temperature decreases, MS becomes larger and larger, suggesting that the compound is close to a state of rotational order at lower temperatures. The excellent agreement between the two methods confirms the validity of this process for estimating the MS magnetization value using the mean-field analysis of −ΔSM in our systems.
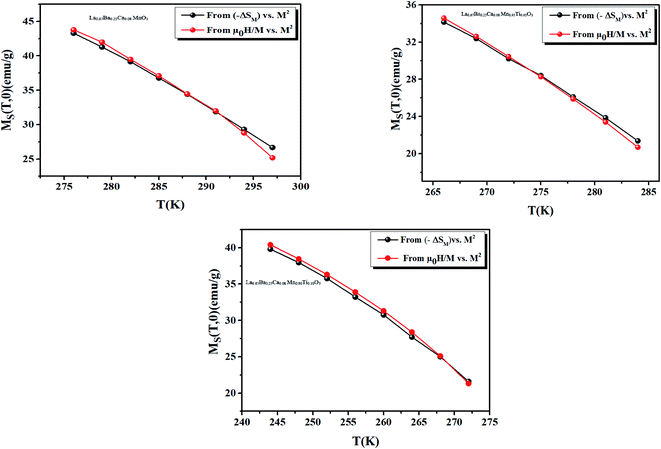 | ||
| Fig. 9 Spontaneous magnetization of our samples deduced from the extrapolation of the isothermal −ΔSM vs. M2 curves and from the Mean-Field results. | ||
5. Conclusion
In summary, we have used magnetization measurements to study the critical phenomena at temperatures around the PM–FM phase transition in La0.67Ba0.25Ca0.08Mn(1−x)TixO3 (x = 0.00, 0.05 and 0.10) samples. The critical exponents (β, γ and δ) were obtained based on various research techniques including MAP, the KF method, and CI analysis. The estimated critical exponents confirm that the experimental values agree well with the mean-field model for our samples. The field and temperature dependent M follows the scaling theory, and all of the data fall on two distinct branches, one for T < TC and another for T > TC, indicating that the critical exponents obtained in this work are accurate.Conflicts of interest
There are no conflicts to declare.References
- E. O. Wollan and W. C. Koehler, Phys. Rev., 1955, 15, 545 CrossRef.
- Y. M. Choi, M. C. Lin and M. L. Liu, Angew. Chem. Int. Ed., 2007, 46, 7214–7219 CrossRef CAS PubMed.
- J. M. Liu, Q. Huang, J. Li, C. K. Ong, Z. C. Wu, Z. G. Liu and Y. W. Du, Phys. Rev. B: Condens. Matter Mater. Phys., 2000, 62, 8976–8982 CrossRef CAS.
- O. Chmaissem, B. Dabrowski, S. Kolesnik, J. Mais, J. D. Jorgensen and S. Short, Phys. Rev. B: Condens. Matter Mater. Phys., 2003, 67, 094431 CrossRef.
- A. M. Haghiri-Gosnet and J. P. Renard, J. Phys. D: Appl. Phys., 2003, 36, R127–R150 CrossRef CAS.
- E. O. Wollan and W. C. Koehler, Phys. Rev., 1955, 15, 545 CrossRef.
- O. Chmaissem, B. Dabrowski, S. Kolesnik, J. Mais, J. D. Jorgensen and S. Short, Phys. Rev. B: Condens. Matter Mater. Phys., 2003, 67, 094431 CrossRef.
- C. Zener, Phys. Rev., 1951, 81, 403–405 CrossRef.
- Z. JiráHk, J. Hejtmánek, K. Knizek, M. Marysko, V. Sima and R. Sonntag, J. Magn. Magn. Mater., 2000, 217, 113–119 CrossRef.
- M. Hazzez, N. Ihzaz, M. Boudard and M. Oumezzine, Phys. B, 2015, 468–469, 39–44 CrossRef CAS.
- M. Kumaresavanji, C. T. Sousa, A. Pires, A. M. Pereira, A. M. L. Lopes and J. P. Araujo, Appl. Phys. Lett., 2014, 105, 083110 CrossRef.
- M. Kačenka, O. Kaman, Z. Jirák, M. Maryško, P. Veverka, M. Veverka and S. Vratislav, J. Solid State Chem., 2015, 221, 364–372 CrossRef.
- H. Baaziz, A. Tozri, E. Dhahria and E. K. Hlil, Chem. Phys. Lett., 2015, 625, 168–173 CrossRef CAS.
- D. L. Leslie-Pelecky, Chem. Mater., 1996, 8, 1770–1783 CrossRef CAS.
- T. Tajiri, H. Deguchi, S. Kohiki, M. Mito, S. Takagi, M. Mitome, Y. Murakami and A. Kohno, J. Phys. Soc. Jpn., 2008, 77, 074715 CrossRef.
- Z. H. Wang, T. H. Ji, Y. Q. Wang, X. Chen, R. W. Li, J. W. Cai, J. R. Sun, B. G. Shen and C. H. Yan, J. Appl. Phys., 2000, 87, 5582–5584 CrossRef CAS.
- M. Abassi, Z. Mohamed, J. Dhahri and E. K. Hlil, J. Alloys Compd., 2016, 664, 657–663 CrossRef CAS.
- H. E. Stanley, Rev. Mod. Phys., 1999, 71, S358 CrossRef CAS.
- S. Rößler, U. K. Rößler and K. Nenkov, et al., Phys. Rev. B, 2004, 70, 104417 CrossRef.
- A. Arrott and J. E. Noakes, Phys. Rev. Lett., 1967, 19, 786e789 CrossRef.
- J. Fan, L. Ling, B. Hong, L. Zhang, L. Pi and Y. Zhang, Phys. Rev. B: Condens. Matter Mater. Phys., 2010, 81, 144426 CrossRef.
- L. Xu, J. Fan, Y. Shi, Y. Zhu, K. Barner, C. Yang and D. Shi, Europhys. Lett., 2015, 112, 17005 CrossRef.
- J. Engels, S. Holtmann, T. Mendes and T. Schulze, Phys. Lett. B, 2000, 492, 219 CrossRef CAS.
- J. Yang, Y. Lee and Y. Li, Phys. Rev. B: Condens. Matter Mater. Phys., 2007, 76, 054442 CrossRef.
- M. A. Gdaiem, A. Dhahri, J. Dhahri and E. K. Hlil, RSC Adv., 2017, 7, 10928–10938 RSC.
- J. S. Fisher, S. K. Ma and B. G. Nickel, Phys. Rev. Lett., 1972, 29, 917–920 CrossRef.
- J. S. Amaral, N. J. O. Silva and V. S. Amaral, J. Magn. Magn. Mater., 2010, 322, 1569 CrossRef CAS.
- Y. I. Spichkin and A. M. Tishin, J. Alloys Compd., 2005, 403, 38–44 CrossRef CAS.
- L. Xu, J. Fan, Y. Zhu, Y. Shi, L. Zhang, L. Pi, Y. Zhang and D. Shi, Mater. Res. Bull., 2016, 73, 187–191 CrossRef CAS.
- S. N. Kaul, J. Magn. Magn. Mater., 1985, 53, 5 CrossRef CAS.
- K. Huang, Statistical Machanics, New York, 2nd ed. Wiley, 1987 Search PubMed.
- P. Nisha, S. Savitha Pillai, D. Azad, M. R. Varma, K. G. Suresh and H. Hahn, Mater. Chem. Phys., 2012, 136, 66 CrossRef CAS.
- M. Nasri, M. Triki, E. Dhahri and E. K. Hlil, J. Alloys Compd, 2013, 546, 84 CrossRef CAS.
- M. Oumezzine, O. Peña, S. Kallel and S. Zemni, Solid State Sci., 2011, 13, 1829 CrossRef CAS.
- A. Berger, G. Camopillo, P. Vivas, J. E. Pearson, S. D. Bader, E. Baca and P. Prieto, J. Appl. Phys., 2002, 91, 8393 CrossRef CAS.
- N. Mautis, I. Panagiotopoulos, M. Pissas and D. Niarchos, Phys. Rev. B: Condens. Matter Mater. Phys., 1999, 59, 1129 CrossRef.
| This journal is © The Royal Society of Chemistry 2020 |

