 Open Access Article
PDMPO: a specific silicon or silica, pH sensitive fluorescent probe?
Patricia Merdy*a,
Cyril Neytarda,
Jean-Dominique Meunierb and
Yves Lucas a
a
aUniversité de Toulon, Aix Marseille Univ., CNRS, IM2NP, 83041 Toulon Cedex 9, France. E-mail: merdy@univ-tln.fr
bCEREGE, CNRS, Aix-Marseille University, IRD, INRAE, 13545 Aix-en-Provence, France
First published on 21st August 2020
Abstract
In order to understand Si behavior and biodisponibility in soils and plants, we evaluated the use of PDMPO (2-(4-pyridyl)-5-((4-(2-dimethylaminoethylaminocarbamoyl)methoxy)phenyl)oxazole) that was supposed to be a Si-specific fluorescence marker and to have a pH-dependent fluorescence. We studied the interactions between PDMPO and water-dissolved Si, Al and natural organic matter (humic acids, HA). Six systems with different HA, Si and Al concentrations were studied by fluorescence spectroscopy at pH 4, 7 and 9. The Al–PDMPO complex was characterized by infrared spectroscopy and the particle size distribution in solution was characterized by nano tracking analysis. We found that when usual pH buffers are not present, the PDMPO fluorescence was not pH dependent and was not Si-specific. In the PDMPO–Si–HA system, the PDMPO fluorescence signals were greatly enhanced, suggesting the formation of highly fluorescent ternary HA–PDMPO–Si groups. When Al was added to the system, the fluorescence was strongly quenched, suggesting the formation of low-fluorescence quaternary HA–PDMPO–Si–Al groups. The PDMPO fluorescence is therefore greatly sensitive to complexable metals and to natural organic matter and is therefore difficult to be applied for the quantification of Si or pH in a complex medium.
1 Introduction
Although silicon is in weight percent the second most abundant element of Earth's crust after oxygen and is an essential nutriment for numerous organisms, its behaviour in the environment and in living organisms is still the subject of numerous studies. The interest in the mechanisms of biomineralization is largely motivated by the desire to control the nanoscale properties of bio-inspired materials.1,2 In the environment, the long-standing interest in the interaction between the carbon cycle and the silicon cycle has not waned3 and there are now many questions about silicon as a nutrient for plants, therefore potentially as a fertilizer,4 and about the behaviour of silicon in soils and rivers. While dissolved silica was considered not to interact with natural organic matter (NOM), there is more and more evidence of Si–NOM interactions having a strong biogeochemical impact.5Therefore, studying the molecular interactions of dissolved or precipitated silica with biological compounds remains of great interest. In the environment, Si is abundant in the solid phase. SiO2 represents approximately 50 to 70% of the mass of the soils, in quartz mineral (SiO2) and in various forms of aluminosilicate.6 These compounds, however, are generally not very soluble and have a low bioavailability.7 In the liquid phase, dissolved Si is mainly in the form of monosilicic acid (H4SiO4), which is the dominant hydroxylated Si species in aqueous solutions between pH 2 and pH 9.8.8 When the concentration of dissolved Si in aqueous solution exceeds ≈10−3 mol L−1, polymerization of Si can occur in very varied forms depending on the species and nanoparticles particles present in solution.9 Because of their affinity with hydroxylated Si species, Al species greatly impact the outcome of precipitation.6 The relationships between dissolved Si and natural organic compounds is the subject of discussion, some studies showing the apparent absence of stable complexes in low acidic media,10 other showing the opposite in alkaline media.11 The array of possible reactions, particularly with natural organic matter, that impact Si bioavailability makes it necessary to monitor the precipitation of silicate species in natural solutions.
Among the many techniques that can be used, fluorescence is particularly advantageous if a specific Si-probe is available. It is a simple technique to implement, it is quantitative and, coupled with microscopy, it allows the visualization of the silica precipitation sites. PDMPO (2-(4-pyridyl)-5-((4(2-dimethylaminoethylaminocarbamoyl)-methoxy)phenyl)oxazole) has been widely used for this purpose.12 It was first developed to monitor the pH in live cells,13 then was found to be an excellent probe to visualize silica precipitation in cells by enhancing 7 times fluorescence when complexed on silica surface, likely through the terminal pyridine or amine groups.14
In this context, our objective was to evaluate the silicon specificity of the PDMPO in aqueous solution and its behaviour in the presence of Al and natural organic matter. We also sought to clarify the contradictions between the results obtained by 3 important studies about the fluorescence of PDMPO in aqueous media.12–14 These authors observed two main peaks, one around 450 and the other around 540 nm, whose intensity ratio changed with pH. This property would allow pH monitoring in a given media. The differences obtained between the 3 studies (Fig. 1), however, must be explained.
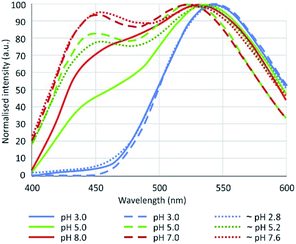 | ||
| Fig. 1 Fluorescence emission of PDMPO in water according to Diwu et al.13 (plain lines, λex = 360 nm), Shimizu et al.14 (dashed lines, λex = 338 nm), Parambath et al.12 (dotted lines, λex = 360 nm). | ||
To achieve our objectives, we studied the change in the fluorescence of PDMPO at controlled pH in aqueous solutions containing amounts of Si and Al ranging from 10−7 to 10−2 mol L−1 and natural organic matter in the form of Humic Acid (HA).
2 Material and methods
2.1 PDMPO solutions
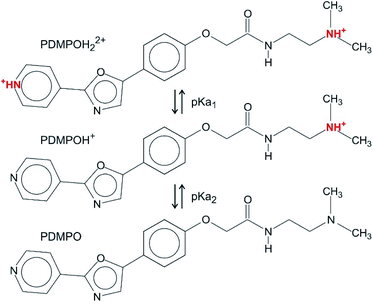
In the pH range chosen (between 4 and 9), there are three dominant forms of PDMPO (Scheme 1): PDMPOH22+ (pKa1 = 4.9), corresponding to the protonation of both the pyridine group and the terminal amine; PDMPOH+ (pKa2 = 6.8), corresponding to the protonation of the terminal amine; neutral PDMPO.12 The PDMPO was purchased from Interchim (Montluçon, France) as a powder or from Thermo-Fisher (LysoSensor1 Yellow/Blue DND-160, Illkirch, France) as 1 mM solution in dimethyl sulfoxide (DMSO) solvent. A 21.7 μM PDMPO solution in DMSO was obtained either by diluting the 1 mM stock solution or dissolving the PDMPO powder. The pH of the solution was fixed at 4.0, 7.0 and 9.0 ± 0.1 by the addition of sodium hydroxide stock solutions (Sigma-Aldrich) or hydrochloric acid (Trace Metal Grade 37%, (V/V), Thermo-Fisher). The mixture was stored in amber glass vials.2.2 Sample preparation
Si and Al 1 M solutions were prepared by dissolving in ultra-pure water sodium silicate Na2SiO3 (Alfa Aesar) and aluminium nitrate Al(NO3)3 (MERCK), respectively. Because the Na2SiO3 and Al(NO3)3 solutions were very basic and very acidic, respectively, Si and Al remained soluble in the form of H2SiO42− and Al3+ species, respectively. A series of solutions of 146 samples was prepared so that the final concentration of PDMPO was 1 μM at pH 4.0, 7.0 and 9.0 ± 0.1. The pHs were adjusted by NaOH or HCl solutions, that were preferred to usual buffers in order to avoid any impact on the fluorescence signal. Stock solutions of humic acid (HA) powder (Alfa Aesar, VWR) were diluted in distilled water to obtain a concentration of 1 g L−1.Different concentrations of Na2SiO2 and Al(NO3)3 ranging from 10−1 to 10−7 μM were tested in the presence and in the absence of 120 mg L−1 humic acid (HA), in order to have 6 different systems: PDMPO, PDMPO–Si, PDMPO–Al, PDMPO–Al–Si, PDMPO–Si–HA, PMDPO–Al–Si–HA. A seventh system, Si–HA without PDMPO, was studied for comparison. All the experiments were duplicated in polypropylene bottles.
Sometimes particle precipitation was observed (Table 1), so the solutions were filtered with a 0.2 μm PES syringe filter before fluorescence analysis. Depending on its kinetics, particle precipitation may however have occurred between filtration and fluorescence analysis.
| Si or Al (mol L−1) | System | ||||||||||||||
|---|---|---|---|---|---|---|---|---|---|---|---|---|---|---|---|
| PDMPO–Si | PDMPO–Al | PDMPO–Al–Si | PDMPO–Si–HA | PDMPO–Al–Si–HA | |||||||||||
| pH | pH | pH | pH | pH | |||||||||||
| 4 | 7 | 9 | 4 | 7 | 9 | 4 | 7 | 9 | 4 | 7 | 9 | 4 | 7 | 9 | |
| 10−1 | X | X | X | — | — | — | — | — | — | — | — | — | — | — | — |
| 10−2 | X | X | X | X | X | X | X | X | X | ||||||
| 10−3 | X | X | X | X | X | X | X | X | |||||||
| 10−4 | X | X | X | X | X | ||||||||||
| 10−5 | X | ||||||||||||||
| 10−6 | — | — | — | — | — | — | |||||||||
| 10−7 | — | — | — | — | — | — | |||||||||
2.3 Molecular fluorescence analysis
The measurements were performed with a Hitachi model F-4500 spectrophotometer. The samples were diluted to avoid inner filter effect. At each excitation wavelength, the fluorescence intensity at the emission wavelengths was measured to obtain 3D excitation–emission fluorescence matrices (EEFM). The excitation window was set to 5 nm and the emission window to 10 nm. The excitation wavelengths were scanned from 200 nm to 500 nm, and the emission wavelengths from 250 nm to 600 nm, with a 5 nm step for both emission and excitation at a scanning speed of 2400 nm min−1. The photomultiplier was set to 700 V. The obtained spectra were processed to remove the Rayleigh scattering bands using the Matlab software.For each system and at each pH we performed between 5 and 8 measurement series, each series beginning with the PDMPO only as a reference. The maximum intensity at λex = 330 nm of the 460 nm and the 510 nm peaks was normalized to the signal of the PDMPO only. We then calculated the average and the standard deviation for each condition, an example is given on Fig. 2.
2.4 FTIR analysis
The samples were prepared in DMSO, concentrations were 10−6 and 10−2 mol L−1 for PDMPO and Al, respectively. IR absorption spectra were measured after transmission of the incident beam through the liquid sample placed between two NaCl tablets using a JASCO FT/IR-410 spectrometer. Spectra were recorded between 400 and 4000 cm−1 with 1 cm−1 steps. The DMSO spectrum was subtracted from sample spectra to visualize the bands of interest in our systems.2.5 Particle size distribution analysis
The size distribution was measured by Nano Tracking Analysis (NTA) using a NS500 Malvern apparatus. NTA analysed particle-by-particle motion in the liquid by relating the rate of Brownian motion to the particle size.15 The samples required no specific preparation.3 Results and discussion
3.1 PDMPO alone
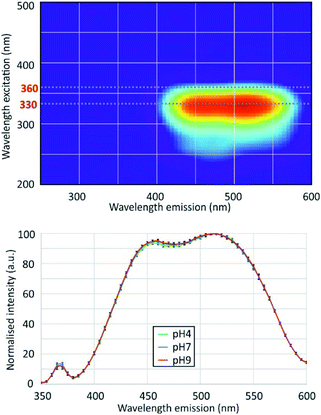
EEFM at pH 4 and emission spectra at λex = 330 nm obtained at pH 4.0, 7.0 and 9.0 are shown in Fig. 3. The PDMPO exhibited dual emission spectral peaks at 455 nm and 510 nm, the optimum excitation wavelength was λex = 330 nm. The emission spectra at λex = 330 nm was not dependent on pH. These results differ from those given in the three studies cited above,12–14 the main differences are summarized on Table 2. Our 330 nm optimum excitation wavelength is slightly different from that used by Diwu et al.13 (338 nm), but very different from that used by Shimizu et al.14 and Parambath et al.12 (360 nm). This last value would correspond in our study to an edge of the fluorescence signal where the fluorescence intensity is no more than 40% of the peak maximum intensity (Fig. 3). There are slight differences between studies in maximum emission peaks in the blue and green domain; the main difference is that, unlike other studies, we did not observe any variations in the ratio of green and blue peak intensity. This discrepancy can be due to the buffer used to control the pH. As early as 1964, studies16 showed that an increase of phosphate concentration frequently leads to a drop of the fluorescence intensity. For example, phosphate ions quench both indole and phenol fluorescence and the type of anion has an effect: HPO42− quenches more phenol than H2PO4−, for indole the mono-anion is more effective; phosphate can even been quantified by its effect on organic fluorescence probes.17 Considering the citrate buffer, the citric acid can perform an electrophilic attack of the pyridine group or the amine group of the PDMPO, depending on the pH.14| Study | Optimum λex (nm) | Maximum emission peaks (nm) | pH dependence | pH control | |
|---|---|---|---|---|---|
| Blue | Green | ||||
| This study | 330 | 455 | 510 | No | NaOH, HCl |
| Diwu et al.13 | 360 | 464 | 542 | Yes | K-phosphate buffer |
| Shimizu et al.14 | 338 | 450 | 534 shifting with pH | Yes | Na-phosphate buffer |
| Parambath et al.12 | 360 | 454 shifting with pH | 544 shifting with pH | Yes | Citrate and phosphate buffers |
3.2 PDMPO–Si system
3D-fluorescence spectra (EEFM) were recorded at the three different pH (4, 7 or 9) for the PDMPO–Si systems, with Si concentrations ranging from 0 to 10−1 M. The crude results for pH 4 (Fig. 4) show that the emission and excitation wavelengths at fluorescence maxima remained unchanged; the intensity only varied depending on Si concentration. We found the same behaviour at pH = 7 and pH = 9, no variation in emission/excitation peak wavelength but just varying maximum emission intensities. These results tend to show that (i) the nature of the complex formed between PDMPO and Si was the same, whatever the concentration and the pH and (2) the Si complexation on PDMPO sites induced intensity variations of the ligand. To better visualize these variations, Fig. 5 shows the maximum emission fluorescence intensities a function of the Si concentrations and as a function of pHs at λem = 510 nm; the same behaviour was found at λem = 460 nm.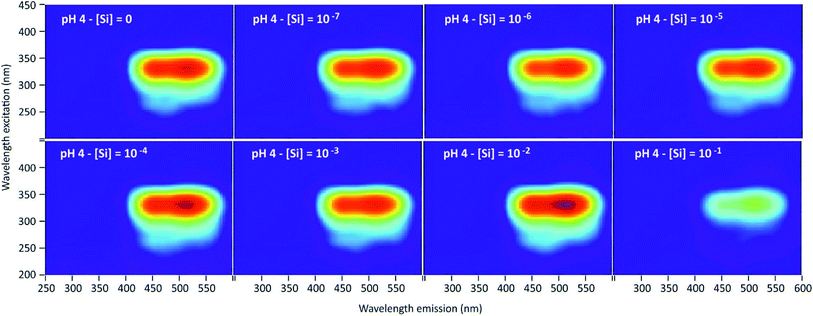 | ||
| Fig. 4 Examples of 3D-fluorescence spectra obtained at different Si concentrations and pH = 4 for the PDMPO–Si system. | ||
 | ||
| Fig. 5 Fluorescence intensity at λex = 330 nm, λem = 510 nm of the PDMPO–Si system at various pH as a function of the concentration of Si in mol L−1. | ||
An enhancement of the fluorescence signal as Si concentration increased was observed at each of the 3 studied pH. Shimizu et al.14 observed an enhancement as well at pH ranging from 3 to 7. At pH 4, fluorescence enhancement was small, but significant at Si concentration equal or higher than 10−7 mol L−1. At pH 7 and 9, it was significant at Si concentration equal or higher than 10−4 mol L−1 or higher. At Si concentrations higher than 10−2 mol L−1, there was at pH 4 a great dispersion of the fluorescence intensities values and at pH 7 a fluorescence quenching.
Fluorescence enhancement at Si concentrations lower than 10−4 indicates the existence of a bond between the dye and dissolved silicon that modify the PDMPO vibrational state. At all the studied pH, H4SiO4 is the main dissolved silicon species, more abundant by at least two orders of magnitude compared to other possible species at pH 4 or 7 and one order of magnitude at pH 9 (Fig. 6). The difference between pH 4 and other pHs is the protonation of the pyridinium moiety. It is thus likely that, at pH 4, a proton is shared between the pyridinium moiety and an oxygen of the H4SiO4 tetrahedra.
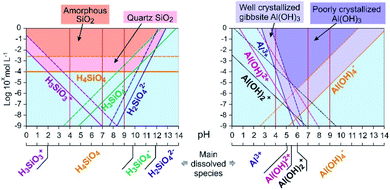 | ||
| Fig. 6 Dissolved species concentration at equilibrium and precipitation domains in aqueous solution for Si (left) and Al (right) at 25 °C. Calculation was done using the MINTEQ database values.18 Plain lines: species at equilibrium with well crystallized minerals; dashed lines: species at equilibrium with poorly crystallized or amorphous minerals. Vertical red plain lines mark the studied pHs. | ||
The dispersion of the fluorescence intensity values or fluorescence quenching at high Si concentration (10−1 mol L−1) was likely due to Si precipitation as amorphous silica (Table 1). According to Shimizu et al.,14 silicic acid polymerization occurred as they observed it with molybdate method, whatever the presence or absence of PDMPO. The threshold limit mentioned for Si polymerization was 2.10−3 M at pH = 6. Thermodynamic considerations (Fig. 6) confirmed that silica precipitation occurs at Si concentration equal to 10−2 mol L−1. At such concentration, however, the precipitation kinetics is likely too slow to be visually noticeable. At higher concentration, significant quantity of silica particles can adsorb PDMPO species, likely by sharing a proton from a siloxyde group.12
Results from the NTA analysis are given on Fig. 7. The PDMPO alone exhibited a peak around 47 nm that represents around 9% of the PDMPO introduced in the solution which was therefore organized in nanoparticles. In the PDMPO–Si systems, a higher and sharper peak around 45 nm corresponds to the same quantity of PDMPO but indicates another organization, therefore due to PDMPO–Si interaction.
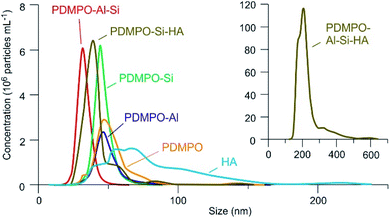 | ||
| Fig. 7 Nanoparticle size distribution in the studied systems at pH 9. The two graphs axis have the same units. | ||
3.3 PDMPO–Al system
As in the PDMPO–Si system, the emission and excitation wavelengths corresponding to the fluorescence maximum remained unchanged with pH or Al concentration, when the fluorescence intensity varied, depending on the conditions. Fig. 8 shows the maximum emission fluorescence intensities as a function of the Al concentrations and as a function of pH at λem = 510 nm; the same behaviour was found at λem = 460 nm. This behaviour of the PDMPO–Al system was very similar to that of the PDMPO–Si system, the main difference being a higher enhancement at high concentration (10−2 mol L−1), where precipitation of Al minerals was observed (Table 1). | ||
| Fig. 8 Fluorescence intensity at λex = 330 nm, λem = 510 nm of the PDMPO–Al system at various pH as a function of the concentration of Al in mol L−1. | ||
The fluorescence enhancement at Al concentrations lower than 10−4 at pH 4 and 7 indicates the existence of a bond between the dye and dissolved Al that modify the PDMPO vibrational state. The bond type and location on PDMPO may not be the same as for Si, due to the difference of structure of the adsorbed species (Fig. 6). At pH 4, the main dissolved Al specie is hydrated Al3+ whose first coordination shell is octahedral.19 At pH 7 and 9, it is the hydroxylated Al(OH)4− whose first coordination shell is tetrahedral.20 The particle size distribution in the PDMPO–Al system (Fig. 7) is like that of the PDMPO alone and different from that of the PDMPO–Si system, which would confirm a different bond type and location on PDMPO.
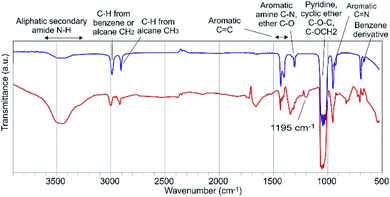
Although they were performed in a non-aqueous solvent, the results of the IR experiments gave information on the possible PDMPO–Al bond (Fig. 9). The PDMPO bands that were significatively altered when Al was added to the system relate to the ether C–O bonds and to the neighbouring amide N–H bond, which suggests that Al3+ bonds to the amide oxygen and possibly chelates the ether oxygen. Detailed studies performed on Al bonds with organic compounds with functional groups comparable to the PDMPO showed that Al binds to ketone oxygen rather than to the pyridine nitrogen.21 The new band that appeared at 1195 cm−1 can represent the offset of the C–O band which was at 1313 cm−1 in the PDMPO spectrum, this showed the existence of R–O–R′ groups.
Whatever the nature of the complex, there is a strong interaction between the Al species in solution and the PDMPO. These results showed that the PDMPO is not a Si-specific ligand. This consideration can be extrapolated to all other dissolved metal species which have a behaviour close to that of Al towards organic ligands.22 It seems indeed difficult to find a specific ligand that would exclusively binds to Si since any kind of functional group present in a molecule that would be able to bind Si would probably be even more inclined to bind other elements.
3.4 PDMPO–Al–Si system
As in the previous systems, the results were identical for λem = 510 nm and λem = 460 nm. Results given on Fig. 10 showed for pH 4 and 7 a poor reproducibility of the measurements from one experiment to another, resulting in average variations which for the most part appears as non significant. A small but significant fluorescence quenching, however, was observed at pH 7 and 9 with Si and Al concentrations equal to 10−6 or 10−5 mol L−1. | ||
| Fig. 10 Fluorescence intensities at λex = 330 nm, λem = 510 nm of the PDMPO–Al–Si system at various pH as a function of the concentration of Al and Si in mol L−1. | ||
The fact that the fluorescence of PDMPO was neither enhanced nor quenched indicates that neither Si nor Al interacted with it, therefore that they interacted with each other, or that they both interacted with PDMPO in a way that neutralized their respective effects. Although precipitation has not been visually observed at Al and Si concentrations lower than 10−3 and 10−4 mol L−1 for pH 7 and 9, respectively, thermodynamic data showed that solutions were oversaturated with regard to kaolinite over 10−7 mol L−1 at pH 7 and 9 and over 3 10−5 mol L−1 at pH 4. Aluminosilicate species and oligomers can form before suspended particles are visible in the solution.20 The observed dispersion of the fluorescence intensity measurements can be related to uncontrolled kinetics of mineral particles precipitation. The particle size distribution (Fig. 8) showed a peak like that of the PDMPO–Si system, but centered on smaller particles, around 32 nm, when the peak of the PDMPO alone system disappeared. This result shows a probable interaction between PDMPO and both Al and Si.
3.5 PDMPO–Si–HA system
The 3D-fluorescence spectra were different from the previous systems, due to the specific fluorescence property of the humic substances (Fig. 11). The two main fluorophores that have been observed are typical of the humified organic matter. One is the fulvic type (λex = 290 nm, λem = 490 nm, peak A) and the other is the humic type (λex = 450 nm, λem = 515 nm, pic C).23 Here we note the disappearance of the PDMPO peaks in all 3D-spectra, which could be explained by the complexation of HA with PDMPO. HA would therefore play a role in quenching the fluorescence of PDMPO and would be in competition with silicon to complex the PDMPO. | ||
| Fig. 11 Examples of 3D-fluorescence spectra obtained at pH = 9 and for different Si concentrations for the PDMPO–Si–HA system. A and C, see text. | ||
Fig. 12 show the effects of adding Si on the fluorescence signal at the same emission/excitation wavelengths as before. The fluorescence intensities of the Si–HA system without PDMPO are also given for comparison. In both systems, results were similar for the A and C peaks of HA. At pH 4, there were no significant variations of fluorescence intensities in the PDMPO–Si–HA system, when it was observed a significant quenching of the HA fluorescence in the Si–HA system and, as seen in Fig. 6, a significant enhancement in the PDMPO–Si system. The sum of the intensities may therefore have neutralized variations in the opposite direction, but other processes may be at work. At pH 7 and 9, there was a significant enhancement in all systems, much stronger in the presence of both Si and PDMPO. This enhancement occurred without significant change of the peaks energy and was thus related to an increase in quantum yields. The strong fluorescence enhancement in the PDMPO–Si–HA system is therefore likely due to HA-PDMPO-Si groups more rigid than Si–PDMPO or Si–HA groups. The particle size distribution confirmed this hypothesis, with a single sharp peak centered around 40 nm. These data demonstrate that the Si–PDMPO fluorescence is dependent on the type of organic compounds present in the medium.
3.6 PDMPO–Al–Si–HA system
Results given in Fig. 13 and 14 show a behavior very different from that of the PDMPO–Si–HA system. In place of fluorescence exhausting, we observed a decrease, stronger at pH 7 and 9 than at pH 4. At pH 4, the fluorescence observed at Si and Al concentrations equal or lower to 10−5 mol L−1 was mainly that of HA. It decreased at higher Si and Al concentrations, revealing the specific fluorescence of PDMPO, whose signal decreased less than that of HA. At pH 7 and 9, the fluorescence of PMDPO decreased as much as that of HA. | ||
| Fig. 13 Examples of 3D-fluorescence spectra obtained at pH 4 and different Si and Al concentrations for the PDMPO–Al–Si–HA system. | ||
 | ||
| Fig. 14 Fluorescence intensities at λex = 330 nm, λem = 510 nm of the PDMPO–Al–Si–HA system at various pH as a function of the concentration of Al and Si in mol L−1. | ||
Among the processes that can explain variations in fluorescence intensity in the system, we can consider the formation of aluminosilicate nanoparticles,24 removing Si from the Si–PDMPO–HA interactions that have been shown to exhaust the signal, or the complexation of Al with HA sites, hindering the formation of fluorescent HA–PDMPO–Si fluorescent groups. These two processes, however, would not result in a signal quenching. The formation of low fluorescent HA–PDMPO–Al–Si quaternary complexes is therefore the most likely hypothesis. Other types of investigations such as NMR would be necessary to differentiate between possible mechanisms. The size particle distribution was different from other systems, with a main peak centred around 200 nm and a total mass of suspended particles four orders of magnitude higher. The presence of both Al and Si induced particle precipitation. The presence of species likely to complex on the sites of PDMPO or of natural organic matter can greatly modify the fluorescence of PDMPO in complex medium.
4 Conclusions
At the three studied pH, no changes in the PDMPO fluorescence parameters were observed. The PDMPO fluorescence is therefore not pH-dependent by itself and we suggest that the use of PDMPO fluorescence to monitor pH variations in complex media (intracellular medium, plant sap, soil solution) must be considered with the greatest caution. The pH dependence that was observed in other studies was probably due to an interaction between the PDMPO and the buffers used to set the pH of calibrating solutions.Dissolved Si as well as dissolved Al caused a quite similar enhancement of PDMPO fluorescence. The PDMPO is therefore not a Si-specific ligand.
Regarding complex systems, strong fluorescence enhancements in the PDMPO–Si–HA system suggests the formation of highly fluorescent HA–PDMPO–Si groups and demonstrates that the Si–PDMPO fluorescence depends on the type of organic compounds present in the medium. The strong fluorescence quenching in the PDMPO–Si–Al system suggests the formation of low fluorescent HA–PDMPO–Al–Si quaternary complexes and demonstrates that the presence of species other than Si capable of complexing on PDMPO can greatly modify the PDMPO fluorescence in a complex medium.
Conflicts of interest
There are no conflicts to declare.Acknowledgements
Financial support for this project was provided by the French ANR BIOSiSOL project (ANR-14-CE01-0002) and a grant from the Université de Toulon.Notes and references
- C. Jeffryes, S. N. Agathos and G. Rorrer, Curr. Opin. Biotechnol., 2015, 33, 23–31 CrossRef CAS PubMed.
- V. Panwar and T. Dutta, ACS Appl. Bio Mater., 2019, 2, 2295–2316 CrossRef.
- P. J. Treguer and C. L. De La Rocha, Annu. Rev. Mar. Sci., 2013, 5, 477–501 CrossRef PubMed.
- F. Guntzer, C. Keller and J. D. Meunier, Agron. Sustainable Dev., 2012, 32, 201–213 CrossRef.
- J. Schaller, S. Faucherre, H. Joss, M. Obst, M. Goeckede, B. Planer-Friedrich, S. Peiffer, B. Gilfedder and B. Elberling, Sci. Rep., 2019, 9, 449 CrossRef PubMed.
- L. Lunevich, Aqueous silica and silica polymerisation, Desalination - Challenges and Opportunities, 2019, vol. 6, pp. 1–19 Search PubMed.
- M. Kambalinaa, I. Mazurovaa, L. Skvortsovab, N. Gusevaa and V. Ana, Procedia Chem., 2014, 10, 36–42 CrossRef.
- S. D. Kinrade, R. J. Hamilton, A. S. Schach and C. T. G. Knight, J. Chem. Soc., Dalton Trans., 2001, 7, 961–963 RSC.
- J. F. Ma and N. Yamaji, Trends Plant Sci., 2006, 11, 392–397 CrossRef CAS PubMed.
- N. K. Savant, L. E. Datnoff and G. H. Snyder, Commun. Soil Sci. Plant Anal., 1997, 28, 1245–1252 CrossRef CAS.
- J. W. Ball and D. Nordstrom, User's manual for WATEQ4F with revised thermodynamic database and test cases for calculation speciation of major, trace and redox elements in natural waters, US Geological Survey, Menlo Park, April 2001 Search PubMed.
- M. Parambath, Q. S. Hanley, F. J. Martin-Martinez, T. Giesa, M. J. Buehler and C. Perry, Phys. Chem. Chem. Phys., 2016, 18, 5938–5948 RSC.
- Z. Diwu, C. S. Chen, C. Zhang, D. H. Klaubert and R. P. Haugland, Chem. Biol., 1999, 6, 411–418 CrossRef CAS PubMed.
- K. Shimizu, Y. Del Amo, M. A. Brzezinski, G. D. Stucky and D. E. Morse, Chem. Biol., 2001, 8, 1051–1060 CrossRef CAS PubMed.
- V. Filipe, A. Hawe and W. Jiskoot, Pharm. Res., 2010, 27, 796–810 CrossRef CAS PubMed.
- R. T. Williams and J. W. Bridges, J. Clin. Pathol., 1964, 17, 371–394 CrossRef CAS PubMed.
- Z. Zhang, J. Feng, P. Huang, S. Li and F. Y. Wu, Sens. Actuators, B, 2019, 298, 126891 CrossRef CAS.
- D. A. Dzombak and F. M. M. Morel, Surface complexation modeling, Wiley, New York, 1990 Search PubMed.
- A. K. Chattah, Y. Garro Linck, G. A. Monti, P. R. Levstein, S. A. Breda, R. H. Manzo and M. E. Olivera, Magn. Reson. Chem., 2007, 45, 850–859 CrossRef CAS PubMed.
- V. E. Barlette, L. C. Gomide Freitas, P. H. Guadagnini and C. A. Bertran, J. Braz. Chem. Soc., 2008, 19, 101–110 CrossRef CAS.
- B.-M. Lu, X.-Y. Jin, J. Tang and S.-P. Bi, J. Mol. Struct., 2010, 982, 9–15 CrossRef CAS.
- J. Adusei-Gyamfi, B. Ouddane, L. Rietveld, J. P. Cornard and J. Criquet, Water Res., 2019, 160, 130–147 CrossRef CAS PubMed.
- P. G. Coble, S. A. Green, N. V. Blough and R. B. Gagossian, Nature, 1990, 348, 432–435 CrossRef CAS.
- T. W. Swaddle, Coord. Chem. Rev., 2001, 219–221, 665–686 CrossRef CAS.
| This journal is © The Royal Society of Chemistry 2020 |

