 Open Access Article
Synthesis and characterization of SPDSCD and its flame retardant application on epoxy resins
Yi Zhangab,
Weiwei Yang a,
Wei Zhao
 c,
Fang Ruana,
Shulei Lia and
Jiping Liu
 *a
*a
aSchool of Materials Science and Engineering, Beijing Institute of Technology, Beijing 100081, China. E-mail: emmazhangling@163.com; yangweiwei0811@163.com; 18255171997@163.com; 18515503841@163.com; liujp@bit.edu.cn; Tel: +86-139-10788891
bDepartment of Biology and Chemical Engineering, Shandong Vocational College of Science &Technology, Weifang 261053, China
cCAS Key Laboratory of Space Manufacturing Technology, Technology and Engineering Center for Space Utilization, Chinese Academy of Sciences, Beijing, 100094, China. E-mail: zhaowei@csu.ac.cn
First published on 3rd August 2020
Abstract
In this study, a flame retardant agent, 2,4,8,10-tetraoxo-3,9-diphosphospiro[5.5]undecane spirophosphate-4,4-diaminopair benzene disulfone-1,3,5-himetriazine (SPDSCD), is synthesized through a direct polycondensation reaction. SPDSCD is a chemically expanded phosphorus-containing flame retardant in epoxy resins (EP). The molecular structure of SPDSCD and thermal stability are characterized by nuclear magnetic resonance, Fourier transform infrared spectroscopy, and thermogravimetric analysis, and EP/SPDSCD composites were investigated in detail. These properties are associated with the phosphorus-containing spiro structure on the main molecular chain which can promote condensation polymerization into carbon during pyrolysis, the new nitrogen-containing carbon source, and the triazine structure. SPDSCD shows good thermal stability and low flammability, the weight loss from 500 to 800 °C was only 6.1 wt%, and the residual mass at 800 °C was 48.9 wt%. With the addition of SPDSCD, the flame retardant quality of the composites was gradually enhanced, the carbon residue becomes denser, which isolates heat transfer and inhibits the volatilization of flue gas. The addition of 20 wt% SPDSCD in the EP sample was associated with a limited oxygen index (LOI) value of 26% and a vertical burning V-0 rating. Cone calorimeter test shows that the peak heat release rate is reduced by 75%; the heat release rate curve enters the heat release platform area with a value lower than the first peak, TSP is reduced by 24%, the ac-CO2Y value reduced by 25.6%, indicating that SPDSCD/EP produced less CO2, which obviously prevented the combustion of volatile gas. SPDSCD exerted a charring and barrier effect in the condensation phase. Using basic characterization and flame retardancy testing, this work determined that SPDSCD has good flame retardancy when added to EP.
1 Introduction
Epoxy resin (EP) is one of the most widely used thermosetting polymers due to its multiple excellent properties, including adhesion, mechanical strength, low shrinkage, electrical insulation, and corrosion resistance.1–3 However, EP has a low oxygen index and is extremely flammable, which makes it a great fire hazard.4,5 In addition, EP releases a lot of heat and combustible volatile substances when burning, which brings a great threat to people's lives and property. These factors limit EP's scope of application in electronic packaging and other fields. Recently, EPs have been used as engineering adhesives and as the matrix of fiber-reinforced polymers in applications such as new energy automobiles and complex structural aircraft components.6–8 Therefore, it is necessary to prepare high-flame retardant EP materials with good physical properties and a high material compatibility. Remarkably, EP always generates large amounts of CO2 and CO gases when burned. It is well known that people can suffocate due to smoke when a fire occurs. Therefore, the preparation of a flame retardant that effectively suppresses the release of smoke is essential.Double spiro SPDPC (2,4,8,10-tetraoxo-3,9-diphosphospiro5 undecanespirophosphate-1,3,5-himetriazine-4,4-diaminopair benzene disulfone) is a highly symmetrical cage-like compound which combines an acid source and a carbon source. It can dehydrate into char during the combustion process. Due to its excellent flame retardancy, derivatives of SPDPC have attracted the attention of many scholars. Wang Xin et al. synthesized a flame retardant PFR by mixing 10-(2,5-dihydroxyl-phenyl)-9,10-dihydro-9-oxa-10-phosphaphenanthrene-10-oxide (DOPO-BQ) and pentaerythritol diphosphonate dichloride (SPDPC).9 This flame retardant exhibits good flame retardant properties. Remarkably, the limited oxygen index (LOI) value of EP/PFR is 30.2 and the UL-94 value is at the V-0 level when the content of PFR is 10%. However, the effect of suppressing the release of damaging gases is not high. Li et al.10 synthesized a novel flame retardant (SPDV) containing phosphorus and silicon elements. Spirocyclic pentaerythritol bisphosphonate disphosphoryl chloride (SPDPC), synthesized through a simple dehydrochlorination reaction of pentaerythritol (PER) and phosphorus oxychloride (POCl3), was added into 9,10-dihydro-9-oxa-10-phosphaphenanthrene-10-oxide (DOPO)/vinylmethyldimethoxy silane (VMDMS) oligomer (DV) to form a novel flame retardant. This was applied to flame retardant EVM materials, showing good flame retardancy. Intermediate SPDPC has a good flame retardant performance and has broad application prospects.
Phosphorus, nitrogen, silicon, and other elements can be added to epoxy compounds to form epoxy compounds with flame retardant elements, or they can react with amino-based curing agents to introduce them into the curing agent.11,12 Phosphorus-containing curing agents can effectively promote the formation of carbon on epoxy resins. The carbon layer plays a protective role and isolates the internal matrix from external heat and oxygen to exert a flame retardant effect.13–18 Phosphate esters, 9,10-dihydro-9-oxa-10-phosphaphenanthrene-10-oxide (DOPO), arylphosphine oxide, PEPA, and SPDPC units are commonly used to add flame retardant structural units. Wang et al. prepared a linear phosphite-based epoxy19 resin (LPN-EP) through a six step reaction using linear phosphite, parabenzaldehyde, and epichlorohydrin as the main raw materials. When the amount of LPN-EP added was 30 wt% and the phosphorus content of the system was 3.46 wt%, the LOI of flame retardant EP increased from 22.3% to 31.8% of pure EP and reached level UL-94 V-0, but previous research found that the tensile strength and flexural strength of flame retardant EP decreased as the LPN-EP content increased. Huang20 et al. added DOPO to 1,4-naphthoquinone and p-naphthoquinone to prepare DOPO-based diols (DOPO-NQ and ODOPB) and mixed them with DGEBA to prepare flame-retardant EP. When the phosphorus content was 2.1 wt%, the flame retardant EP was able to reach UL-94 V-0. The introduction of co-monomers improved the flame retardant level of EP by 30 to 40 °C compared with pure EP, and the thermal stability of the system improved. However, with an increase in the phosphorus content, the thermal stability of O–P![[double bond, length as m-dash]](https://www.rsc.org/images/entities/char_e001.gif) O was weaker than that of C–C, and the initial thermal decomposition temperature drops. Accordingly, the development of a new reactive flame retardant that can give EP a satisfactory flame-retardant performance while simultaneously maintaining the inherent thermal properties and lowering gas emissions is of great significance for industrial application.
O was weaker than that of C–C, and the initial thermal decomposition temperature drops. Accordingly, the development of a new reactive flame retardant that can give EP a satisfactory flame-retardant performance while simultaneously maintaining the inherent thermal properties and lowering gas emissions is of great significance for industrial application.
In this work, we prepare a chemical intumescent flame retardant containing phosphorus, carbon, and nitrogen for the first time. SPDSCD is characterized by 1H NMR and 31P NMR spectroscopy and applied to EP materials and is confirmed to effectively reduce gas emissions by a flame retardant test. Spirocyclic diacid chloride (SPDPC) prepared by our laboratory is used as a starting material. The thermal stability and flame retardancy of the synthesized SPDSCD and SPDSCD/EP are investigated. And the effects of SPDSCD/EP with different loading capacities on the thermal stability and flame retardant performance of epoxy resin ammonium polyphosphate composite materials are studied and compared.
2 Experimental
2.1 Materials
Pentaerythritol (PER) was purchased from Beijing Chemical Plant (Beijing, China). Phosphorus oxychloride was purchased from Tianjin Guangfu Fine Chemical Research Institute (Tianjin, China). 4,4-Diaminodiphenylsulfone (DDS), 4,4-diaminodiphenylmethane (DDM), and dimethylsulfoxide (DMSO) were purchased from Sinopharm Chemical Reagent Beijing Co., Ltd (Beijing, China). Triethylamine and acetonitrile were purchased from Beijing Chemical Plant (Beijing, China). Melamine was purchased from Sann Chemical Technology (Shanghai) Co., Ltd. (Shanghai, China). SPDPC was made in the laboratory. Epoxy resin (DGEBA, commercial name: E-44) was supplied by Sinopec Baling Petrochemical Branch (Yueyang, China). All materials were of reagent grade and were used as received.2.2 Synthesis of SPDPC
The synthesis route of SPDPC is shown in Scheme 1. The raw materials were pentaerythritol and phosphorus oxychloride, which were charged at a molar ratio of 1![[thin space (1/6-em)]](https://www.rsc.org/images/entities/char_2009.gif) :
:![[thin space (1/6-em)]](https://www.rsc.org/images/entities/char_2009.gif) 5. White pentaerythritol powder (0.3 mol) was added to a 500 ml round-bottomed flask, which was connected to a mechanical stirrer and a condenser tube. Then, 1.5 mol of freshly distilled phosphorus oxychloride was added to the round-bottomed flask quickly. A lye absorption device was connected to absorb acidic gases released during the reaction. After stirring at room temperature for 10 minutes, the temperature was raised to 110 °C, and the reaction was continued for 10 hours at 110 °C. Then heating stopped and the reaction stopped. After the liquid in the round-bottomed flask was cooled to room temperature, a white granular solid product was obtained following suction filtration, which was washed with acetone several times. The obtained product was dried in a vacuum oven for 6–8 hours at 80 °C. The yield reached 70%.
5. White pentaerythritol powder (0.3 mol) was added to a 500 ml round-bottomed flask, which was connected to a mechanical stirrer and a condenser tube. Then, 1.5 mol of freshly distilled phosphorus oxychloride was added to the round-bottomed flask quickly. A lye absorption device was connected to absorb acidic gases released during the reaction. After stirring at room temperature for 10 minutes, the temperature was raised to 110 °C, and the reaction was continued for 10 hours at 110 °C. Then heating stopped and the reaction stopped. After the liquid in the round-bottomed flask was cooled to room temperature, a white granular solid product was obtained following suction filtration, which was washed with acetone several times. The obtained product was dried in a vacuum oven for 6–8 hours at 80 °C. The yield reached 70%.
2.3 Synthesis of SPDSCD
Scheme 2 depicts the synthesis route of SPDSCD. A 500 ml three-necked round-bottom glass flask was filled with nitrogen for 5 minutes. Then, 300 ml of acetonitrile was added to SPDPC and 4,4-diaminodiphenylsulfone (DDS) (1![[thin space (1/6-em)]](https://www.rsc.org/images/entities/char_2009.gif) :
:![[thin space (1/6-em)]](https://www.rsc.org/images/entities/char_2009.gif) 1) in a three-necked flask, and the start stirrer was turned on (stirring rate: 300 ml min−1). After the reactants in the flask were mixed uniformly, a small amount of triethylamine was added and the heating rate was adjusted to 5 °C per 10 min. The gas released from the reaction system were absorbed with lye. The reaction was maintained for 12 h at 110 °C under the protection of nitrogen. Cooling to room temperature, add 300 ml acetonitrile into the solution, and then 18.4 g (0.1 mol) of cyanuric chloride was added, keep the temperature steadily raised to 120 °C. After continuous reflux for 24 h, stopped heating and cooled to room temperature. Then, heating stopped and the system was cooled to room temperature. A yellow-brown solid was obtained after rinsing three times with acetone and acetonitrile and suction filter, and this was placed in a vacuum oven at 80 °C for 8 h.
1) in a three-necked flask, and the start stirrer was turned on (stirring rate: 300 ml min−1). After the reactants in the flask were mixed uniformly, a small amount of triethylamine was added and the heating rate was adjusted to 5 °C per 10 min. The gas released from the reaction system were absorbed with lye. The reaction was maintained for 12 h at 110 °C under the protection of nitrogen. Cooling to room temperature, add 300 ml acetonitrile into the solution, and then 18.4 g (0.1 mol) of cyanuric chloride was added, keep the temperature steadily raised to 120 °C. After continuous reflux for 24 h, stopped heating and cooled to room temperature. Then, heating stopped and the system was cooled to room temperature. A yellow-brown solid was obtained after rinsing three times with acetone and acetonitrile and suction filter, and this was placed in a vacuum oven at 80 °C for 8 h.
2.4 Preparation of SPDSCD/EP composites
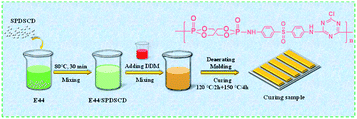
Fig. 1 shows the process of the preparation of the SPDSCD/EP composite. PA 250 ml beaker with 50 g of EP-44 was placed in a constant temperature oil bath at 80 °C and stirred for 30 min. The formula dosage of flame retardant was added according to Table 1 and stirred for 30 min. Then, we added 8.75 g of the curing agent DDM to the beaker and continued stirring. After the appearance of the system became uniform, the air in the breaker was removed, and then injection mold curing was carried out. The mold was placed in the oven at 120 °C for 2 hours and then at 150 °C for 4 hours and cured. The cured sample of the SPDSCD/EP composite material was obtained. The proportion of the flame retardant is shown in Table 1.| Samples | EP (wt%) | SPDSCD (wt%) | DDM (wt%) |
|---|---|---|---|
| EP-0 | 100 | 0 | 17.5 |
| EP-1 | 95 | 5 | 17.5 |
| EP-2 | 90 | 5 + 5 (APP) | 17.5 |
| EP-3 | 90 | 10 | 17.5 |
| EP-4 | 80 | 20 | 17.5 |
2.5 Characterization
3 Results and discussion
3.1 Characterization of the structure and thermal stability of SPDSCD
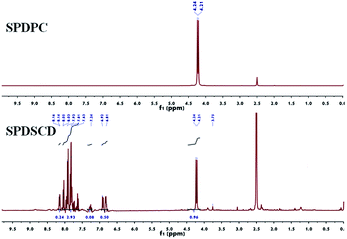
The synthesized SPDSCD was obtained via direct condensation polymerization. For SPDSCD, trimethylamine was used as an acid binder to remove the HCl during polycondensation. Additional processes were used to split the by-product, triethylamine hydrochloride. In order to study the structure–performance relationships, SPDSCD with a narrow molecular-weight distribution was needed. Therefore, a nitrogen atmosphere was used to exhaust the HCl from the reaction. In U.S. Waters Breeze™ 2 type high efficiency liquid chromatograph flame retardants and intermediates, the molecular weight of the compounds: Mw (sticky molecular weight), Mn (the number average molecular weight, molecular weight distribution) (Đ). The test conditions were as follows: at room temperature, a small amount of DMSO was dissolved, and tetrahydrofuran was used as mobile phase. The weight-average molecular weight (Mw) of SPDSCD tested by gel permeation chromatography (GPC) is 7897; the molecular weight dispersity (Đ) is 1.05. The dispersity is usually a result of side effects, for instance, chlorination and reaction with residual water or alkylation of amino groups.21,22The prepared SPDSCD was characterized via 1H NMR and 31P NMR (Fig. 2) spectrum curves. As shown in Fig. 2, the multiples between 4.2 and 4.5 ppm correspond to the SPDSCD spiral ring, –CH2, which corresponds to the 1H NMR curves of SPDPC. The multiples between 7.60 and 7.95 ppm represent the benzene ring, 8.15 and 8.22 ppm correspond to the P–NH– and DDS bonds, and 6.9 and 7.24 ppm represent the P–NH– triazine ring and DDS bond, respectively.23 The peaks appearing at 4.20–4.5 ppm correspond to the hydrogen in SPDSCD spiro–CH2, the peaks appearing at 6.9 ppm, 7.60–7.95 ppm correspond to the hydrogen on the benzene ring in the medium DDS structure, and appear at 8.15–8.22 ppm. The peak corresponds to the hydrogen bonded to N in (CN)3–NH–(CH)6-position-NH–, the peak appearing near 7.24 ppm corresponds to the hydrogen bonded to N on P–NH–.24
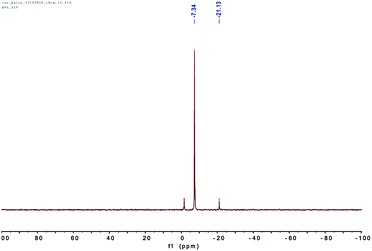
From Fig. 3, the 31P-NMR spectrum shows that the chemical shift of −7.73 ppm corresponds to the absorption peak of phosphorus in the SPDSCD main chain, and the chemical shift of −21.13 ppm corresponds to the absorption peak of phosphorus at the chain end.
The 31P NMR curves of SPDSCD show two prominent signals (Fig. 3). The one at around −7.73 ppm corresponds to the absorption peak of phosphorus in the main SPDSCD chain; the other signal at around −21.13 corresponds to the absorption peak of the blocked phosphorus element. All spectroscopic curves confirm the synthesis of SPDSCD.
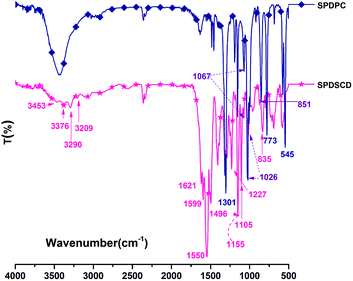
Fig. 4 depicts the FTTR spectra curve of the SPDPC and SPDSCD retardants. The spectral curves of SPDPC show the characteristic absorption peak of the primary DDS amino group (–NH2) at 3453 cm−1, the C![[double bond, length as m-dash]](https://www.rsc.org/images/entities/char_e001.gif) C stretching vibration absorption peak on the benzene ring at 1599 and 1496 cm−1, a stretching vibration peak of S
C stretching vibration absorption peak on the benzene ring at 1599 and 1496 cm−1, a stretching vibration peak of S![[double bond, length as m-dash]](https://www.rsc.org/images/entities/char_e001.gif) O at 1155 cm−1, and a strong absorption peak at 1550 cm−1. These characteristic peaks indicate the existence of the triazine structure. For SPDPC curves, a P–O–C stretching vibration absorption peak appeared at 1026 cm−1, the P
O at 1155 cm−1, and a strong absorption peak at 1550 cm−1. These characteristic peaks indicate the existence of the triazine structure. For SPDPC curves, a P–O–C stretching vibration absorption peak appeared at 1026 cm−1, the P![[double bond, length as m-dash]](https://www.rsc.org/images/entities/char_e001.gif) O stretching vibration absorption peak appeared at 1301 cm−1, and both appear absorption peaks of P(OCH2)C appeared at 835 cm−1. Taken together, the NMR and FTTR curve data confirm the successful production of SPDPC and SPDSCD.25,26 At 1155 cm−1 is the stretching vibration peak of S
O stretching vibration absorption peak appeared at 1301 cm−1, and both appear absorption peaks of P(OCH2)C appeared at 835 cm−1. Taken together, the NMR and FTTR curve data confirm the successful production of SPDPC and SPDSCD.25,26 At 1155 cm−1 is the stretching vibration peak of S![[double bond, length as m-dash]](https://www.rsc.org/images/entities/char_e001.gif) O; a strong absorption peak appears at 1550 cm−1, indicating the presence of the triazine structure. The POC stretching vibration absorption peak appears at 1026 cm−1, the P
O; a strong absorption peak appears at 1550 cm−1, indicating the presence of the triazine structure. The POC stretching vibration absorption peak appears at 1026 cm−1, the P![[double bond, length as m-dash]](https://www.rsc.org/images/entities/char_e001.gif) O stretching vibration absorption peak at 1301 cm−1, and the P(OCH2)C absorption peak appears at 835 cm−1 at 921 cm−1. The peaks appearing at 1851 cm−1, 773 cm−1 are characteristic peaks of spirocyclic phosphate.27–31
O stretching vibration absorption peak at 1301 cm−1, and the P(OCH2)C absorption peak appears at 835 cm−1 at 921 cm−1. The peaks appearing at 1851 cm−1, 773 cm−1 are characteristic peaks of spirocyclic phosphate.27–31
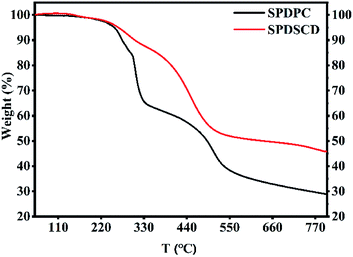
The thermal stability of SPDPC and SPDSCD was also characterized by the TGA test, and Fig. 5 and Table 2 illustrate the results. As Fig. 5 depicts, the retardant sample decomposed at a low rate at temperatures between 181 and 370 °C, and a rapid weight loss stage occurred at 380–410 °C. Compared to the TGA curve of SPDPC, the initial decomposition of SPDSCD was advanced; however, attainment of the maximum weight loss temperature was delayed. This phenomenon is because the triazine group started to decompose at 180 °C and then generated non-combustion gas, which caused the initial weight loss temperature of the SPDSCD to decrease. The weight loss rate became slower than the temperature of SPDPC, reaching the weightless platform stage at a temperature of 530 °C. Furthermore, the residual carbon percentages of SPDSCD and SPDSCD were ∼49% and 29% respectively. This is because of the presence of triazine groups, the simultaneous addition of SPDPC, and because triazine has the advantage of increasing the amount of residual carbon. Additionally, the carbon layer generated during the pyrolysis and expansion of the sample was dense and showed favorable thermal stability. Accordingly, the prepared flame retardant SPDSCD showed higher thermal stability and had a better charring performance, which depicts that it could perform better as a barrier for materials.
| Samples | Tx% (°C) (x = residual char, wt%) | Residual char (500 °C, wt%) | Residual char (700 °C, wt%) | |||
|---|---|---|---|---|---|---|
| 99% | 95% | 90% | 50% | |||
| SPDSCD | 182 °C | 274 °C | 291 °C | 634 °C | 54 | 48.9 |
| SPDPC | 180 °C | 254 °C | 274 °C | 492 °C | 48 | 32 |
3.2 LOI and vertical burning test
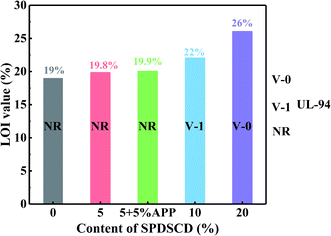
The LOI test was used to investigate the flame retardancy of SPDSCD/EP, as depicted in Fig. 6. It is well known that the LOI value can support a convenient numerical assessment of flame-retardant stability for polymers.32,33 However, the LOI value is not a strict performance indicator of the material, as it is affected by environmental factors and experimental behavior. Fig. 6 shows that the LOI value of the SPDSCD/EP materials increased observably as the amount of SPDSCD increased. The LOI value increased from 19% for pure EP to 26% for 20% SPDSCD/EP. When we compared the LOI value of the 5% ammonium polyphosphate and 5% SPDSCD to 10% SPDSCD, 10% SPDSCD/EP was found to have a higher LOI value. This indicates that SPDSCD/EP can significantly increase the flame retardant performance of EP matrix.Pure EP was found to have no rating in UL-94 tests, the LOI was 19%, and it produced little char residue. When the amount of SPDSCD added was increased to 20%, the char residue of the EP/SPDSCD composites increased remarkably. It is worth mentioning that burning had a blowout effect when the addition was 20%. Char residue is able to protect the EP matrix, preventing heat transfer to the pyrolysis zone and flammable gases transfer to the flame zone. The UL-94 test for 20% SPDSCD/EP reached level V-0, and there was no dripping phenomenon, which showed the anti-dropping effect of SPDSCD on EP during combustion. For the LOI test, we compared the UL-94 level of 10% SPDSCD/EP and 5% APP/5% SPDSCD/EP and showed that prepared SPDSCD has a higher level and this matched well with the LOI test.
3.3 Cone calorimeter test
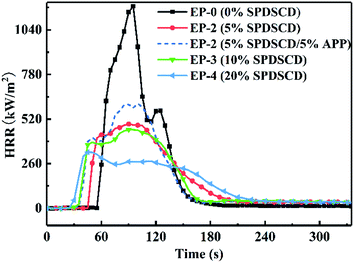
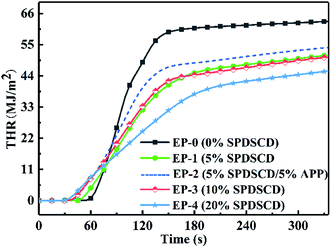
The cone calorimeter test was applied to investigate the flame-retardant effects of SPDSCD/EP and APP/SPDSCD/EP. This test can provide a significant deal of information on materials' combustion characteristics through simulating a real fire atmosphere. Detailed information from the cone test is listed in Table 4. This includes the time to ignition (TTI), the peak of total mass loss (TML), the average effective heat of combustion (av-EHC), the average heat release rate (av-HRR), the average CO2 yield (av-CO2Y), and the total heat release per total mass loss (THR/TML). The heat release rate (HRR) images and total heat release (THR) data are depicted in Fig. 7, 8, and the detailed representative parameters of the composite samples are catalogued in Table 3. We can see from Fig. 7 that the peak HRR (PHRR) of 5% SPDSCD/EP is close to that of 10% SPDSCD/EP, and both are below that of EP without flame retardant, which burns instantly after ignition, causing the HRR value to rapidly reach a sharp peak of 1177 kW m−2. When the addition of SPDSCD was 20%, the PHRR peak decreased to 28% of the pure EP cure. The av-HRR for SPCSCD/EP samples in order of decreasing fire risk is as follows: 20% SPDSCD/EP < 5% APP/5% SPDSCD/EP < 10% SPDSCD < 5% SPDSCD < EP (Table 3). We also compared the HRR of 5% APP/5% SPDSCD/EP with that of 10% SPDSCD and showed that the latter has a lower PHRR value. Therefore, SPDSCD flame retardant performs better. Because of the reduction in PHRR, there is a small gap between 5% APP/5% SPDSCD/EP and 10% SPDSCD. Interestingly, the HRR curves show two peaks in the sample; this phenomenon occurs due to the intumescent flame retardant (IFR) characteristic.| Sample | TTI (s) | P-HRR (kW m−2) | THR (MJ m−1) | THR/TML (MJ m−2 g−1) | av-HRR (kW m−2) | av-CO2Y (kg/kg) | av-EHC (MJ kg−1) |
|---|---|---|---|---|---|---|---|
| EP-0 | 51 | 1177 | 66 | 2.81 | 178.06 | 2.03 | 24.66 |
| EP-1 | 41 | 491 | 58 | 2.44 | 148.57 | 1.64 | 21.09 |
| EP-2 | 31 | 610 | 60 | 2.30 | 154.71 | 1.63 | 20.39 |
| EP-3 | 26 | 458 | 58 | 2.23 | 145.53 | 1.51 | 19.09 |
| EP-4 | 24 | 327 | 54 | 2.18 | 131.65 | 1.46 | 18.25 |
Fig. 8 shows that SPDSCD/EP significantly amended the THR reduction of EP. Furthermore, the THR images of 5% SPDSCD/EP show much lower values than those of pure EP, and the images of 5% SPDSCD/EP and 10% SPDSCD/EP show much higher values than those of 20% SPDSCD/EP, during the fire regeneration period. Less heat release indicates a lower speed of fire spread and a longer effective time period for the response, thereby enhancing the escape time. The test also compared 5% APP/5% SPDSCD/EP with 10% SPDSCD, showing that the latter has relatively low PHHR and THR values. Therefore, SPDSCD has more advantages in terms of flame retardant performance.
SPDSCD does not melt in EP or DDM. The SPDSCD/EP cured system always exists; therefore, with the addition of SPDSCD, the crosslink density of the system decreases and the initial degradation temperature changes decreases. The pyrolysis gas in the SPDSCD/EP is ignited earlier, and accordingly, the TTI becomes smaller. The THR/TML represents the product of the available heat from burning the volatiles and the burning efficiency.34 The THR/TML ratio for the SPDSCD/EP composites decreased by 22.4% because of flame inhibition. Furthermore, the av-EHC values of all samples decreased when the amount of added SPCSCD increased. EHC was used to test the burning ratio of flammable volatile gas. The decline in the av-EHC values means that the addition of SPDSCD can effectively suppress the burning of volatile gases and prevent the free radical chain reaction of the gaseous phase. The amount of CO2 released has a significant effect on the escape time when a fire occurs. Table 3 shows that the ac-CO2Y value reduced by 25.6%, indicating that SPDSCD/EP produced less CO2, which obviously prevented the combustion of volatile gas, acting as a gas phase flame retardant. According to Table 3, we can conclude that the prepared SPDSCD has a better flame retardant effect than the normal flame retardant APP applied on EP.
3.4 TGA of EP and SPDSCD/EP composites
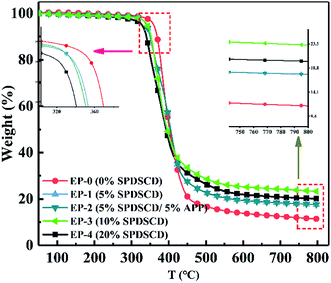
The TGA curves of SPDSCD/EP (Fig. 9) and APP/SPDSCD/EP give information about the thermal stability and thermal degradation performance. Table 4 lists some detailed information. In the N2 atmosphere, the initial decomposition temperature of pure EP is 388 °C; however, as SPDSCD and APP/SPDSCD were added, the initial decomposition temperature gradually decreased. Because of the earlier decomposition and catalysis function of SPDSCD and APP/SPDSCD, the Tonset and Tmax were lower than those of pure EP. The amount of residual char at 500 °C was about 17 wt%, whereas that of SPDSCD/EP at 500 °C was from 23% to 29% with increased added SPDSCD mass. Therefore, the addition of SPDSCD flame retardant has a promotion effect on the charring yield of the EP matrix.| Samples | Tonset (°C) | Tmax (°C) | Residuals at 500 °C (wt%) |
|---|---|---|---|
| EP-0 | 388 | 408 | 17 |
| EP-1 | 340 | 346 | 23 |
| EP-2 | 340 | 364 | 23 |
| EP-3 | 338 | 366 | 26 |
| EP-4 | 328 | 351 | 29 |
3.5 Morphology and ingredient analyses of the residues from the cone calorimeter test
Fig. 10 shows digital images of the residues produced in the cone calorimeter test. According to the images, pure EP (Fig. 10a) was almost completely combusted, and we only observed a small amount of EP residue after the cone test. After SPDSCD was incorporated into EP, as shown in Fig. 10(b and c), some tiny holes could be clearly observed in the picture of 5% SPDSCD. As the amount of flame retardant SPDSCD added increased, the carbon layer gradually became denser, as seen by the naked eye. We compared 5% APP/5% SPDSCD/EP to 10% SPDSCD (insert in Fig. 10c) and found that the latter had a denser structure. The carbon layer of the former was similar to a lamellar structure. The residue char yield and quality of 20% SPDSCD obviously enhanced and was the densest (Fig. 10d). SPDSCD facilitated the charring process of EP during burning and the carbon residue layer carried out a barrier function in the condensed phase. There were no open pores visible to the naked eye. The volume of the object was the smallest. Accordingly, with an increase in the amount of flame retardant SPDSCD, the structure of the flame retardant EP cured carbon layer was denser, and the resistance to gas evolution also increased, which is in accordance with the cone test data.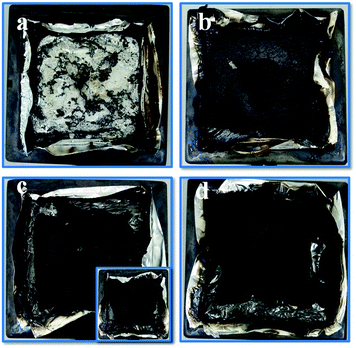 | ||
| Fig. 10 Digital photos of EP residues from cone calorimeter. (a); EP (b); EP + 5% SPDSCD. (c); EP + 10% SPDSCD. (d); EP + 20% SPDSCD. | ||
The phosphorus–nitrogen ratio (P/N) of 20% of the samples was 1![[thin space (1/6-em)]](https://www.rsc.org/images/entities/char_2009.gif) :
:![[thin space (1/6-em)]](https://www.rsc.org/images/entities/char_2009.gif) 10. The gas release rate of this type of chemical expansion agent matches the speed of the flame retardant polymer, forming a carbon layer. The carbon formation rate and viscosity of the melt correspond to the system gas generation rate during the process of crosslinking, forming a carbon layer. Therefore, the carbon layer foams evenly, forming a homogeneous closed-cell foam carbon layer.
10. The gas release rate of this type of chemical expansion agent matches the speed of the flame retardant polymer, forming a carbon layer. The carbon formation rate and viscosity of the melt correspond to the system gas generation rate during the process of crosslinking, forming a carbon layer. Therefore, the carbon layer foams evenly, forming a homogeneous closed-cell foam carbon layer.
SEM analysis of 20% SPDSCD was performed in order to observe the microscopic morphology of the char residue further, and the results are depicted in Fig. 11. Fig. 11a shows that the carbon residue layer performed as a foam-like solid formed by non-penetrating holes with a level of 40–100 μm, and the residual hole distribution in the field of view was relatively uniform and continuous. This structure is relatively regular (Fig. 11b), and it can provide thermal insulation protection for unburned substrate. It also hinders the escape of CO2 gas. This result is in accordance with the results of the cone test analysis.
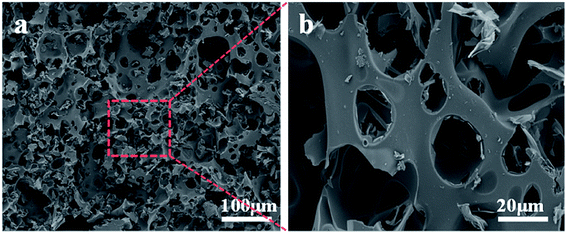 | ||
| Fig. 11 SEM photos of 20% SPDSCD residue from cone calorimeter. (a) Scan bar 100 μm; (b) scan bar 20 μm. | ||
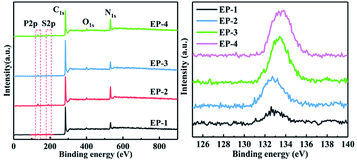
The element contents of the carbon layer from SPDSCD/EP after the cone test were characterized by XPS. The result details are listed in Table 5. The XPS curve depicts that in the char layer generated from the cone test, C, N, O, S, and P elements were observed (Fig. 12). As the SPDSCD content increased, the phosphorus in char residue showed an obvious increase, indicating that more phosphorus penetrated into the char process, facilitating the formation of phosphorus-rich residue and, therefore, generating better heat and combustion functions. In terms of comparison of the 5% APP/5% SPDSCD/EP composite with 10% SPDSCD/EP, Table 5 shows that the later has a higher phosphorus content, in accordance with results of the cone test. Due to the addition of 5% APP and 5% SPDSCD in EP-2 and 20% SPDSCD in EP-4, the phosphorus content of flame retardant samples EP-2 and EP-4 are 1.82 wt% and 0.91 wt%, respectively, the triazine group content is 1.46 wt%, 5.85 wt%, as shown in Table 5, the C, N, O, P in the samples of the two groups of flame retardant samples after cone calorimetry test The content is not much different. The residual carbon content of EP-4 even reaches 2.62%, which is higher than EP-2, which confirms that the flame retardant SPDSCD has a synergistic effect between the phosphorus-containing flame retardant structure and the new carbon source, which can be improved. The flame retardant effect of phosphorus element promotes the retention of phosphorus element in the residual carbon. A small amount of sulfur was found in the samples, which is due to the DDS curing agent. It is reported that the sulfur-based products could accelerate the oxidation reaction, leading to the formation of char precursors. In addition, the results also depict that there is a synergistic function between the hetero-atoms and the phosphonamide structure. At the same time, the decomposition of the P–C bond structure can generate a phosphorus-containing gas in the gas phase, exerting a gas phase flame retardant effect,35 which matches the above characteristics well.
| Sample | C (%) | N (%) | O (%) | P (%) |
|---|---|---|---|---|
| EP-0 | 83.69 | 1.2 | 15.11 | — |
| EP-1 | 81.04 | 5.84 | 12 | 1.11 |
| EP-2 | 75.90 | 6.41 | 15.58 | 1.31 |
| EP-3 | 83 | 5.69 | 9.79 | 1.51 |
| EP-4 | 75.35 | 6.19 | 15.84 | 2.62 |
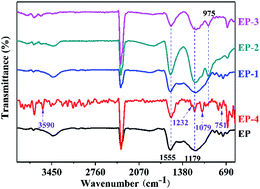
The FTIR test was performed on the residual carbon formed by the EP cured product and the flame-retardant EP cured product after the cone calorimetry test, and the obtained curve is shown in Fig. 13. The residual carbon infrared spectra of EP-0, EP-2, and EP-3 all show peaks at 1555 cm−1, which correspond to fused ring aromatics. In the residual carbons of flame-retardant samples, the peaks at 1179 cm−1 and 975 cm−1 represent the existence of P![[double bond, length as m-dash]](https://www.rsc.org/images/entities/char_e001.gif) O, P–O–C and P–O–P bonds. The peak at 3409 cm−1 represents the water peak, confirming that there is moisture absorption during the placement of the residual carbon of the sample; the peak at 2356 cm−1 represents the C
O, P–O–C and P–O–P bonds. The peak at 3409 cm−1 represents the water peak, confirming that there is moisture absorption during the placement of the residual carbon of the sample; the peak at 2356 cm−1 represents the C![[double bond, length as m-dash]](https://www.rsc.org/images/entities/char_e001.gif) O bond;36 the peak at 1555 cm−1 represents –C
O bond;36 the peak at 1555 cm−1 represents –C![[double bond, length as m-dash]](https://www.rsc.org/images/entities/char_e001.gif) N–, –C
N–, –C![[double bond, length as m-dash]](https://www.rsc.org/images/entities/char_e001.gif) C– bond,37 corresponding to fused ring aromatic hydrocarbons; the peak at 975 cm−1 in the residual carbon of samples EP-2, EP-3, EP-4 represents P
C– bond,37 corresponding to fused ring aromatic hydrocarbons; the peak at 975 cm−1 in the residual carbon of samples EP-2, EP-3, EP-4 represents P![[double bond, length as m-dash]](https://www.rsc.org/images/entities/char_e001.gif) O; in the sample. The peaks at 1237 cm−1 and 1067 cm−1 in EP-4 residual carbon represent the presence of PN, POC and POP bonds.38 In the sample EP-4 residual carbon, there is an absorption peak near 2800–3200 cm−1, confirming the presence of –CH3, –CH2, –CH in the residual carbon.
O; in the sample. The peaks at 1237 cm−1 and 1067 cm−1 in EP-4 residual carbon represent the presence of PN, POC and POP bonds.38 In the sample EP-4 residual carbon, there is an absorption peak near 2800–3200 cm−1, confirming the presence of –CH3, –CH2, –CH in the residual carbon.
4 Conclusion
In the chemically intumescent flame retardant system, the phosphorus-containing compound as an acid source can promote the loss of water from the polymer and improve the quality of the residue after the polymer is burned; it releases non-combustible product ammonia or nitrogen, dilutes the combustible gas, and promotes the formation of a foam expansion layer by the viscous polymer material. Nitrogen-containing compounds used in chemical intumescent flame retardants, such as the foamed carbon source-triazine structure, can improve the carbon formation effect of the system while increasing the amount of non-combustible gas released during the flame retardant process. It plays the role of gas source and supplementary carbon source. The thermogravimetric data of SPDSCD and SPDPC, the initial decomposition temperature, 50% temperature, 500° carbon residue, and 700 °C carbon residue all indicate that the thermal stability of the flame retardant did not decrease because of the phosphorus content after the introduction of the triazine structure. And the decline has increased. When it is used in flame-retardant epoxy resin, nitrogen is divided into the following, and the mass fraction of residual carbon at 500° and 700° with the addition of 10% flame retardant is 8% and 6% higher than the calculated value, respectively. When the structure and triazine group constitute a chemically intumescent flame retardant, it can promote the polymer to form carbon. With the increase of the amount of flame retardant, the digital photo can see that the residual carbon structure is getting closer and tighter, and the heat release and smoke release of the cone calorimetry test are also significantly reduced. As can be seen from the SEM photo, the amount of addition is 20% at the time, the residual carbon layer after the cone test was distributed with non-penetrating holes with a diameter of 20–100 microns. It was confirmed that when a phosphorus-containing flame retardant structure was combined with a triazine group to prepare a chemically expanded flame retardant, it could form the dense carbon layer structure, heat insulation, smoke suppression, has a protective effect on the unburned substrate, and improves the fire safety of the material.Author contributions
Data curation, Weiwei Yang, Wei Zhao and Shulei Li; formal analysis, Yi Zhang; investigation, Fang Ruan; supervision, Jiping Liu.Conflicts of interest
The authors declare no conflict of interest.Notes and references
- W. Yan, J. Yu, M. Q. Zhang, S. H. Qin, T. Wang, W. J. Huang and L. J. Long, RSC Adv., 2017, 7, 46236–46245 RSC.
- W. Liu, Q. Qiu, J. Wang, Z. Huo and H. Sun, Polymer, 2008, 49, 4399–4405 CrossRef CAS.
- Y. J. Xu, J. Wang, Y. Tan, M. Qi, L. Chen and Y. Z. Wang, Chem. Eng. J., 2018, 337, 30–39 CrossRef CAS.
- S. Levchik, A. Piotrowski, E. Weil and Q. Yao, Polym. Degrad. Stab., 2005, 88, 57–62 CrossRef CAS.
- Q. Wang and W. Shi, Polym. Degrad. Stab., 2006, 91, 1747–1754 CrossRef CAS.
- H. Yang, X. Wang, B. Yu, H. X. Yuan, L. Song, Y. Hu, R. K. K. Yuen and G. H. Yeoh, J. Appl. Polym. Sci., 2013, 128, 2720–2728 CrossRef CAS.
- E. N. Kalali, X. Wang and D. Y. Wang, Ind. Eng. Chem. Res., 2016, 55, 6634–6642 CrossRef CAS.
- B. Schartel, B. Perret, B. Dittrich, M. Ciesielski, J. Kramer, P. Muller, V. Altstadt, L. Zang and M. Doring, Macromol. Mater. Eng., 2016, 301, 9–35 CrossRef CAS.
- X. Wang, L. Song, W. Y. Xing, H. D. Lu and Y. Hu, Mater. Chem. Phys., 2011, 125, 536–541 CrossRef CAS.
- L. C. Wang, J. Q. Jiang, P. K. Jiang and J. H. Yu, J. Polym. Res., 2010, 17, 891–902 CrossRef CAS.
- C. Xie, J. F. Du, Z. Dong, S. F. Sun, L. Zhao and L. Z. Dai, Polym. Eng. Sci., 2016, 56, 441–447 CrossRef CAS.
- S. Chuan, Y. Wu and L. Ling, Polymer, 2002, 43, 4277–4284 CrossRef.
- H. Zhang, M. Xu and B. Li, J. Nanosci. Nanotechnol., 2016, 16, 2811–2821 CrossRef CAS PubMed.
- L. J. Qian, L. J. Ye, Y. Qiu and S. R. Qu, Polymer, 2011, 52, 5486–5493 CrossRef CAS.
- L. J. Qian, L. J. Ye, G. Z. Xu, J. Liu and J. Q. Guo, Polym. Degrad. Stab., 2011, 96, 1118–1124 CrossRef CAS.
- C. H. Lin, C. Y. Wu and C. S. Wang, J. Appl. Polym. Sci., 2000, 78, 228–235 CrossRef CAS.
- B. Perret, B. Schartel, K. Sto, M. Ciesielski, J. Diederichs, M. Doring, J. Kramer and V. Altstadt, Macromol. Mater. Eng., 2011, 296, 14–30 CrossRef CAS.
- Y. L. Liu, Polymer, 2001, 42, 3445–3454 CrossRef CAS.
- H. Liu, X. D. Wang and D. Z. Wu, Polym. Degrad. Stab., 2015, 118, 45–58 CrossRef CAS.
- T. H. Ho, H. J. Huang, J. Y. Shieh and M. C. Chung, Polym. Degrad. Stab., 2008, 93, 2077–2083 CrossRef CAS.
- T. C. Mauldin, M. Zammarano, J. W. Gilman, J. R. Shields and D. J. Boday, Polym. Chem., 2014, 5, 5139–5146 RSC.
- W. Vogt and S. Balasubramanian, Die Makromolekulare Chemie, 1973, 163, 111–134 CrossRef CAS.
- H. Y. Ma, L. F. Tong, Z. B. Xu, Z. P. Fang, Y. M. Jin and F. Z. Lu, Polym. Degrad. Stab., 2007, 92, 720–726 CrossRef CAS.
- X. P. Hu, Y. Y. Guo, L. Chen, X. L. Wang, L. J. Li and Y. Z. Wang, Polym. Degrad. Stab., 2012, 97, 1772–1778 CrossRef CAS.
- P. A. Song, Z. P. Fang, L. F. Tong and Z. B. Xu, Polym. Eng. Sci., 2009, 49, 1326–1331 CrossRef CAS.
- T. C. Mauldin, M. Zammarano, J. W. Gilman, J. R. Shields and D. J. Boday, Polym. Chem., 2014, 5, 5139–5146 RSC.
- G. Camino, G. Martinasso and L. Costa, Polym. Degrad. Stab., 1990, 28, 17–38 CrossRef CAS.
- Z. Y. Wang, X. W. Li, J. N. Li, G. M. Li and J. Q. Tao, J. Polym. Res., 2009, 16, 255–261 CrossRef CAS.
- S. L. Qiu, X. Wang, B. Yu, X. M. Feng, X. W. Mu, R. K. K. Tuen and Y. Hu, J. Hazard. Mater., 2017, 325, 327–339 CrossRef CAS PubMed.
- T. C. Mauldin, M. Zammarano, J. W. Gilman, J. R. Shields and D. J. Boday, Polym. Chem., 2014, 5, 5139–5146 RSC.
- L. H. You, Y. Y. Hui, X. N. Shi and Z. H. Peng, Adv. Mater. Res., 2012, 399, 1376–1380 Search PubMed.
- M. Suzanne, A. Ramani, S. Ukleja, M. McKee, J. Zhang, M. A. Delichatsios, P. Patel, P. Clarke and P. Cusack, Fire Mater., 2018, 42, 18–27 CrossRef CAS.
- M. W. Beach, J. W. Hull, B. A. King, I. I. Beulich, B. G. Stobby, S. L. Kram and D. B. Gorman, Polym. Degrad. Stab., 2017, 135, 99–110 CrossRef CAS.
- K. Malzahn, F. Marsico, K. Koynov, K. Landfester, C. K. Weiss and F. R. Wurm, ACS Macro Lett., 2013, 3, 40–43 CrossRef.
- M. Shirley, A. Anna, T. Stec and H. Richard, Polym. Degrad. Stab., 2014, 106, 36–46 CrossRef.
- A. F. Wang, L. L. Qian, D. M. Xu and K. D. Zhang, Fine Chem., 2008, 25, 1053–1057 CAS.
- P. A. Song, Intumescent Flame Retardation, Nano-Flame Retardation and Synergistic Flame Retardation for Polypropylene, Zhejiang University, 2009 Search PubMed.
- F. Samperi, C. Puglisi, T. Ferreri, R. Messina, G. Cicala, A. Recca, C. L. Restuccia and A. Scamporrino, Polym. Degrad. Stab., 2007, 92, 1304–1315 CrossRef CAS.
| This journal is © The Royal Society of Chemistry 2020 |


